. 2018 Aug 15;198(4):472-485.
doi: 10.1164/rccm.201709-1917OC.

Positive End-Expiratory Pressure Ventilation Induces Longitudinal Atrophy in Diaphragm Fibers

Affiliations

Positive End-Expiratory Pressure Ventilation Induces Longitudinal Atrophy in Diaphragm Fibers

Johan Lindqvist et al. Am J Respir Crit Care Med. .

Abstract

Rationale: Diaphragm weakness in critically ill patients prolongs ventilator dependency and duration of hospital stay and increases mortality and healthcare costs. The mechanisms underlying diaphragm weakness include cross-sectional fiber atrophy and contractile protein dysfunction, but whether additional mechanisms are at play is unknown.

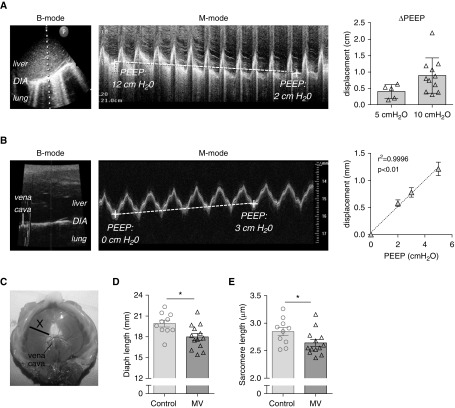
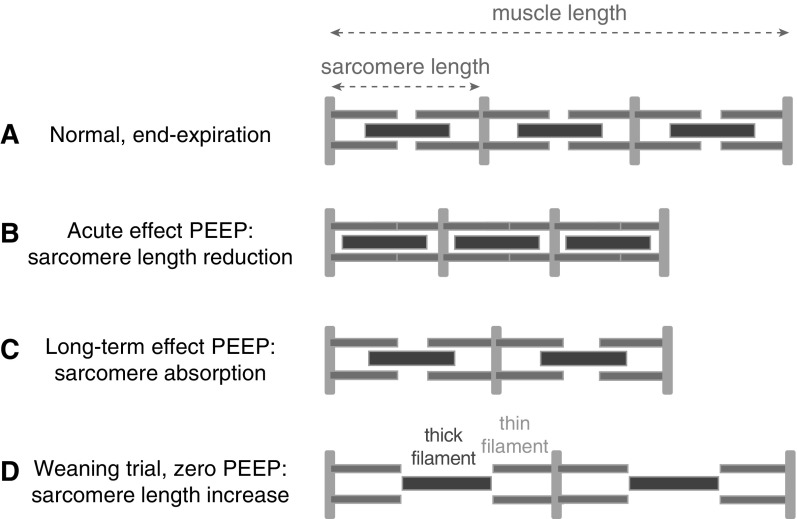
Objectives: To test the hypothesis that mechanical ventilation with positive end-expiratory pressure (PEEP) induces longitudinal atrophy by displacing the diaphragm in the caudal direction and reducing the length of fibers.

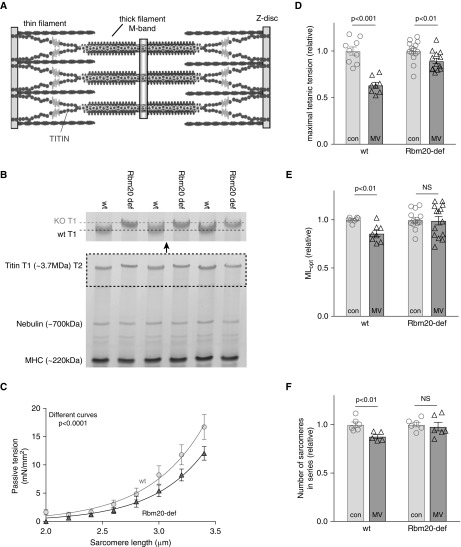
Methods: We studied structure and function of diaphragm fibers of mechanically ventilated critically ill patients and mechanically ventilated rats with normal and increased titin compliance.

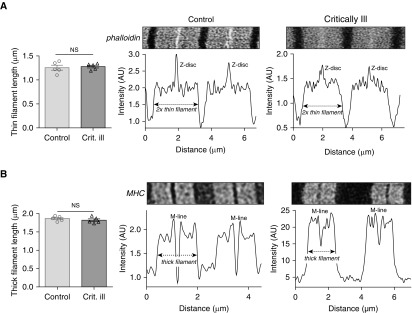
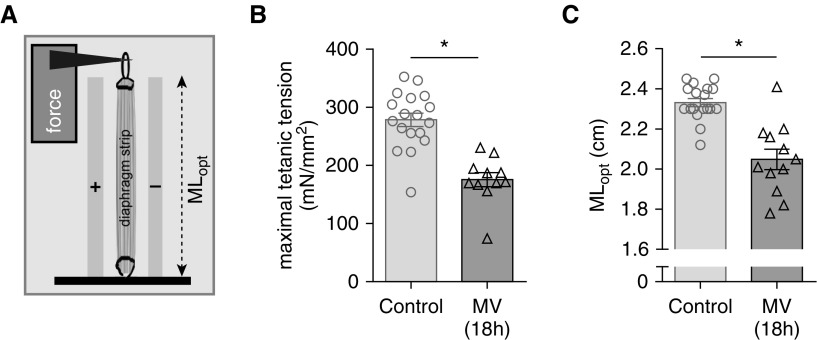
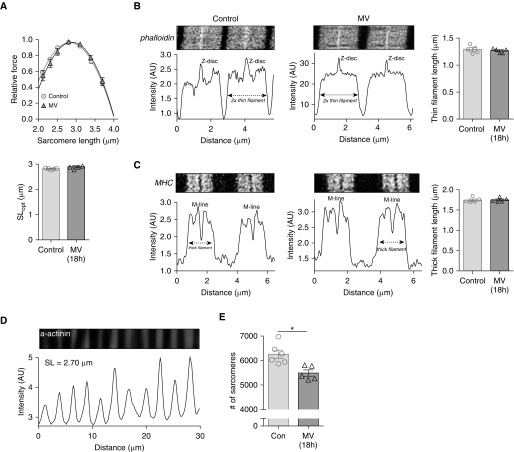
Measurements and main results: PEEP causes a caudal movement of the diaphragm, both in critically ill patients and in rats, and this caudal movement reduces fiber length. Diaphragm fibers of 18-hour mechanically ventilated rats (PEEP of 2.5 cm H2O) adapt to the reduced length by absorbing serially linked sarcomeres, the smallest contractile units in muscle (i.e., longitudinal atrophy). Increasing the compliance of titin molecules reduces longitudinal atrophy.

Conclusions: Mechanical ventilation with PEEP results in longitudinal atrophy of diaphragm fibers, a response that is modulated by the elasticity of the giant sarcomeric protein titin. We postulate that longitudinal atrophy, in concert with the aforementioned cross-sectional atrophy, hampers spontaneous breathing trials in critically ill patients: during these efforts, end-expiratory lung volume is reduced, and the shortened diaphragm fibers are stretched to excessive sarcomere lengths. At these lengths, muscle fibers generate less force, and diaphragm weakness ensues.

Keywords: PEEP; critically ill; diaphragm; mechanical ventilation.


Figures

Figure 1.
Figure 1.
(A) Ultrasonographic view of the diaphragm (DIA) in a critically ill patient in the region of the liver dome, with B-mode image (left) and M-mode image (middle). The vertical dotted line in the left panel shows the location where the M-mode image was obtained, and P indicates the position of the probe. The M-mode image shows the acute effect of a 10 cm H2O positive end-expiratory pressure (PEEP) change on the position of the DIA, measured at end-expiration (indicated by dashed line); note that in this patient PEEP was decreased from 12 to 2 cm H2O, resulting in a cranial DIA displacement. Right: Cranial DIA displacement in critically ill patients caused by a 5 cm H2O PEEP reduction (n = 5) or by a 10 cm H2O PEEP reduction (n = 10); each data point is the average of three measurements per patient. (B) Ultrasonographic view of the DIA in rat during mechanical ventilation in the region of the liver dome is shown, with B-mode image (left) and corresponding M-mode image (middle). The vertical gray line shows the location where the M-mode image was obtained. The M-mode image shows that an increase of PEEP with 3 cm H2O causes an acute caudal movement of the DIA, measured at end-expiration (dashed line). Right panel shows the effect of 2, 3, and 5 cm H2O ∆PEEP on caudal DIA displacement; each data point is the average of five rats. (C) Image of an excised rat DIA, illustrating the midcostal position (X) where a strip was isolated for measurement of DIA fiber and sarcomere length in in vivo–fixated rats. (D) DIA fiber length in in vivo–fixated PEEP-ventilated (2.5 cm H2O) rats and nonventilated rats; each data point represents one rat. (E) DIA sarcomere length in in vivo–fixated PEEP-ventilated (2.5 cm H2O) rats and nonventilated rats; each data point represents one rat. Data in A and B show mean ± SD, and in D and E show mean ± SEM. *P ≤ 0.05. Diaph = diaphragm; MV = mechanical ventilation.
Figure 2.
Figure 2.
(A) Schematic showing the force–sarcomere length relation of a diaphragm fiber of a control patient; SLopt is the sarcomere length at which maximal force is generated; SL50 is the sarcomere length at which 50% of maximal force is generated; SLmax is the sarcomere length at which no force is generated. Right panel shows schematics of a sarcomere with the corresponding lengths. (B) Force–sarcomere length relation of diaphragm fibers of 12 critically ill and 12 control patients are shown; note that both relations overlap. Force is presented as percentage of maximal force. (CE) SLopt (C), SL50 (D), and SLmax (E) are comparable between critically ill and control patients. Note that SLopt, SL50, and SLmax were not different between slow- and fast-twitch fibers (data not shown), and therefore these data are pooled. Also, in line with previous work (–15), the maximal force-generating capacity was lower in both slow- and fast-twitch fibers of critically ill patients (data not shown). Each data point represents the average of ∼10 fibers per subject. Data presented are mean ± SEM. Con = control patients; Crit.Ill = critically ill patients; NS = not significant.
Figure 3.
Figure 3.
(A) Deconvolved stimulated emission depletion (STED) superresolution microscopy images of sarcomeres in a diaphragm fiber of a control and a critically ill patient, labeled with AlexaFluor-conjugated phalloidin to visualize the thin filaments. Intensity measurements were used to determine thin filament length, which was comparable between critically ill and control patients. (B) Deconvolved STED superresolution microscopy images of sarcomeres in a diaphragm fiber of a control and a critically ill patient, labeled with MHC (myosin heavy chain) antibodies to visualize the thick filaments, are shown. Intensity measurements were used to determine thick filament length, which was comparable between critically ill and control patients. Note that each data point represents the average of 50 to 100 sarcomeres per subject. Data presented are mean ± SEM. AU = arbitrary units; Crit. ill = critically ill patient; NS = not significant.
Figure 4.
Figure 4.
In vitro contractility of electrically stimulated diaphragm strips of 18-hour mechanically ventilated (MV) rats. (A) Schematic showing a full-length diaphragm strip in the experimental setup. The strips were isolated from the midcostal region, similar to location X in Figure 1C. MLopt is the strip length at which maximal force is generated. (B) The maximal tension (force normalized to the cross-sectional area of the strip) was significantly lower in rats that were MV for 18 hours. (C) MLopt was significantly shorter in the rats that were MV for 18 hours. Note that each data point represents one rat. Data presented are mean ± SEM. *P ≤ 0.05.
Figure 5.
Figure 5.
(A) Top: Force–sarcomere length relation of diaphragm fibers of 18-hour mechanically ventilated (MV) rats and control rats; note that both relations overlap. Force is presented as percentage of maximal force; each data point is the average of five rats. Bottom: SLopt is comparable between MV and control rats. Note that ∼90% of fibers were fast-twitch, and therefore both fiber types were pooled. In line with previous work (32, 50), the maximal force-generating capacity was lower in fibers of MV rats (data not shown). (B) Deconvolved stimulated emission depletion (STED) superresolution microscopy images of sarcomeres in a diaphragm fiber of a control and an 18-hour MV rat, labeled with AlexaFluor-conjugated phalloidin to visualize the thin filaments. Intensity measurements were used to determine thin filament length, which was comparable between 18-hour MV and control rats. Each data point represents one rat. (C) Deconvolved STED superresolution microscopy images of sarcomeres in a diaphragm fiber of a control and an 18-hour MV rat, labeled with MHC (myosin heavy chain) antibodies to visualize the thick filaments. Intensity measurements were used to determine thick filament length, which was comparable between 18-hour MV and control rats. Each data point represents one rat. (D) Typical α-actinin staining in a rat diaphragm fiber to visualize the Z-discs to determine sarcomere length. (E) The number of sarcomeres in series is significantly lower in 18-hour MV rats than in control rats. Each data point represents the average of one rat; 2,000 to 3,000 sarcomeres were measured per rat. Data presented are mean ± SEM. *P ≤ 0.05. AU = arbitrary units; Con = control; SL = sarcomere length; SLopt = sarcomere length at which maximal force is generated.
Figure 6.
Figure 6.
(A) Schematic of the layout of the giant protein titin in the muscle sarcomere. (B) Bottom: 1% sodium dodecyl sulfate–agarose gel illustrating the slower mobility of the larger titin isoform in the RNA binding motif 20 (Rbm20)-deficient rats. T1 is full-length titin, T2 is a titin degradation product. Top: Magnification of T1 titin; note the lower titin mobility in Rbm20-deficient rats. (C) Passive tension–sarcomere length relation in diaphragm fibers. Note that the larger titin isoform in Rbm20-deficient rats results in lower passive tension (each data point represents the average of six rats). (D) Eighteen hours of mechanical ventilation causes significant contractile weakness of intact diaphragm strips in control rats. The development of this weakness is blunted in 18-hour mechanically ventilated Rbm20-deficient rats. (E) The strip length at which maximal force is generated (MLopt) is reduced in 18-hour mechanically ventilated control rats, but this reduction is absent in Rbm20-deficient rats. (F) The number of sarcomeres in series is not significantly reduced in 18-hour mechanically ventilated Rbm20-deficient rats compared with nonventilated Rbm20-deficient rats. Each data point represents one rat; 2,000 to 3,000 sarcomeres were measured per rat. Data presented are mean ± SEM. con = control; KO = knockout; MHC = myosin heavy chain; MV = mechanical ventilation; NS = not significant; Rbm20-def = RNA binding motif 20–deficient; wt = wild type.
Figure 7.
Figure 7.
Schematic illustrating the development of longitudinal atrophy in diaphragm fibers during mechanical ventilation with positive end-expiratory pressure (PEEP). (A) Muscle length in a spontaneous breathing rat at end-expiration. For simplicity, only three sarcomeres are drawn. (B) The acute effect of PEEP on sarcomere length. (C) Long-term PEEP causes sarcomere absorption to restore sarcomere length. (D) During weaning and normalization of end-expiratory pressure, the diaphragm fibers are stretched to lengths beyond optimal sarcomere length. The schematic shows a length at which thick–thin filament overlap is absent and no force can be generated by the muscle fiber.

Comment in

References

    1. Watson AC, Hughes PD, Louise Harris M, Hart N, Ware RJ, Wendon J, et al. Measurement of twitch transdiaphragmatic, esophageal, and endotracheal tube pressure with bilateral anterolateral magnetic phrenic nerve stimulation in patients in the intensive care unit. Crit Care Med. 2001;29:1325–1331. - PubMed
    1. Hermans G, Agten A, Testelmans D, Decramer M, Gayan-Ramirez G. Increased duration of mechanical ventilation is associated with decreased diaphragmatic force: a prospective observational study. Crit Care. 2010;14:R127. - PMC - PubMed
    1. Jaber S, Petrof BJ, Jung B, Chanques G, Berthet JP, Rabuel C, et al. Rapidly progressive diaphragmatic weakness and injury during mechanical ventilation in humans. Am J Respir Crit Care Med. 2011;183:364–371. - PubMed
    1. Gottesman E, McCool FD. Ultrasound evaluation of the paralyzed diaphragm. Am J Respir Crit Care Med. 1997;155:1570–1574. - PubMed
    1. Goligher EC, Fan E, Herridge MS, Murray A, Vorona S, Brace D, et al. Evolution of diaphragm thickness during mechanical ventilation. impact of inspiratory effort. Am J Respir Crit Care Med. 2015;192:1080–1088. - PubMed

Publication types

LinkOut - more resources