. 2018 Mar 26;14(3):e1005985.
doi: 10.1371/journal.pcbi.1005985. eCollection 2018 Mar.

A mechanistic pan-cancer pathway model informed by multi-omics data interprets stochastic cell fate responses to drugs and mitogens

Affiliations

A mechanistic pan-cancer pathway model informed by multi-omics data interprets stochastic cell fate responses to drugs and mitogens

Mehdi Bouhaddou et al. PLoS Comput Biol. .

Erratum in

Abstract

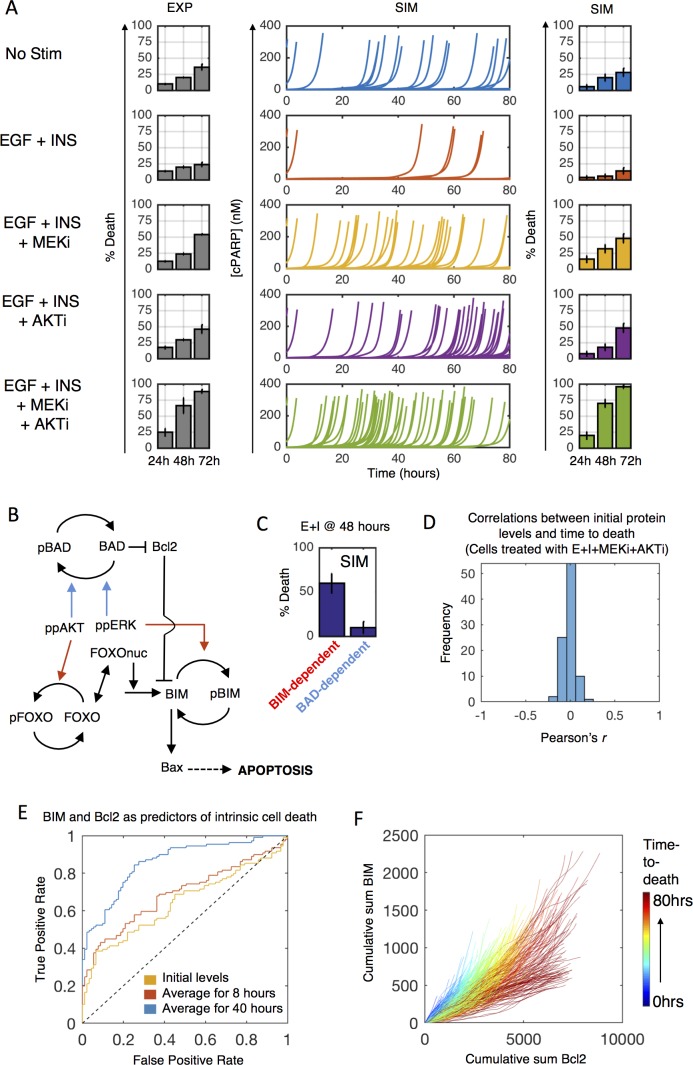
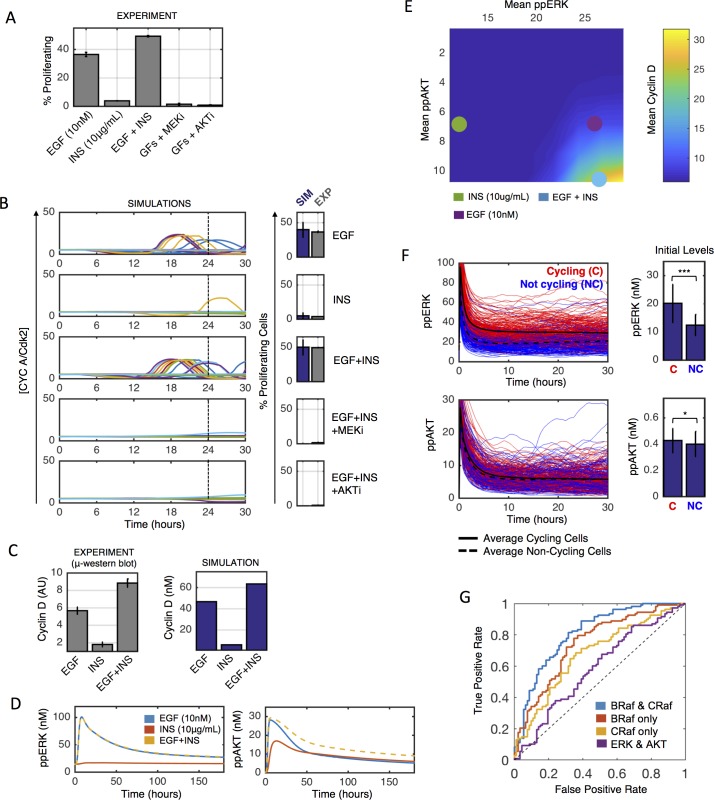
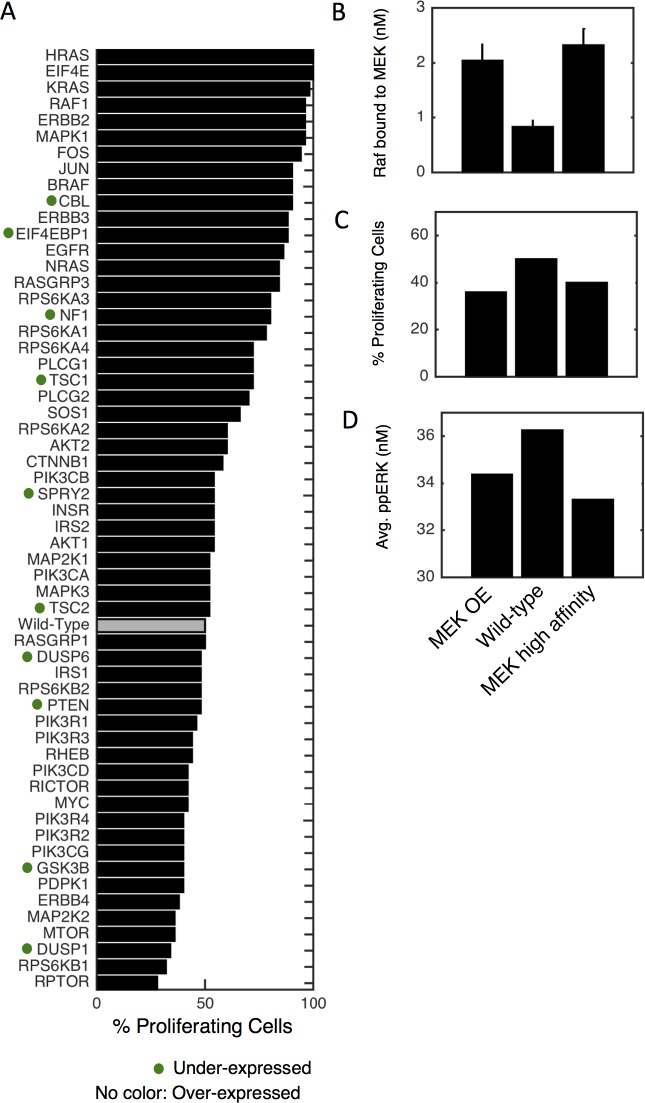
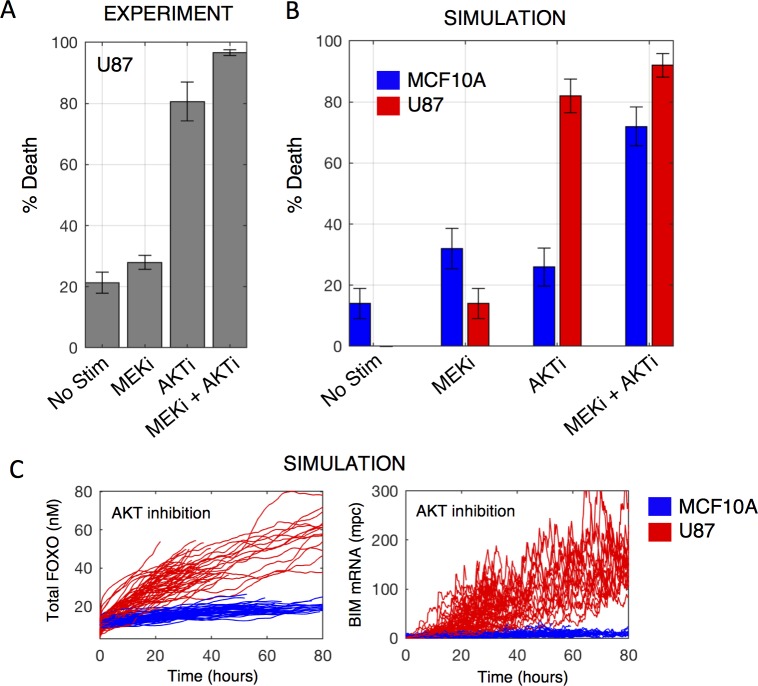
Most cancer cells harbor multiple drivers whose epistasis and interactions with expression context clouds drug and drug combination sensitivity prediction. We constructed a mechanistic computational model that is context-tailored by omics data to capture regulation of stochastic proliferation and death by pan-cancer driver pathways. Simulations and experiments explore how the coordinated dynamics of RAF/MEK/ERK and PI-3K/AKT kinase activities in response to synergistic mitogen or drug combinations control cell fate in a specific cellular context. In this MCF10A cell context, simulations suggest that synergistic ERK and AKT inhibitor-induced death is likely mediated by BIM rather than BAD, which is supported by prior experimental studies. AKT dynamics explain S-phase entry synergy between EGF and insulin, but simulations suggest that stochastic ERK, and not AKT, dynamics seem to drive cell-to-cell proliferation variability, which in simulations is predictable from pre-stimulus fluctuations in C-Raf/B-Raf levels. Simulations suggest MEK alteration negligibly influences transformation, consistent with clinical data. Tailoring the model to an alternate cell expression and mutation context, a glioma cell line, allows prediction of increased sensitivity of cell death to AKT inhibition. Our model mechanistically interprets context-specific landscapes between driver pathways and cell fates, providing a framework for designing more rational cancer combination therapy.


Conflict of interest statement

The authors have declared that no competing interests exist.

Figures

Fig 1
Fig 1. Model overview.
A) Cartoon schematic of the single-cell pan-cancer driver network model. RTK, proliferation and growth, cell cycle, apoptosis, DNA damage, and gene expression submodels, with genes, compartments (capitalized italic) and general interactions indicated (light blue lines). Detailed kinetic mechanisms are in S1 Fig). B) We first evaluate individual submodel behavior (unit testing), followed by integrated unit testing of all submodels together. We then use the model to reason about biological observations.
Fig 2
Fig 2. Context tailoring and stochastic gene expression.
A) Gene copy number, mRNA levels, and protein levels inform initial conditions and expression submodel parameters. Gene switching, mRNA synthesis, and mRNA degradation are stochastic, whereas all other processes are deterministic, with a 30 second update interval. B) Example simulations for ERK. Two ERK isoform genes (MAPK1-blue and MAPK3-red; top two plots) switch between active and inactive states, leading to transcription noise (third plot down). Transcripts are summed into the signaling conglomerate ERK (fourth plot down). C) Coefficient of variation (CV) of protein (red) and mRNA (blue) levels across a population of 100 stochastically simulated cells after 24-hour serum-starvation. D) Overview of tailoring and running model. Multi-omic data from serum-starved cells sets initial conditions (“PREP”). Then, a deterministically-simulated initialization procedure maintains consistency with experimental observations in the presence of basal signaling activities resulting in a serum-starved single average cell at steady-state. From there, we run either deterministic or stochastic simulations. Prior to simulating any stimuli for stochastic simulations, we create a population of N number of cells by running the model for a 24-hour period in the serum-starved state an N number of times.
Fig 3
Fig 3. Unit testing.
A) Ligand-receptor cooperativity for RTK submodel (dots-deterministic simulations; lines- hill equation fit) based on ligand-matched receptor expression (each receptor expressed in isolation and at appreciable levels). B-D) μ-Western blot data (left column) used to train simulated (right column) ERK (B), AKT (C), and mTOR (pEIF4E-BP1) (D) signaling dynamics in the proliferation and growth submodel. Serum and growth factor starved MCF10A cells were stimulated with indicated doses of EGF, insulin, and combinations (High/Low EGF 10/0.01 nM, High/Low Insulin 1721/0.17 nM) for 5, 30, 180, or 360 minutes. E) DNA damage-induced p53 responses to single-stranded breaks (top), double-stranded breaks (middle), and both (bottom), with (red) and without (blue) simulated repair. F) Stochastic simulations for how the number of p53 pulses (top), pulse height (middle) and width (bottom) depend on DNA damage level. G) Increasing amounts of TRAIL (increasingly warmer colors) decreases time to death (as indicated by cPARP spike) exponentially (right panel: red dots-simulation; line-exponential fit). H) Survival after 5 hours TRAIL treatment. Red dots-simulation; red line-sigmoid fit; black dots-flow cytometry data. I) Effects of PUMA, NOXA, ppERK and ppAKT on time-to-death in deterministic simulations. J) Simulated cell cycle initiation by increasing cyclin D mRNA levels in serum-starved cells indicates proper oscillatory behavior of cyclin-CDK complexes.
Fig 4
Fig 4. Etoposide response dynamics in dividing and non-dividing cells.
A) Experiments (left, grey, flow cytometry) and simulations (right, blue) for MCF10A cells treated with etoposide (100μM) for 24, 48, and 72 hours in the presence of no growth factors (top) or EGF (20ng/mL) + insulin (10μg/mL) (bottom). B-C) Stochastic simulations for (B) serum-starved or (C) EGF + insulin with 72 hour etoposide treatment. D) Quantification of simulation results from (C) for wild type (blue) or p21/Chk1 loss cells (red).
Fig 5
Fig 5. Intracellular regulation of stochastic apoptosis.
A) Serum-starved MCF10A cells were treated as indicated (EGF-20ng/mL, insulin-10μg/mL, MEKi-10μM, AKTi-10μM) and assayed for cell death by flow cytometry (left, grey bars). Single cell simulations (middle, each line) show time to death (indicated by cPARP spike), quantified by colored bars (right). Colors represent treatment condition. B) Model structure for ppERK and ppAKT regulation of apoptosis through BAD (blue arrows) and BIM (red arrows). C) Simulations where BAD-dependent (blue arrows in B) or BIM-dependent (red arrows in B) mechanisms were switched off and percent death calculated in response to EGF + insulin at 48 hours. D) Correlation of initial protein levels with time-to-death for 400 simulated cells treated with EGF + insulin + MEKi + AKTi. E) ROC curves for predicting cell death from time-averaged BIM and Bcl2 levels based on 400 simulated cells (200 training/200 validation) treated as in (D) (blue-AUC = 0.86; red-AUC = 0.69; yellow-AUC = 0.64). F) Cumulative sum of BIM and Bcl2 levels for simulated cells up until their time of death for all conditions in (A). Color shows time to death.
Fig 6
Fig 6. Regulation of stochastic proliferation.
A) Serum-starved MCF10A cells were treated as indicated for 24 hours and then assayed for cell cycle progression via flow cytometry (MEKi-10μM; AKTi-10μM). Percent proliferating cells are S-phase plus G2/M minus that in serum-starved controls (<~5%). GFs: Growth Factors (EGF + insulin). B) Model fit. C) Measured (left) and simulated (right) cyclin D levels 6 hours post stimulation of serum-starved cells. D) Deterministic simulations of ppERK (left) and ppAKT (right) response of starved cells to indicated growth factors. E) Simulated relationships between time-averaged ppERK and ppAKT with cyclin D levels (heatmap colors). Colored circles indicate values for different treatments. F) 400 simulated cells treated with EGF + insulin were cycling (red; divided before 30 hours) or non-cycling (blue; did not divide before 30 hours). Right: Initial levels of ppERK or ppAKT in the same simulations. G) ROC curves predicting proliferation from 400 simulated cells (200 training/200 validation) following EGF + ins from initial BRaf and CRaf levels (blue-AUC = 0.81; red-AUC = 0.74; yellow-AUC = 0.68; purple-AUC = 0.59).
Fig 7
Fig 7. Simulated transformation.
A) The mRNA level of each gene is altered 10-fold and EGF + insulin response of starved cells for 24 hours is simulated. Gray bar denotes wild-type, dots denote tumor suppressors (10-fold reduction), and no label denote proto-oncogenes (10-fold increase). B-D) MAP2K2 overexpression (OE-left), wild-type (middle), and MEK-Raf high affinity (right, unphosphorylated MEK has 10-fold higher affinity for all Raf species) were simulated as above and either the level of Raf bound to MEK at t = 0 (B), % proliferating cells (C) or time-averaged ppERK levels (D) were calculated.
Fig 8
Fig 8. Predicting cell death responses in U87 cells.
A) Serum-starved U87 cells were treated as indicated (MEKi-10μM; AKTi-10μM) for 48 hours and percent of cell death was measured via flow cytometry. B) Simulation results comparing cell death responses of a U87-tailored (red) and MCF10A-tailored (blue) model. C) Single cell traces comparing U87 (red) to MCF10A (blue) total FOXO (nuclear + cytoplasmic forms; left) and BIM mRNA levels (right).

References

    1. Druker BJ, Talpaz M, Resta DJ, Peng B, Buchdunger E, Ford JM, et al. Efficacy and safety of a specific inhibitor of the BCR-ABL tyrosine kinase in chronic myeloid leukemia. N Engl J Med. 2001;344: 1031–7. doi: 10.1056/NEJM200104053441401 - DOI - PubMed
    1. Cobleigh MA, Vogel CL, Tripathy D, Robert NJ, Scholl S, Fehrenbacher L, et al. Multinational study of the efficacy and safety of humanized anti-HER2 monoclonal antibody in women who have HER2-overexpressing metastatic breast cancer that has progressed after chemotherapy for metastatic disease. J Clin Oncol. 1999;17: 2639–48. doi: 10.1200/JCO.1999.17.9.2639 - DOI - PubMed
    1. Vogel CL, Cobleigh MA, Tripathy D, Gutheil JC, Harris LN, Fehrenbacher L, et al. Efficacy and safety of trastuzumab as a single agent in first-line treatment of HER2-overexpressing metastatic breast cancer. J Clin Oncol. 2002;20: 719–26. doi: 10.1200/JCO.2002.20.3.719 - DOI - PubMed
    1. Poulikakos PI, Zhang C, Bollag G, Shokat KM, Rosen N. RAF inhibitors transactivate RAF dimers and ERK signalling in cells with wild-type BRAF. Nature. 2010;464: 427–30. doi: 10.1038/nature08902 - DOI - PMC - PubMed
    1. Flaherty KT, Robert C, Hersey P, Nathan P, Garbe C, Milhem M, et al. Improved survival with MEK inhibition in BRAF-mutated melanoma. N Engl J Med. 2012;367: 107–14. doi: 10.1056/NEJMoa1203421 - DOI - PubMed

Publication types