. 2018 Apr 27;69(10):2527-2541.
doi: 10.1093/jxb/ery103.

The bHLH transcription factor GmPIB1 facilitates resistance to Phytophthora sojae in Glycine max

Affiliations

The bHLH transcription factor GmPIB1 facilitates resistance to Phytophthora sojae in Glycine max

Qun Cheng et al. J Exp Bot. .

Abstract

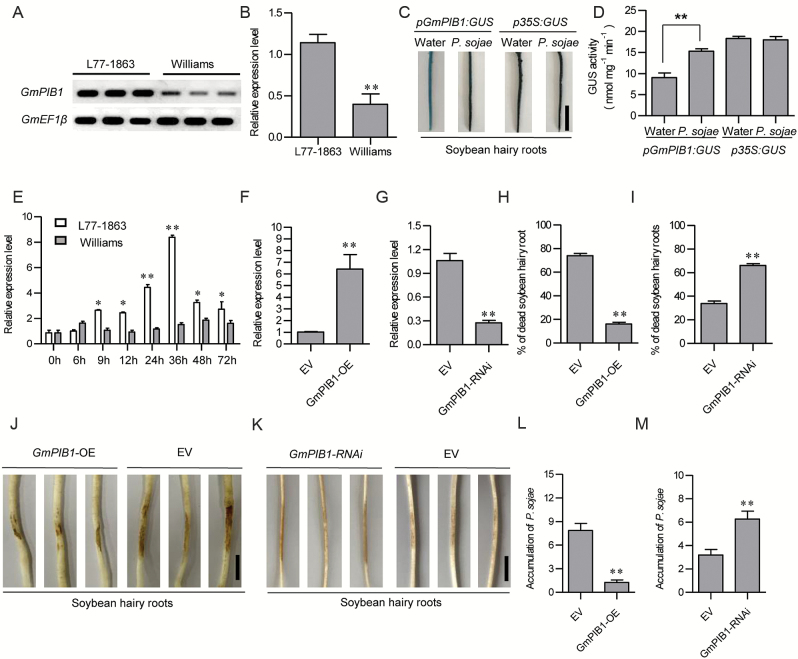
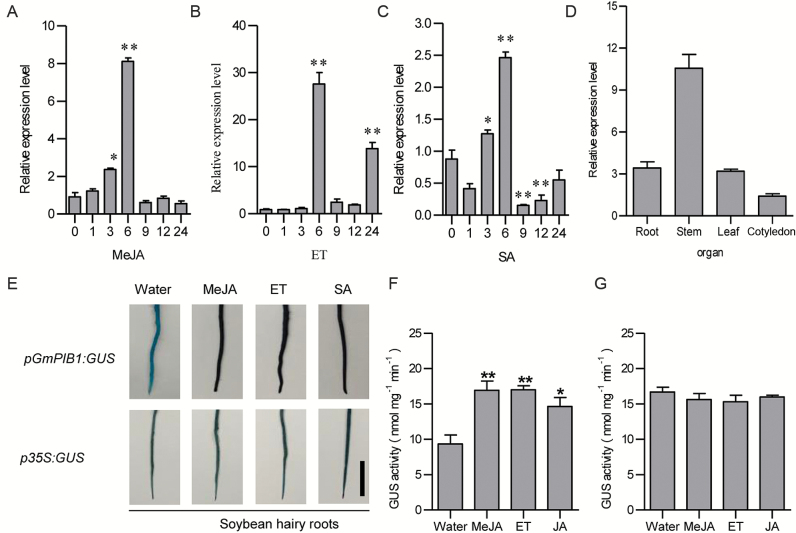
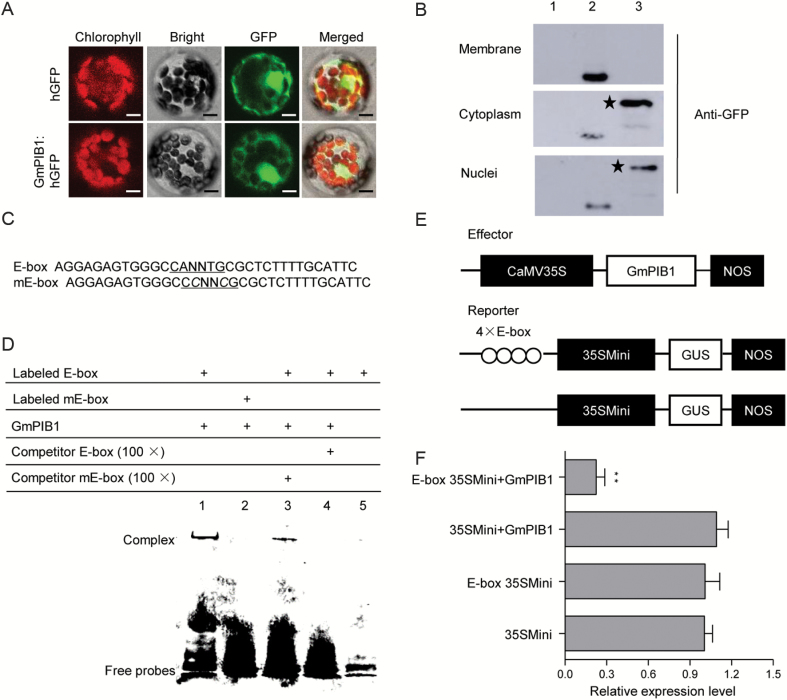
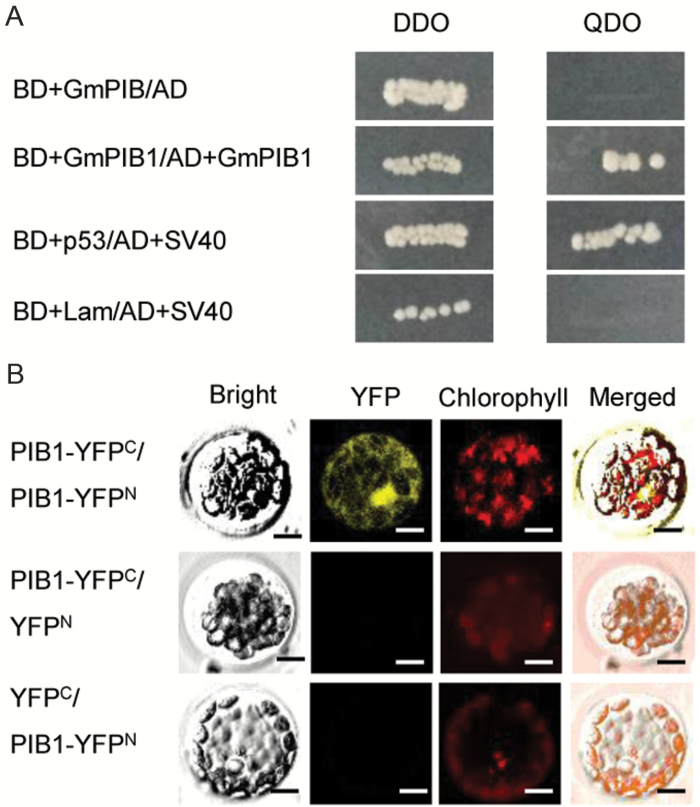
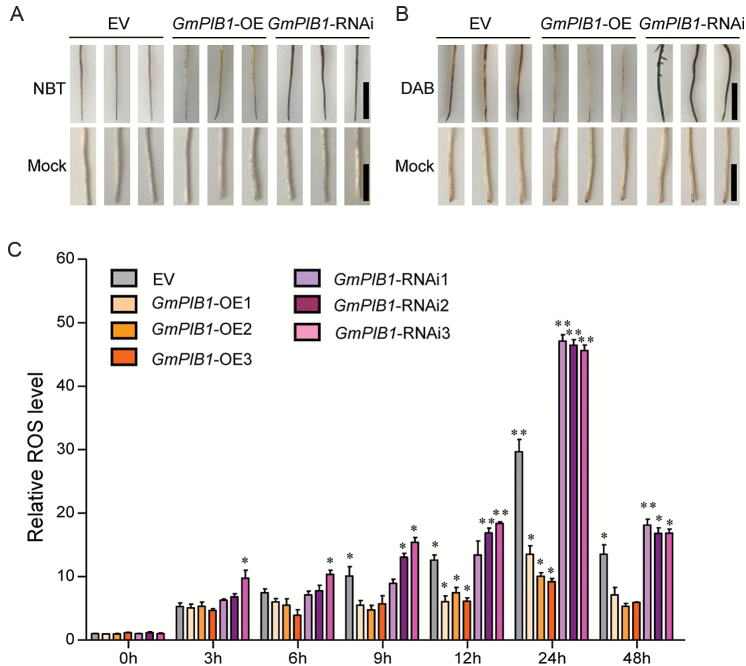
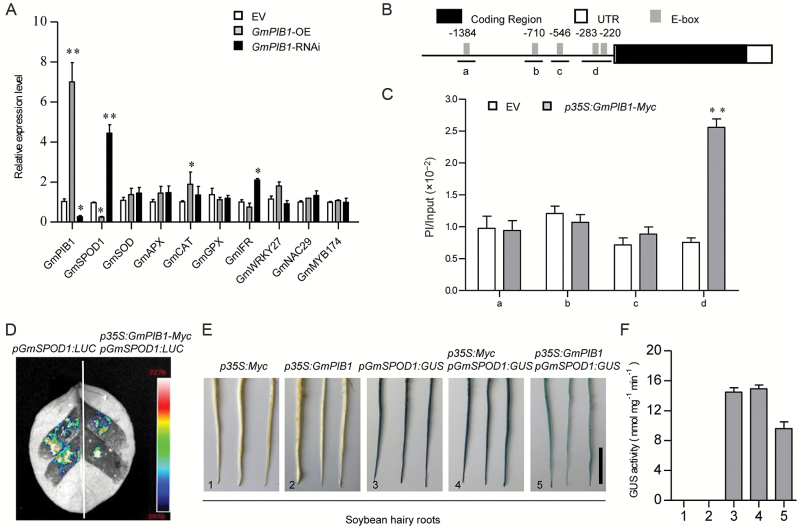
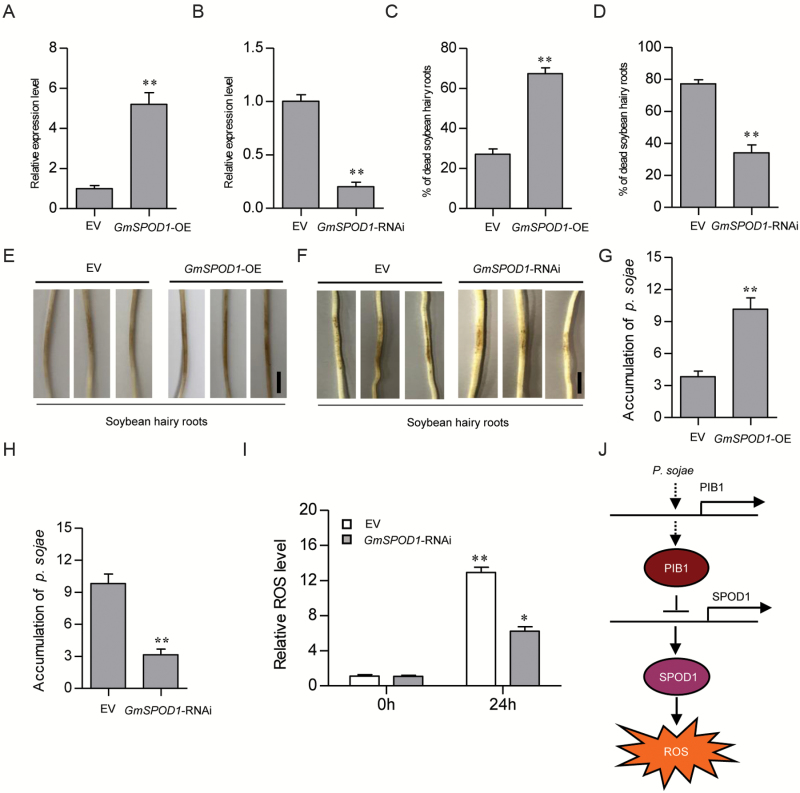
Phytophthora sojae Kaufmann and Gerdemann causes Phytophthora root rot, a destructive soybean disease worldwide. A basic helix-loop-helix (bHLH) transcription factor is thought to be involved in the response to P. sojae infection in soybean, as revealed by RNA sequencing (RNA-seq). However, the molecular mechanism underlying this response is currently unclear. Here, we explored the function and underlying mechanisms of a bHLH transcription factor in soybean, designated GmPIB1 (P. sojae-inducible bHLH transcription factor), during host responses to P. sojae. GmPIB1 was significantly induced by P. sojae in the resistant soybean cultivar 'L77-1863'. Analysis of transgenic soybean hairy roots with elevated or reduced expression of GmPIB1 demonstrated that GmPIB1 enhances resistance to P. sojae and reduces reactive oxygen species (ROS) accumulation. Quantitative reverse transcription PCR and chromatin immunoprecipitation-quantitative PCR assays revealed that GmPIB1 binds directly to the promoter of GmSPOD1 and represses its expression; this gene encodes a key enzyme in ROS production. Moreover, transgenic soybean hairy roots with GmSPOD1 silencing through RNA interference exhibited improved resistance to P. sojae and reduced ROS generation. These findings suggest that GmPIB1 enhances resistance to P. sojae by repressing the expression of GmSPOD1.


Figures

Fig. 1.
Fig. 1.
Transcriptional analysis of GmPIB1. (A) Expression patterns of GmPIB1 in susceptible soybean cultivar ‘Williams’ and resistant cultivar ‘L77-1863’, as assessed by RT-PCR. (B) Expression patterns of GmPIB1 in susceptible cultivar ‘Williams’ and resistant cultivar ‘L77-1863’, as assessed by qPCR. (C) GmPIB1 promoter-driven GUS expression in transgenic soybean hairy roots treated with P. sojae or water for 48 h. Bars, 1 cm. (D) GUS activity analysis of GmPIB1 promoter expression. GUS activity was measured using a 4-methylumbelliferyl-D-glucuronide assay. The data represent the means ±SD of three independent experiments. (E) Relative expression of GmPIB1 in soybean cultivars ‘Williams’ and ‘L77-1863’ upon P. sojae infection. The infected samples were collected at 0, 6, 9, 12, 24, 36, 48, and 72 h after inoculation with P. sojae (race 1). Relative GmPIB1 transcript levels were compared with mock-treated plants at the same time point. (F, G) qRT-PCR analysis of relative GmPIB1 expression in transgenic soybean hairy roots. Empty vector (EV) transgenic soybean hairy roots were used as controls. (H, I) Percentages of dead EV, GmPIB1-OE, and GmPIB1-RNAi roots after 5 d of P. sojae infection. Each experiment contained at least 50 roots per line, and roots were scored as dead when they were completely rotten. (J, K) Typical infection phenotypes of GmPIB1-OE, GmPIB1-RNAi, and EV soybean hairy roots after 2 d of P. sojae inoculation. Bars, 1 cm. (L, M) Accumulation of P. sojae biomass in transgenic soybean hairy roots and EV. Phytophthora sojae TEF1 (EU079791) transcript levels in infected soybean hairy roots (2 d) were plotted relative to soybean GmEF1β (NM_001248778) expression levels, as determined by qRT-PCR. The amplification of soybean GmEF1β was used as an internal control to normalize all data. The experiment was performed using three biological replicates, each with three technical replicates, and differences were statistically analysed using Student’s t-test (*P<0.05, **P<0.01). Bars indicate standard error of the mean. (This figure is available in color at JXB online.)
Fig. 2.
Fig. 2.
Expression patterns of GmPIB1 in soybean. (A–C) GmPIB1 expression in soybean leaves in response to exogenous hormones: 100 μM MeJA, 2 mM SA, and ET treatment for 0, 1, 3, 6, 9, 12, and 24 h. Fourteen-day-old plants were used for treatments and analyses. Relative GmPIB1 transcript levels were compared with mock-treated plants at the same time point. Soybean GmEF1β was used as an internal control to normalize all data. Three biological replicates were averaged and statistically analysed using Student’s t-test (*P<0.05, **P<0.01). Bars indicate standard error of the mean. (D) GmPIB1 mRNA levels in various soybean plant tissues. Leaves, roots, and stems were harvested from 14-day-old plants. The experiment was performed on three biological replicates, each with three technical replicates. Bars indicate standard error of the mean. (E) GUS histochemical staining analysis of pGmPIB1:GUS. pGmPIB1:GUS and p35S:GUS transgenic soybean hairy roots were produced by A. tumefaciens-mediated transformation and treated with 100 μM MeJA, 2 mM SA, or ET for 6 h. GUS histochemical staining results 3 h after treatment are shown compared with roots treated with water. Bars, 1 cm. (F) GUS activity analysis of GmSPOD1 promoter expression. GUS activity was measured using a 4-methylumbelliferyl-D-glucuronide assay. The data represent the means ±SD of three independent experiments. (This figure is available in color at JXB online.)
Fig. 3.
Fig. 3.
Sequence-specific binding activity of GmPIB1 to the E-box element. (A) Subcellular localization of GmPIB1–hGFP fusion protein. Subcellular localization was investigated in Arabidopsis protoplasts by confocal microscopy. The fluorescence from humanized GFP (hGFP) and the fusion protein GmPIB1–hGFP was observed under white light, UV light, and red light separately. Bars, 10 μm. (B) Immunoblot analysis detecting GmPIB1–hGFP fusion protein in the cytoplasm and nuclei. Line 1, Arabidopsis protoplasts (negative control); line 2, hGFP; line 3, GmPIB1–hGFP fusion protein. Anti-GFP was used to detect GmPIB1–GFP fusion protein in Arabidopsis cells. An asterisk denotes the specific band of the fusion protein GmPIB1–hGFP. (C) Nucleotide sequences of the E-box and mE-box probes. (D) EMSA showing sequence-specific binding of the recombinant GmPIB1 protein to the E-box. Lane 1, labeled E-box probe and GmPIB1 protein; lane 2, labeled mE-box probe and GmPIB1 protein; lane 3, titration using a cold mE-box sequence as a competitor; lane 4, titration using a cold E-box sequence as a competitor; lane 5, EMSA performed with only the free E-box probe. (E) Schematic diagram of the reporter and effector constructs. The reporter plasmids contained four repeats of the E-box sequence and 35Smini, and the effector plasmids encoded GmPIB1 under the control of the CaMV 35S promoter. (F) Relative GUS activity in transactivation assays. The effector and reporter plasmids were co-transfected into Arabidopsis protoplasts. The numbers show the fold increase in GUS activity compared with the vector E-box/35Smini promoter (E-box 35SMini) alone. The experiments were performed on three biological replicates and statistically analysed using Student’s t-test (**P<0.01). Bars indicate standard error of the mean. (This figure is available in color at JXB online.)
Fig. 4.
Fig. 4.
GmPIB1 forms a homodimer in yeast cells and in planta. (A) Yeast cells of strain Y2H harboring pGBKT7-GmPIB1 and pGADT7-GmPIB1 plasmid combinations were grown on either SD/−Trp/−Leu or SD/−Trp/−Leu/−His/−Ade medium. Yeast cells carrying the pGBKT7-53 and pGADT7-SV40 plasmids were used as the positive control; yeast cells harboring the pGBKT7-Lam and pGADT7-SV40 plasmids were used as the negative control. (B) BiFC analysis of the interaction of GmPIB1 with itself. GmPIB1–YFPN and GmPIB1–YFPC were co-transfected into Arabidopsis protoplasts. The bright-field, YFP fluorescence (yellow), chlorophyll autofluorescence (red), and combined images were visualized under a confocal microscope 16 h after transfection. Bars, 10 μm. (This figure is available in color at JXB online.)
Fig. 5.
Fig. 5.
Analysis of ROS levels in GmPIB1-OE, GmPIB1-RNAi, and EV transgenic soybean hairy roots. (A) NBT staining of O2 in 20-day-old EV, GmPIB1-OE, and GmPIB1-RNAi soybean hairy roots after P. sojae zoospore treatment for 48 h. Bars, 1 cm. (B) DAB staining of H2O2 in 20-day-old EV, GmPIB1-OE, and GmPIB1-RNAi soybean hairy roots under P. sojae zoospore treatment for 48 h. Bars, 1 cm. (C) Relative ROS levels in EV, GmPIB1-OE1, GmPIB1-OE2, GmPIB1-OE3, GmPIB1-RNAi1, GmPIB1-RNAi2, and GmPIB1-RNAi3 soybean hairy roots at 0, 3, 6, 12, 24, and 48 h after P. sojae infection. Relative ROS levels were measured, i.e. the ratio of total ROS levels in soybean hairy roots treated with P. sojae zoospores versus that in hairy roots treated with equal amounts of sterile water (mock) at the same time point. Three biological replicates, each with three technical replicates, were averaged and statistically analysed using Student’s t-test (*P<0.05, **P<0.01). Bars indicate standard error of the mean. (This figure is available in color at JXB online.)
Fig. 6.
Fig. 6.
Analysis of ROS-induced gene expression in GmPIB1 transgenic and EV soybean hairy roots. (A) GmPIB1-modulated gene expression in GmPIB1-OE and GmPIB1-RNAi hairy roots compared with EV, as revealed by qRT-PCR. Soybean GmEF1β was used as an internal control to normalize all data. (B, C) ChIP analysis of GmPIB1 binding to the GmSPOD1 promoter in GmPIB1-Myc transgenic soybean hairy roots and EV. Chromatin from GmPIB1-Myc transgenic and EV hairy roots was immunoprecipitated with anti-Myc antibody and treated without antibodies. The precipitated chromatin fragments were analysed by qPCR using four primer sets amplifying four regions upstream of GmSPOD1 (GmSPOD1a, GmSPOD1b, GmSPOD1c, GmSPOD1d), as indicated. One-tenth of the input (without antibody precipitation) of chromatin was analysed and used as a control. Three biological replicates, each with three technical replicates, were averaged and statistically analysed using Student’s t-test (*P<0.05, **P<0.01). Bars indicate standard error of the mean. (D) GmPIB1 represses GmSPOD1 promoter activity in N. benthamiana leaves. Agrobacterium tumefaciens GV3101 strains harboring pGmSPOD1:LUC and p35S: GmPIB1 were transfected into N. benthamiana leaves. Luciferase imaging was performed 72 h after injection. (E) GmPIB1 represses GmSPOD1 promoter activity in soybean hairy roots. Agrobacterium rhizogenes K599 strains harboring p35S: GmPIB1, and pGmSPOD1:GUS were transfected into soybean hairy roots. Line 1, pGmSPOD1:GUS; line 2, p35:Myc; line 3, p35S: GmPIB1-Myc; line 4, p35:Myc and pGmSPOD1:GUS; line 5, p35S:GmPIB1-Myc and pGmSPOD1:GUS. (F) GUS activity analysis of GmSPOD1 promoter expression. GUS activity was measured using a 4-methylumbelliferyl-D-glucuronide assay. The x-axis numbers correspond to the numbers 1–5 in (E). The data represent the means ±SD of three independent experiments. (This figure is available in color at JXB online.)
Fig. 7.
Fig. 7.
Knockdown of GmSPOD1 increases resistance to P. sojae. (A, B) qRT-PCR analysis of GmSPOD1 expression in EV, GmSPOD1-OE, and GmSPOD1-RNAi transgenic lines. (C, D) Percentage of dead hairy roots in EV, GmSPOD1-OE, and GmSPOD1-RNAi lines after P. sojae infection for 5 d. Each experiment contained at least 50 roots per line, and hairy roots were scored as dead when they were completely rotten. (E, F) Infection phenotypes of GmSPOD1-OE, GmSPOD1-RNAi, and EV soybean hairy roots after P. sojae inoculation for 2 d. (G, H) qRT-PCR analysis of relative P. sojae biomass based on the transcript level of P. sojae TEF1. (I) Relative ROS levels in EV versus GmSPOD1-RNAi lines at 0 and 24 h after P. sojae infection. Three biological replicates, each with three technical replicates, were averaged and statistically analysed using Student’s t-test (**P<0.01). Bars indicate standard error of the mean. (J) Model of the GmPIB1-mediated response to P. sojae. GmPIB1 expression is induced by P. sojae. GmPIB1 inhibits GmSPOD1 transcription by binding to the E-box element in its promoter. The suppression of GmSPOD1 expression leads to decreased intracellular ROS levels. (This figure is available in color at JXB online.)

References

    1. Berrocal-Lobo M, Molina A, Solano R. 2002. Constitutive expression of ETHYLENE-RESPONSE-FACTOR1 in Arabidopsis confers resistance to several necrotrophic fungi. The Plant Journal 29, 23–32. - PubMed
    1. Blair JE, Coffey MD, Park SY, Geiser DM, Kang S. 2008. A multi-locus phylogeny for Phytophthora utilizing markers derived from complete genome sequences. Fungal Genetics and Biology 45, 266–277. - PubMed
    1. Chen S, Songkumarn P, Liu J, Wang GL. 2009. A versatile zero background T-vector system for gene cloning and functional genomics. Plant Physiology 150, 1111–1121. - PMC - PubMed
    1. Cheng Q, Li N, Dong L, Zhang D, Fan S, Jiang L, Wang X, Xu P, Zhang S. 2015. Overexpression of soybean isoflavone reductase (GmIFR) enhances resistance to Phytophthora sojae in soybean. Frontiers in Plant Science 6, 1024. - PMC - PubMed
    1. Chinnusamy V, Ohta M, Kanrar S, Lee BH, Hong X, Agarwal M, Zhu JK. 2003. ICE1: a regulator of cold-induced transcriptome and freezing tolerance in Arabidopsis. Genes & Development 17, 1043–1054. - PMC - PubMed

Publication types

MeSH terms

Substances