. 2018 Oct 1;110(10):1102-1114.
doi: 10.1093/jnci/djy032.

Involvement of Heparanase in the Pathogenesis of Mesothelioma: Basic Aspects and Clinical Applications

Affiliations

Involvement of Heparanase in the Pathogenesis of Mesothelioma: Basic Aspects and Clinical Applications

Uri Barash et al. J Natl Cancer Inst. .

Abstract

Background: Mammalian cells express a single functional heparanase, an endoglycosidase that cleaves heparan sulfate and thereby promotes tumor metastasis, angiogenesis, and inflammation. Malignant mesothelioma is highly aggressive and has a poor prognosis because of the lack of markers for early diagnosis and resistance to conventional therapies. The purpose of this study was to elucidate the mode of action and biological significance of heparanase in mesothelioma and test the efficacy of heparanase inhibitors in the treatment of this malignancy.

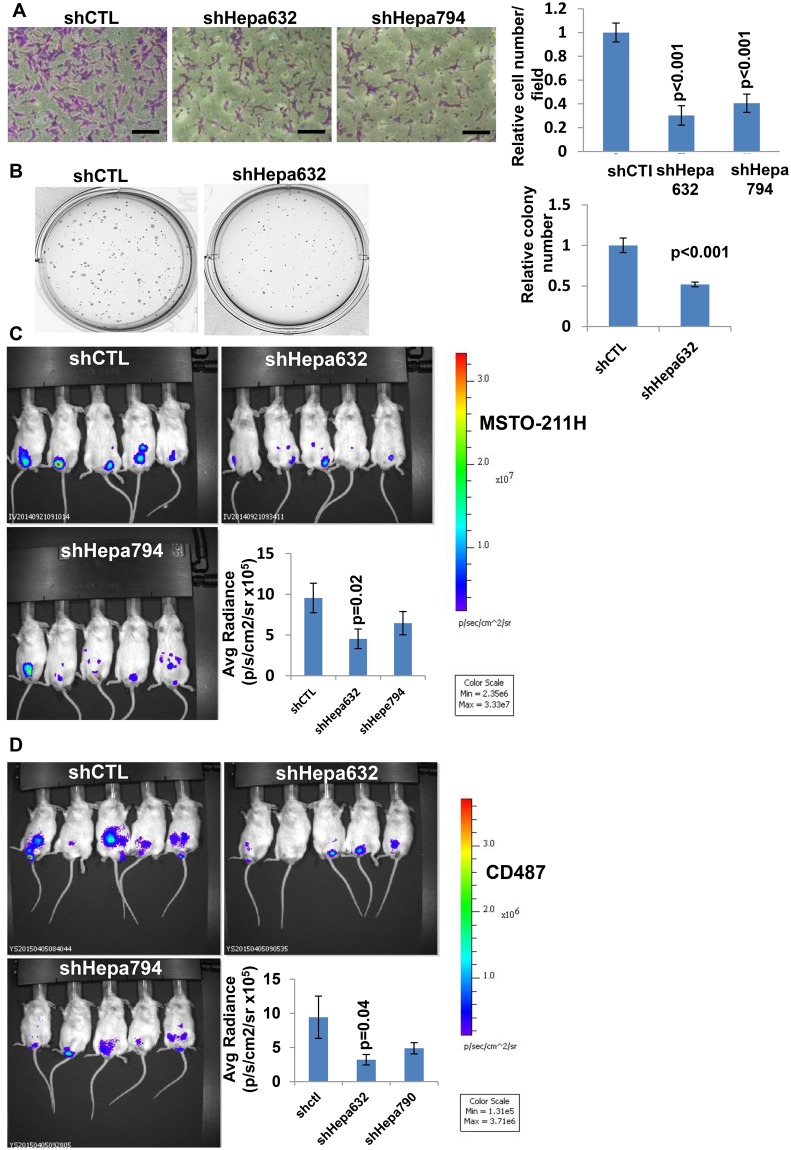
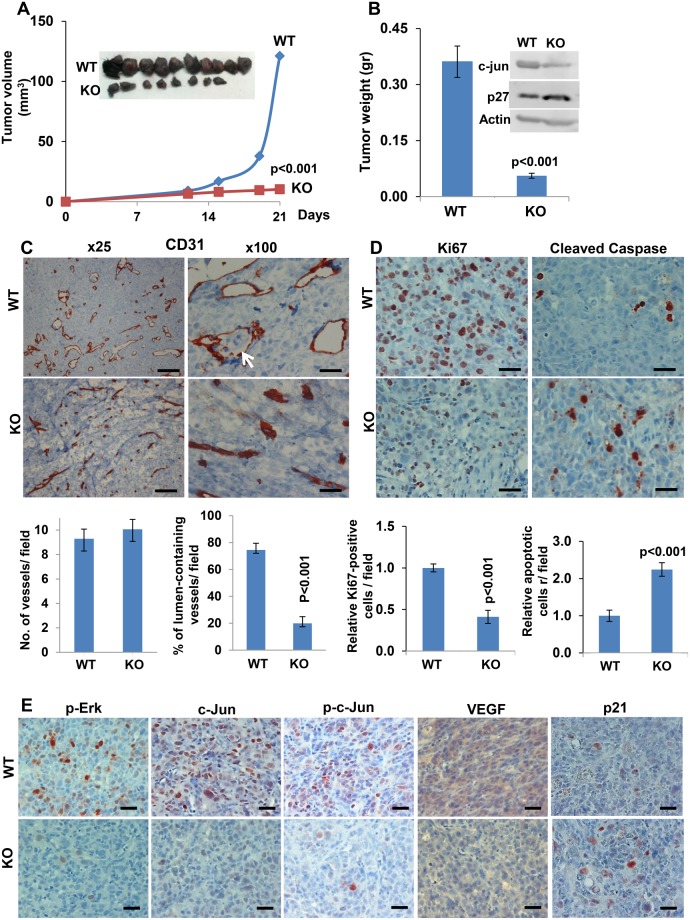
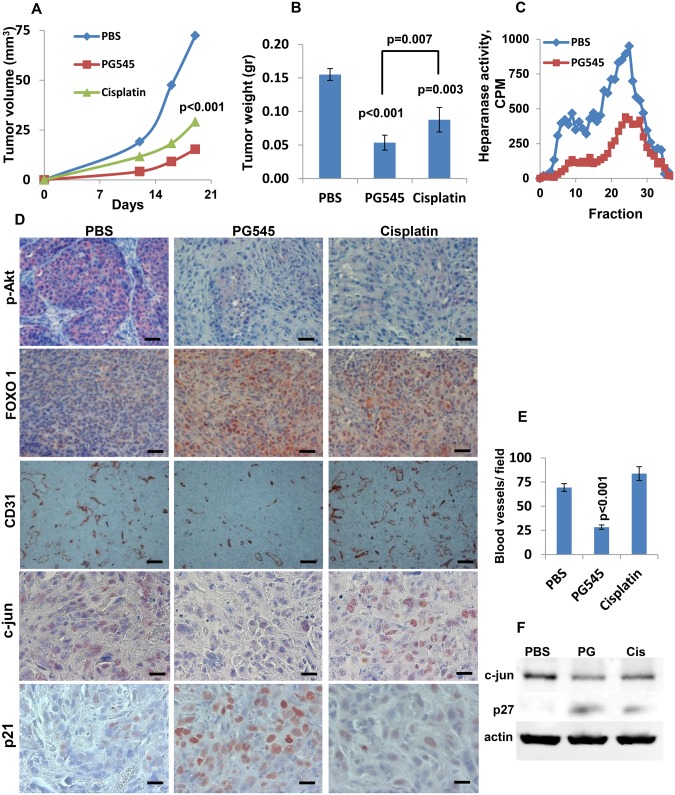
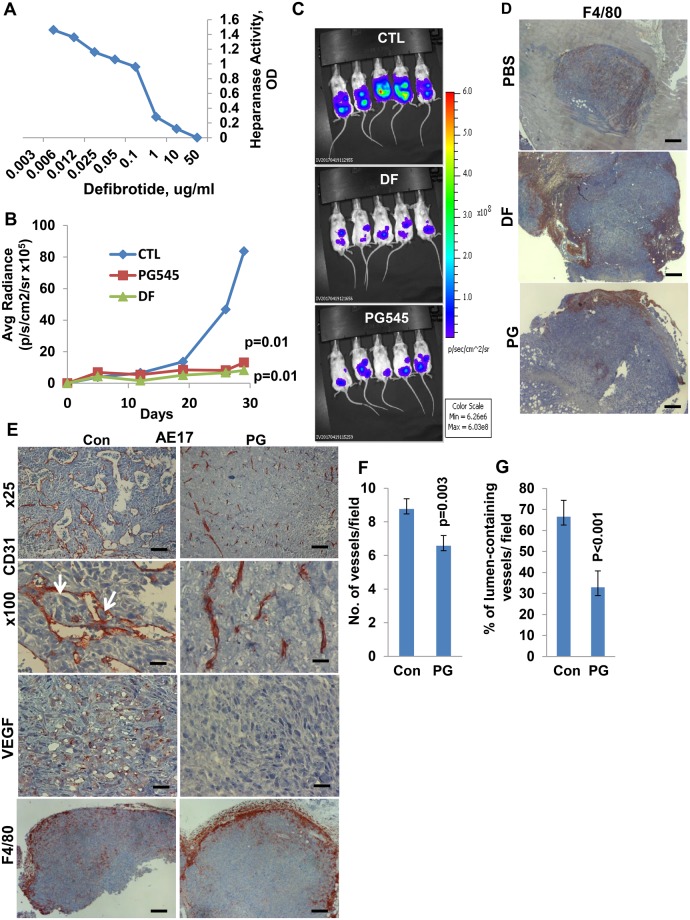
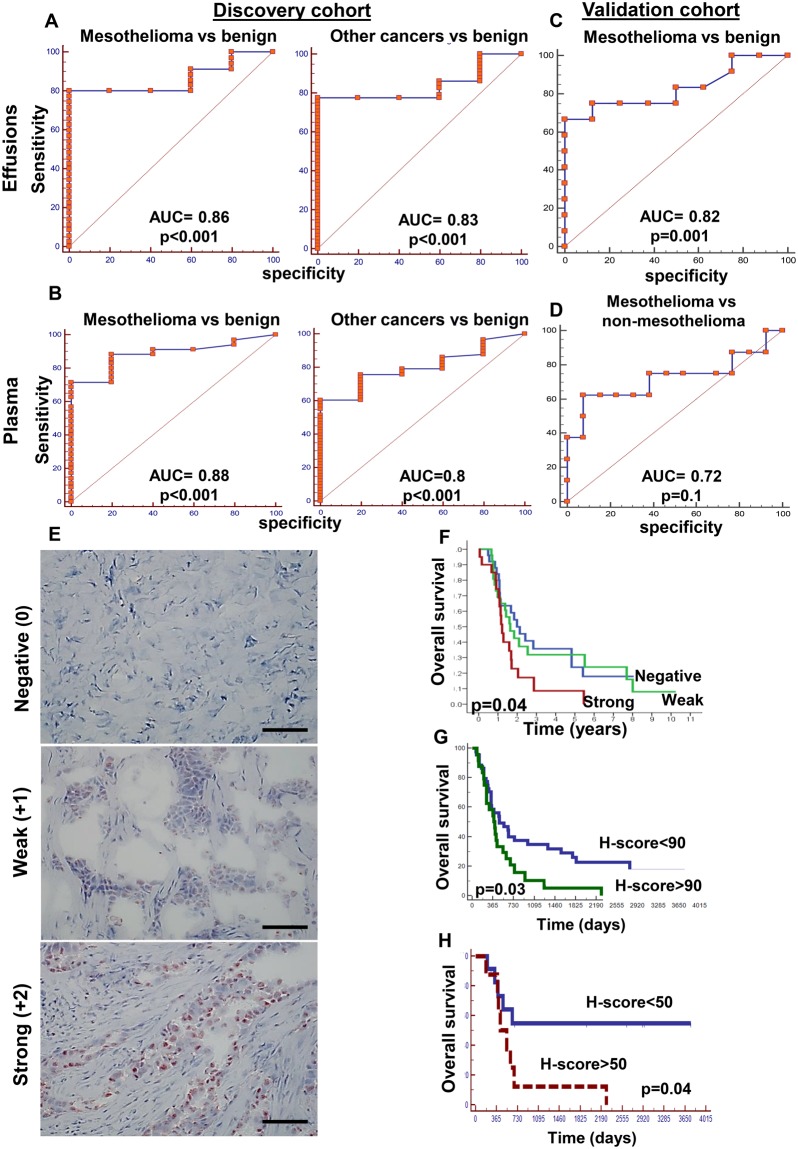
Methods: The involvement of heparanase in mesothelioma was investigated by applying mouse models of mesothelioma and testing the effect of heparanase gene silencing (n = 18 mice per experiment; two different models) and heparanase inhibitors (ie, PG545, defibrotide; n = 18 per experiment; six different models). Synchronous pleural effusion and plasma samples from patients with mesothelioma (n = 35), other malignancies (12 non-small cell lung cancer, two small cell lung carcinoma, four breast cancer, three gastrointestinal cancers, two lymphomas), and benign effusions (five patients) were collected and analyzed for heparanase content (enzyme-linked immunosorbent assay). Eighty-one mesothelioma biopsies were analyzed by H-Score for the prognostic impact of heparanase using immunohistochemistry. All statistical tests were two-sided.

Results: Mesothelioma tumor growth, measured by bioluminescence or tumor weight at termination, was markedly attenuated by heparanase gene silencing (P = .02) and by heparanase inhibitors (PG545 and defibrotide; P < .001 and P = .01, respectively). A marked increase in survival of the mesothelioma-bearing mice (P < .001) was recorded. Heparanase inhibitors were more potent in vivo than conventional chemotherapy. Clinically, heparanase levels in patients' pleural effusions could distinguish between malignant and benign effusions, and a heparanase H-score above 90 was associated with reduced patient survival (hazard ratio = 1.89, 95% confidence interval = 1.09 to 3.27, P = .03).

Conclusions: Our results imply that heparanase is clinically relevant in mesothelioma development. Given these preclinical and clinical data, heparanase appears to be an important mediator of mesothelioma, and heparanase inhibitors are worthy of investigation as a new therapeutic modality in mesothelioma clinical trials.


Figures

Figure 1.
Figure 1.
Gene silencing approach. A) Heparanase gene silencing. shRNA-control (shCTL) and heparanase-silenced (shHepa632/794) MSTO-211H human mesothelioma cells (1 × 105) were plated onto Matrigel-coated 8 μm transwell filters. Invading cells adhering to the lower side of the membrane were visualized (left panels) and counted in 10 random fields (right panel) after 16 hours (mean ±SD; P < .001; two-sided analysis of variance and the Student t test were used for statistical analysis). Scale bars represent 50 µm. B) shCTL and shHepa632 MSTO-211H cells were seeded (2 × 103/35mm dish) in soft agar and grown for two weeks. Shown are representative plates; colony number of shHepa vs control shRNA was quantified in six random fields and is shown graphically in the right panel (mean ±SD; P < .001; two-sided analysis of variance and the Student t test were used for statistical analysis). C) Luciferase-labeled shHepa632/794 and shCTL MSTO-211H cells (2 × 106) were inoculated i.p. into NOD/SCID mice (n = 6/group), and tumor development was inspected by IVIS following administration of luciferin. Quantification of luciferase intensities is shown graphically in the lower right panel. (mean ±SD; P = .02; two-sided analysis of variance and the Student t test were used for statistical analysis). Tumor burden following i.p. administration of control and heparanase gene-silenced CD487 cells in NOD/SCID mice (n = 6) is shown in (D) (mean ±SD; P = .04; two-sided analysis of variance and the Student t test, were used for statistical analysis). Representative images of mice are shown in C and D.
Figure 2.
Figure 2.
A role for host heparanase in mesothelioma tumor growth. AE17 mouse mesothelioma cells were injected subcutaneously (2 × 106) into heparanase knockout (Hepa-KO; n = 8) vs wild-type (wt) C57BL/6J mice (n = 10). Tumor volume was calculated from external caliper measurements (A). At the end of the experiment on day 21, tumors were resected, photographed (inset), and weighed (B) (mean ±SD; P < .001; two-sided analysis of variance and the Mann-Whitney U test were used for statistical analysis); tumor extracts were prepared and subjected to immunoblotting applying anti-c-Jun, anti-p27, and anti-actin antibodies (B) (inset). Five-micron sections of corresponding tumors were subjected to immunostaining, applying anti-CD31 antibody (C) shown in low (left) and high (right) magnifications. Scale bars represent 200 µm (left) and 50 µm (right). Quantification of blood vessel density (vessels per field in 12 random fields) and the percentage of vessels exhibiting a patent lumen (in 15 random fields) are shown graphically in the lower panels (mean ±SD; P < .001; two-sided analysis of variance and the Mann-Whitney U test were used for statistical analysis). Arrow indicates tumor cells within a blood vessel. Tumor sections were similarly stained with anti-Ki67 (D) (Ki67, left panels) and anti-cleaved caspase 3 (D) (cleaved caspase 3, right panels) antibodies. Quantification of cell proliferation and apoptosis (counted in 10 random fields) are shown graphically in the lower panels (mean ±SD; P < .001; two-sided analysis of variance and the Student t test were used for statistical analysis). Scale bars represent 50 µm. E) Tumor sections were similarly stained with anti phospho-ERK (p-ERK, left panels), anti-c-Jun (second left), anti phospho-c-Jun (p-c-Jun, middle panels), anti-VEGF (VEGF, second right), and anti-p21 (right panels) antibodies. Scale bars represent 50 µm. KO = knockout; WT = wild-type.
Figure 3.
Figure 3.
Utilization of a heparanase inhibitor, PG545. A) Tumor growth. MSTO-211H human mesothelioma cells were inoculated subcutaneously (2 × 106) in NOD/SCID mice (n = 7). Mice were treated with PG545 (400 μg/mouse; once a week), cisplatin (3 mg/kg, once every two weeks), or control vehicle (PBS). Tumor volume was calculated from external caliper measurements (A). At the end of the experiment on day 19, tumors were resected and weighed (B) (mean ±SD; P ≤ .007; two-sided analysis of variance and the Mann-Whitney U test were used for statistical analysis), and heparanase enzymatic activity was evaluated in tumor extracts as described in the Methods section (C). D) Immunostaining. Subcutaneous tumors were subjected to immunostaining, applying anti-phospho-Akt (p-Akt, upper panels), anti-FOXO1 (FOXO1, second panels), anti-CD31 (CD31, third panels), anti-c-Jun (fourth panels), and anti-p21 (lower panels) antibodies. Scale bars represent 100 µm (upper and second panels), 200 µm (third panels), and 50 µm (lower panels). Quantification of blood vessel density in 14 random fields is shown graphically in (E) (mean ±SD; P < .001; two-sided analysis of variance and the Student t test were used for statistical analysis). F) Immunoblotting. Extracts of control (PBS), PG545, and cisplatin-treated tumors were subjected to immunoblotting, applying anti-c-Jun (upper panel), anti-p27 (middle panel), and anti-actin (lower panel) antibodies.
Figure 4.
Figure 4.
Effect of PG545 on orthotopic mesothelioma model. A) Tumor growth. Luciferase-labeled MSTO-211H human mesothelioma cells (2 × 106) were inoculated i.p. into NOD/SCID mice (n = 6/treatment). Mice were treated with PG545 (400 μg/mouse; once a week), cisplatin (once every two weeks; 3 mg/kg), or control vehicle (PBS), and tumor development was inspected by IVIS. Quantification of the luciferase intensities is shown graphically in the lower right panel (mean ±SD; P = .006 for PG545 vs PBS; P = .008 for cisplatin vs PBS, and P = .03 for PG545 vs cisplatin; two-sided analysis of variance and the Mann-Whitney U test were used for statistical analysis). B) Survival. The effect of PG545 and cisplatin on the survival of mice (n = 7) is plotted as Kaplan-Meier curves (P < .001, .003, and .001 for PG545 vs PBS, cisplatin vs PBS, and PG545 vs cisplatin, respectively). The number at risk for the PBS, PG545 and Cisplatin treated mice were: 6, 7 & 6 at baseline; 6, 7 & 5 up to day 41; 0, 7 & 2 from day 42 to 53; and 0, 3 & 0 beyond day 54, respectively. C) Luciferase-labeled CD487 human mesothelioma cells (2 × 106) were inoculated i.p. into 18 NOD/SCID mice. Groups of six mice were treated with PG545 (400 µg/mouse; once a week), cisplatin (3 mg/kg; once every two weeks), or control vehicle (PBS), and tumor development was inspected by IVIS (representative images are shown). Quantification of the luciferase intensities is shown graphically in the right panel (mean ±SD; P ≤ .03; two-sided analysis of variance and the Mann-Whitney U test were used for statistical analysis).
Figure 5.
Figure 5.
Utilization of a heparanase inhibitor, defibrotide. A) Effect of defibrotide in an orthotopic mesothelioma model. Active heparanase (200 ng) was incubated with the indicated concentration of defibrotide, and heparanase activity (OD, colorimetric assay) was examined after 18 hours, as described in the Methods section. B and C) Luciferase-labeled MSTO-211H human mesothelioma cells (2 × 106) were inoculated i.p. into 18 NOD/SCID mice. Groups of six mice were treated with defibrotide (8 mg/mouse; twice a day), PG545 (400 μg/mouse; once a week), or control vehicle (PBS), and tumor development was inspected by IVIS over time (B) (P = .01; two-sided analysis of variance and the Mann-Whitney U test were used for statistical analysis). Representative tumor images at termination are shown in (C). D) Tumors were then collected, and 5-micron sections of formalin-fixed, paraffin-embedded tumor samples were subjected to immunostaining, applying anti-F4/80 antibody (a common marker for mouse macrophages). Scale bars represent 500 µm. E) Mouse AE17 cells. AE17 mouse mesothelioma cells were inoculated (2 × 106) subcutaneously, and mice (n = 6) were treated with PG545 (20 mg/kg, once a week) or PBS (Con) once tumors became palpable. At termination, when tumor growth became evident, tumors were resected, and 5-micron sections were subjected to immunostaining, applying anti-CD31 (upper two panels), anti-VEGF (third panels), and anti-F4/80 (lower panels) antibodies. Scale bars represent 200 µm (upper panels), 50 µm (second and third panels), and 500 µm (lower panels). Quantification of blood vessels per field and the percentage of vessels that show a patent lumen counted in at least 12 high power fields are shown graphically in (F) (mean ±SD) and (G) (mean ±SD), respectively (P ≤ .003; two-sided analysis of variance and the Student t test were used for statistical analysis).
Figure 6.
Figure 6.
Heparanase levels in pleural effusions and plasma. A and B) Discovery cohort (n = 63). Shown are receiver operator characteristic (ROC) curves with calculated areas under the curve (AUC) for heparanase protein levels in pleural effusions (A) and plasma samples (B) from mesothelioma (left panels) and other cancers (right panels) vs patients with benign pleural effusions. AUCs are 0.88 and 0.80 (P < .001) for the plasma samples, and 0.86 and 0.83 (P < .001) for the pleural effusions, respectively. C and D) Validation cohort (n = 50). Shown are ROC curves for heparanase protein levels in pleural effusions from mesothelioma patients vs benign (C) (AUC = 0.82, P = .001) and vs nonmesothelioma cancer (D) (AUC = 0.72, P = .1 of the validation patient cohort). E) Immunostaining. Mesothelioma sections were subjected to immunostaining, applying antiheparanase antibody. Shown are representative images of cases exhibiting no (negative, upper panel) weak (+1, middle), or strong (+2, lower panel) staining intensity. Scale bars represent 100 µm. F) Kaplan-Meier survival analysis of patients according to their heparanase staining intensities. Mesothelioma patients endowed with strong heparanase staining survive less than patients who are found negative for heparanase (P = .04 for strong vs negative). G and H) Patient survival according to heparanase H-score. Heparanase H-score (ie, combining the staining intensity and staining extent) was calculated for 68 mesothelioma patients, and their survival rate (P = .03, Kaplan-Meier) was compared among patients having H-score lower vs higher than 90 (G). A similar analysis was performed for a subgroup of 22 epithelioid patients who did not receive chemotherapy prior to biopsy collection (H) (P = .04). All P values for the ROC areas under the curve were two-sided; Kaplan-Meier curves were used for survival analyses with two-sided P values). AUC = area under the curve.

References

    1. Bernfield M, Gotte M, Park PW, et al. Functions of cell surface heparan sulfate proteoglycans. Annu Rev Biochem. 1999;68:729–777. - PubMed
    1. Timpl R, Brown JC.. Supramolecular assembly of basement membranes. Bioessays. 1996;182:123–132. - PubMed
    1. Udo Hacker KNaNP. Heparan sulphate proteoglycans: The sweet side of development. Nat Rev Mol Cell Biol. 2005;6:530–541. - PubMed
    1. Vlodavsky I, Friedmann Y, Elkin M, et al. Mammalian heparanase: Gene cloning, expression and function in tumor progression and metastasis. Nat Med. 1999;57:793–802. - PubMed
    1. Barash U, Cohen-Kaplan V, Dowek I, et al. Proteoglycans in health and disease: New concepts for heparanase function in tumor progression and metastasis. Febs J. 2010;27719:3890–3903. - PMC - PubMed

Publication types

MeSH terms