. 2018 Aug 15;198(4):486-496.
doi: 10.1164/rccm.201709-1823OC.

Dicer1 Deficiency in the Idiopathic Pulmonary Fibrosis Fibroblastic Focus Promotes Fibrosis by Suppressing MicroRNA Biogenesis

Affiliations

Dicer1 Deficiency in the Idiopathic Pulmonary Fibrosis Fibroblastic Focus Promotes Fibrosis by Suppressing MicroRNA Biogenesis

Jeremy Herrera et al. Am J Respir Crit Care Med. .

Abstract

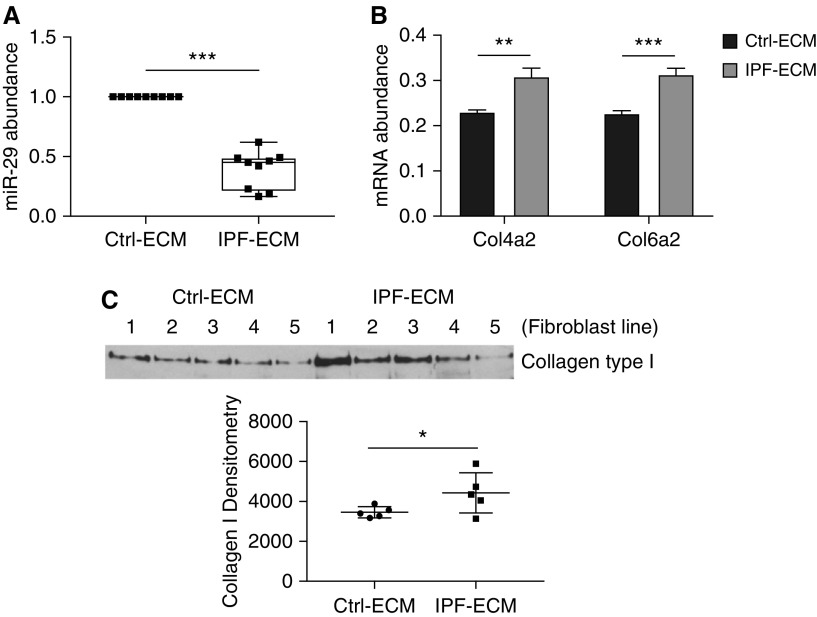
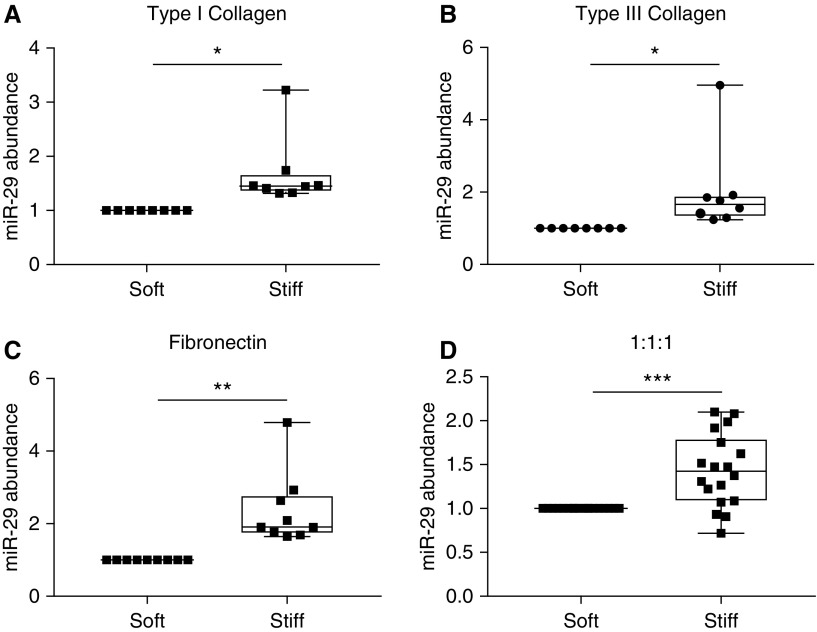
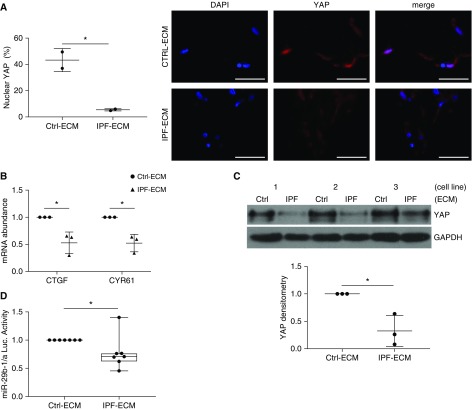
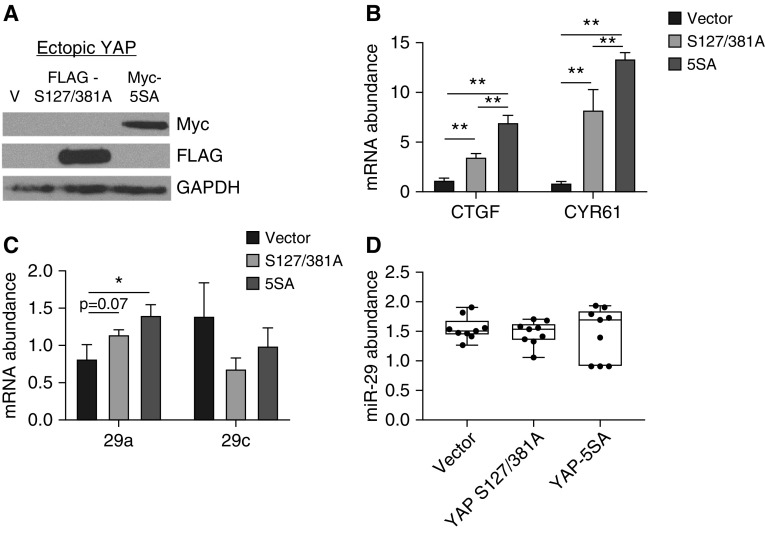
Rationale: The lung extracellular matrix (ECM) in idiopathic pulmonary fibrosis (IPF) mediates progression of fibrosis by decreasing fibroblast expression of miR-29 (microRNA-29), a master negative regulator of ECM production. The molecular mechanism is undefined. IPF-ECM is stiffer than normal. Stiffness drives fibroblast ECM production in a YAP (yes-associated protein)-dependent manner, and YAP is a known regulator of miR-29. Therefore, we tested the hypothesis that negative regulation of miR-29 by IPF-ECM was mediated by mechanotransduction of stiffness.

Objectives: To determine how IPF-ECM negatively regulates miR-29.

Methods: We decellularized lung ECM using detergents and prepared polyacrylamide hydrogels of defined stiffness by varying acrylamide concentrations. Mechanistic studies were guided by immunohistochemistry of IPF lung and used cell culture, RNA-binding protein assays, and xenograft models.

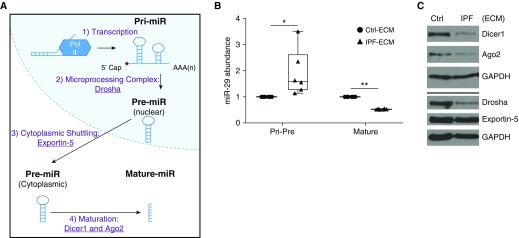
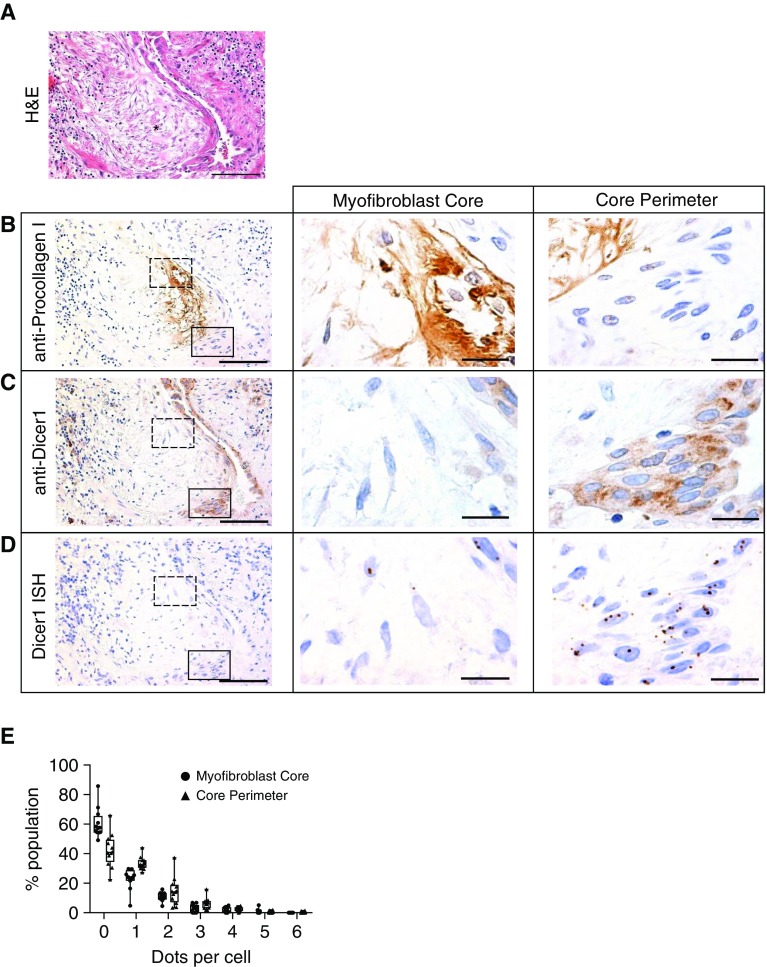
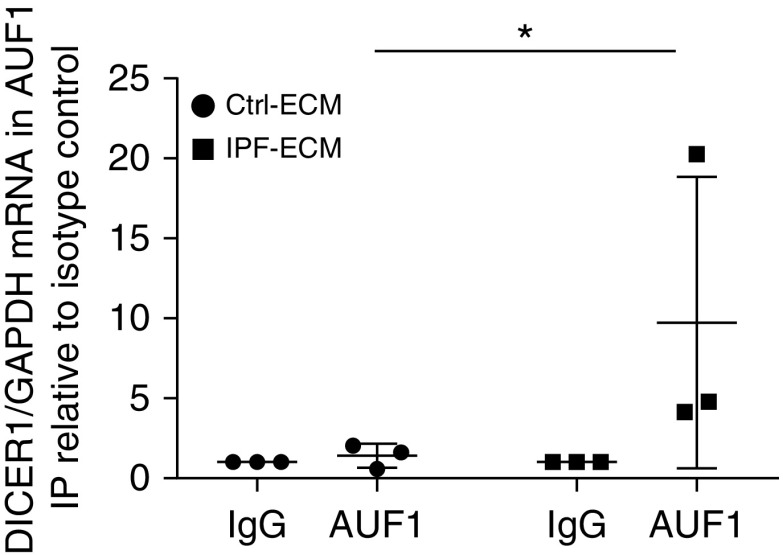
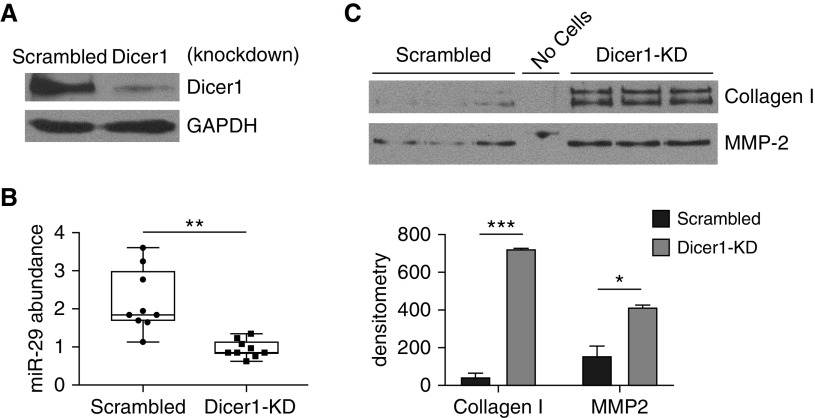
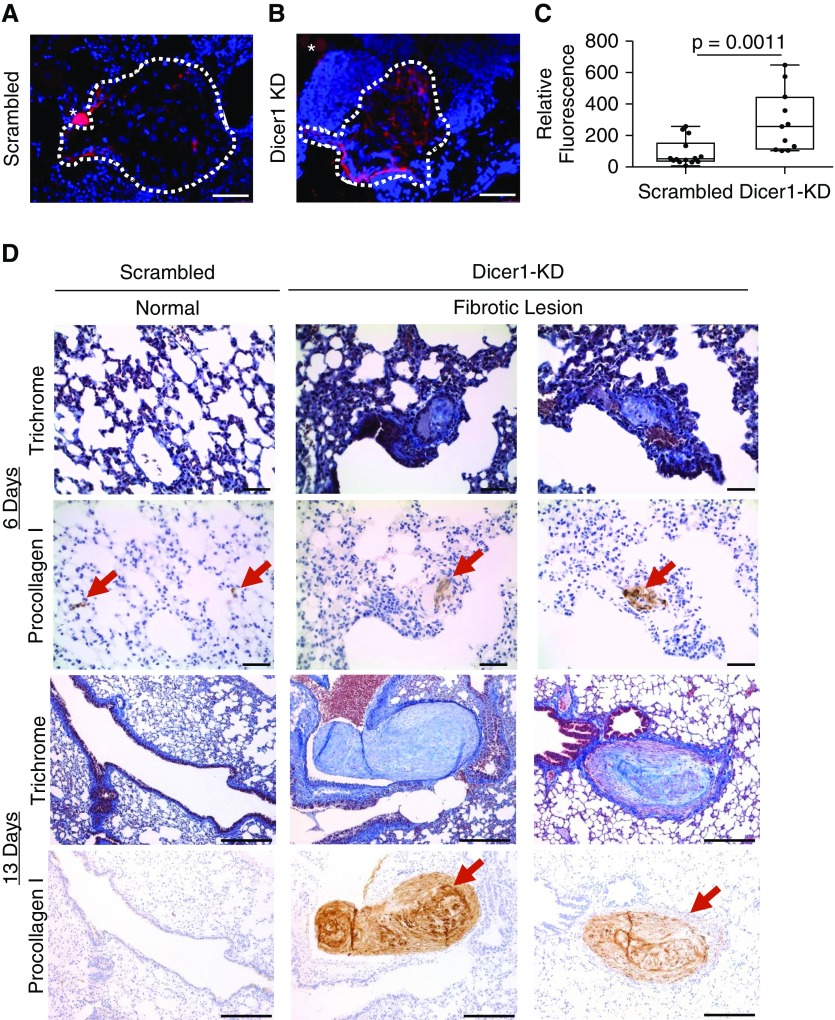
Measurements and main results: Contrary to our hypothesis, we excluded fibroblast mechanotransduction of ECM stiffness as the primary mechanism deregulating miR-29. Instead, systematic examination of miR-29 biogenesis revealed a microRNA processing defect that impeded processing of miR-29 into its mature bioactive forms. Immunohistochemical analysis of the microRNA processing machinery in IPF lung specimens revealed decreased Dicer1 expression in the procollagen-rich myofibroblastic core of fibroblastic foci compared with the focus perimeter and adjacent alveolar walls. Mechanistically, IPF-ECM increased association of the Dicer1 transcript with RNA binding protein AUF1 (AU-binding factor 1), and Dicer1 knockdown conferred primary human lung fibroblasts with cell-autonomous fibrogenicity in zebrafish and mouse lung xenograft models.

Conclusions: Our data identify suppression of fibroblast Dicer1 expression in the myofibroblast-rich IPF fibroblastic focus core as a central step in the mechanism by which the ECM sustains fibrosis progression in IPF.

Keywords: extracellular matrix; idiopathic pulmonary fibrosis; yes-associated protein.


Figures

Figure 1.
Figure 1.
Idiopathic pulmonary fibrosis (IPF)–extracellular matrix (ECM) suppresses miR-29 (microRNA-29) expression and upregulates collagen production. Lung fibroblasts were cultured on control or IPF-ECM for 18 hours. (A) Mature miR-29a, -29b, and -29c values were quantified by quantitative PCR (qPCR) and normalized to RNU6 (n = 1 cell line). Shown is a box-and-whisker plot representing the mean of three technical replicates for the three species of miR-29 with the values for control (Ctrl)-ECM set to 1. (B) qPCR for Col4a2 and Col6a2 normalized to GAPDH (n = 2, representative experiment shown), and P value was calculated using the Student’s two-tailed t test. (C) Medium was removed and equal volumes of serum-free medium were added to each reaction. After 8 hours, the conditioned medium was collected and equal volumes analyzed by immunoblot for type I collagen (n = 5 cell lines, densitometry values shown in graph below). Error bars represent mean ± SD. P value was calculated using the Student’s two-tailed t test for A and B, and paired two-tailed t test for C. *P < 0.05, **P < 0.01, ***P < 0.005.
Figure 2.
Figure 2.
Stiffness increases miR-29 (microRNA-29) expression in two-dimensional hydrogels. Primary lung fibroblasts were cultured for 24 hours in survival medium on gels mimicking physiological stiffness (3 kPa; soft polyacrylamide gels) or gels mimicking idiopathic pulmonary fibrosis stiffness (20 kPa; stiff polyacrylamide gels). Gels were functionalized with either: (A) type I collagen (n = 3 cell lines); (B) type III collagen (n = 3 cell lines); (C) fibronectin (n = 3 cell lines); or (D) an equal ratio of type I collagen, type III collagen, and fibronectin (n = 6 cell lines). Shown is a box-and-whisker plot of the mean quantitative PCR values on stiff hydrogels compared with soft (set to 1) for miR-29a, -29b, and -29c (normalized to RNU6 expression). P values were calculated using the Student’s paired two-tailed t test. *P < 0.05, **P < 0.01, ***P < 0.001.
Figure 3.
Figure 3.
Idiopathic pulmonary fibrosis (IPF)–extracellular matrix (ECM) negatively regulates YAP (yes-associated protein) and suppresses miR-29 (microRNA-29) transcription. (AC) Fibroblasts were cultured for 24 hours on ECM and (A) (left panel) nuclear YAP (percentage positive cells) was quantified by immunofluorescence microscopy (n = 2 cell lines, mean values shown); (right panel) representative image shown with scale bars representing 50 μm. (B) Quantitative PCR for CTGF and CYR61 (normalized to GAPDH; n = 3 cell lines, mean values shown normalized to control [Ctrl]-ECM [set to 1]). (C) YAP expression was quantified by immunoblot (normalized to GAPDH; using three cell lines designated 1, 2, and 3; mean values shown normalized to Ctrl-ECM [set to 1]). Mean densitometry values are shown in lower panel. (D) Fibroblasts transfected with an miR-29b-1/a firefly luciferase reporter were cultured for 24 hours on ECM, and luciferase activity was quantified (normalized to Renilla luciferase; n = 7 cell lines shown as a box-and-whisker plot, mean value shown normalized to Ctrl-ECM [set to 1]). Error bars represent mean ± SD. P values were calculated using the Student’s paired two-tailed t test. *P < 0.05.
Figure 4.
Figure 4.
Enforced YAP (yes-associated protein) expression does not restore mature miR-29 (microRNA-29) expression on idiopathic pulmonary fibrosis (IPF)–extracellular matrix (ECM). (AD) Fibroblasts were transduced with empty vector, YAP S127/381A–FLAG-tagged, or YAP 5SA–MYC-tagged and cultured on IPF-ECM for 18 hours. (A) Ectopic YAP expression was analyzed by immunoblot for anti-FLAG and anti-MYC. (B) YAP target genes CTGF and CYR61 were quantified by quantitative PCR (qPCR) normalized to GAPDH. (C) Primary–precursor miR-29a and -29c were quantified by qPCR normalized to GAPDH; (D) mature miR-29a, -29b, and -29c were quantified by qPCR normalized to RNU6 (n = 2, representative experiment shown). Error bars represent means ± SD for B and C, and a box-and-whisker plot is shown for D. P value was calculated using a one-way ANOVA test followed by a Tukey test. *P < 0.001, **P < 0.0001.
Figure 5.
Figure 5.
Idiopathic pulmonary fibrosis (IPF)–extracellular matrix (ECM) suppresses the microRNA processing machinery. (A) MicroRNA biogenesis schematic: 1) microRNAs are transcribed into primary microRNA (Pri-miR), 2) processed into precursor microRNA (Pre-miR) by the microprocessor complex (including Drosha), 3) actively shuttled from the nucleus to the cytoplasm by Exportin-5, and 4) processed into mature microRNAs by Ago2 and Dicer1. (B) Fibroblasts were cultured on ECM for 18 hours and quantitative PCR was used to analyze the grouped values of Pri-Pre and mature microRNA-29a (miR-29a) and miR-29c normalized to GAPDH or RNU6, respectively (n = 3 cell lines, mean value shown normalized to control [Ctrl]-ECM [set to 1]). Data are shown as a box-and-whisker plot, and P value was calculated using the Student’s paired t test. *P < 0.05, **P < 0.0001. (C) Fibroblasts were cultured on ECM for 24 hours. Shown are immunoblots for Dicer1, Ago2, Drosha, Exportin-5, and GAPDH (n = 1 cell line).
Figure 6.
Figure 6.
Regions of the lung actively synthesizing collagen are deficient in Dicer1. An idiopathic pulmonary fibrosis (IPF) specimen was serially sectioned at 4 μm and processed for histology and immunohistochemistry. (A) Hematoxylin and eosin (H&E) image with an asterisk labeling a fibroblastic focus. (BD, left panels) Immunostain for anti-procollagen I (B), anti-Dicer1 (C), and in situ hybridization by RNAscope for Dicer1 mRNA (D). (B–D, middle and right panels) The myofibroblast core (dashed outlined box in left panels) and focus perimeter (solid outlined box in left panels) were reimaged at higher-power magnification. Scale bars represent 100 μm (left panels) or 20 μm (middle and right panels). (E) Quantification of RNAscope data. We enumerated dots within cells in the myofibroblast core or core perimeter shown as a frequency distribution (percentage population). Poisson regression, P < 0.0001 (n = 6 patients with IPF [12 fibroblastic foci total, 1–3 fibroblastic foci analyzed per patient]).
Figure 7.
Figure 7.
Idiopathic pulmonary fibrosis (IPF)–extracellular matrix (ECM) increases the association of RNA binding protein AUF1 with Dicer1 mRNA. RNA-immunoprecipitation (RNA-IP) was performed (n = 3 cell lines) against the RNA binding protein AUF1 (or isotype control, IgG) on lysates from cells cultured on control (Ctrl)- or IPF-ECM, and the amount of coprecipitated Dicer1 mRNA was quantified by quantitative PCR. Dicer1 mRNA was normalized to immunoprecipitated GAPDH mRNA levels (a highly abundant transcript to control for nonspecific associations). Dicer1/GAPDH expression levels are displayed relative to the isotype control (IgG) precipitation from the corresponding ECM type. Error bars represent SD, and P value was calculated using a one-sided Mann-Whitney U test. *P = 0.05.
Figure 8.
Figure 8.
Dicer1 knockdown in fibroblasts decreases mature miR-29 (microRNA-29) abundance on control extracellular matrix. Fibroblasts were transduced with Dicer1 shRNA or scrambled control to establish stable expression. (A) Shown is an immunoblot for Dicer1. (B and C) Equal numbers of transduced cells were cultured on control extracellular matrix for 18 hours. Medium was removed and equal volume of serum-free medium was added to each reaction for 8 additional hours. (B) Quantitative PCR for mature miR-29a, -29b, and -29c normalized to miR-451. Data are shown as a box-and-whisker plot, and P value was calculated using the Student’s two-tailed t test. (C) Equal volumes of conditioned medium were analyzed by immunoblot for collagen I and MMP-2 (n = 2, representative experiment shown in triplicate). Densitometry values are shown in the lower panel, with error bars representing the SD, and P value was calculated using the Student’s two-tailed t test. *P < 0.01, **P < 0.001, ***P < 0.0001. KD = knockdown.
Figure 9.
Figure 9.
Dicer1 knockdown imparts fibroblasts with fibrogenicity in vivo. (AC) Zebrafish xenograft assay: 102 scrambled control or Dicer1-knockdown (KD) fibroblasts (cells from the same population of lung fibroblasts used in Figure 8) were xenografted into each zebrafish embryo, which was incubated for 46 hours, anesthetized, and fixed before analysis. Representative xenograft images of (A) scrambled control or (B) Dicer1-KD fibroblasts immunostained for human procollagen I (red) counterstained with DAPI (graft DAPI-positive area outlined by dotted white line, scale bar represents 50 μm, asterisk indicates sectioning artifact: a yolk granule with autofluorescence). (C) A Fire LUT was applied using ImageJ to the unaltered images to quantify relative procollagen fluorescence, corrected to a background uninvolved area from the same image. Shown is a box-and-whisker plot of relative procollagen fluorescence with P values calculated using the Wilcoxon sum-rank test (n = 13 scrambled control and n = 11 Dicer1-KD zebrafish xenografts, P = 0.0011). (D) Mouse xenograft assay: 106 scrambled control or Dicer1-KD fibroblasts (cells from the same population of lung fibroblasts used in Figure 8) were injected by tail vein into mice and lungs were harvested after 6 and 13 days (n = 4 scrambled control and n = 4 Dicer1-KD per time point for a total of 16 mice). P value was calculated using Fisher exact test (P = 0.04). Trichrome and procollagen I immunostain (red arrows mark human fibroblasts) identify fibrotic lesions (scale bar represents 50 μm for 6-day time point, or 200 μm for 13-day time point).

Comment in

References

    1. Booth AJ, Hadley R, Cornett AM, Dreffs AA, Matthes SA, Tsui JL, et al. Acellular normal and fibrotic human lung matrices as a culture system for in vitro investigation. Am J Respir Crit Care Med. 2012;186:866–876. - PMC - PubMed
    1. Herrera J, Henke CA, Bitterman PB. Extracellular matrix as a driver of progressive fibrosis. J Clin Invest. 2018;128:45–53. - PMC - PubMed
    1. Parker MW, Rossi D, Peterson M, Smith K, Sikström K, White ES, et al. Fibrotic extracellular matrix activates a profibrotic positive feedback loop. J Clin Invest. 2014;124:1622–1635. - PMC - PubMed
    1. Pandit KV, Corcoran D, Yousef H, Yarlagadda M, Tzouvelekis A, Gibson KF, et al. Inhibition and role of let-7d in idiopathic pulmonary fibrosis. Am J Respir Crit Care Med. 2010;182:220–229. - PMC - PubMed
    1. Roderburg C, Urban GW, Bettermann K, Vucur M, Zimmermann H, Schmidt S, et al. Micro-RNA profiling reveals a role for miR-29 in human and murine liver fibrosis. Hepatology. 2011;53:209–218. - PubMed

Publication types

LinkOut - more resources