

Nomograms predict long-term survival for patients with periampullary adenocarcinoma after pancreatoduodenectomy
- PMID: 29580215
- PMCID: PMC5870913
- DOI: 10.1186/s12885-018-4240-x
Nomograms predict long-term survival for patients with periampullary adenocarcinoma after pancreatoduodenectomy
Abstract
Background: The prognosis of patients with periampullary adenocarcinoma after pancreatoduodenectomy is diverse and not yet clearly illustrated. The aim of this study was to develop a nomogram to predict individual risk of overall survival (OS) and progression-free survival (PFS) in patients with periampullary adenocarcinoma after pancreatoduodenectomy.
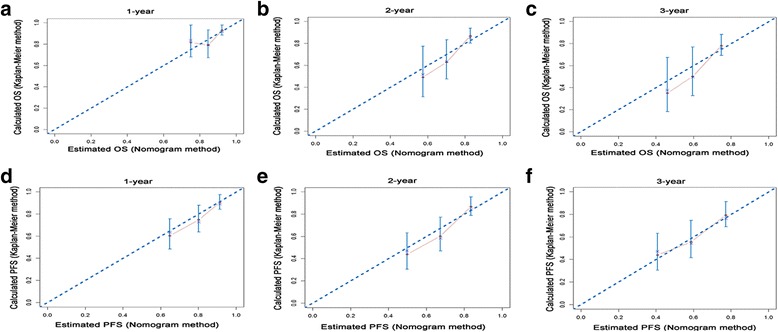
Methods: A total of 205 patients with periampullary adenocarcinoma after pancreatoduodenectomy were retrospectively included. OS and PFS were evaluated by the Kaplan-Meier method. Two nomograms for predicting OS and PFS were established, and the predictive accuracy was measured by the concordance index (Cindex) and calibration plots.
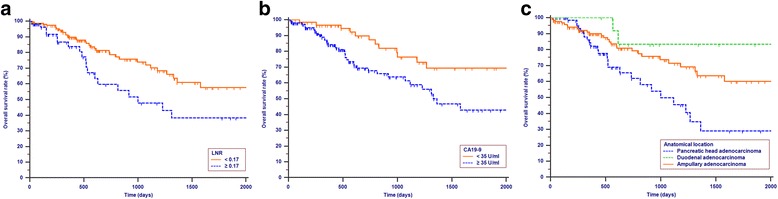
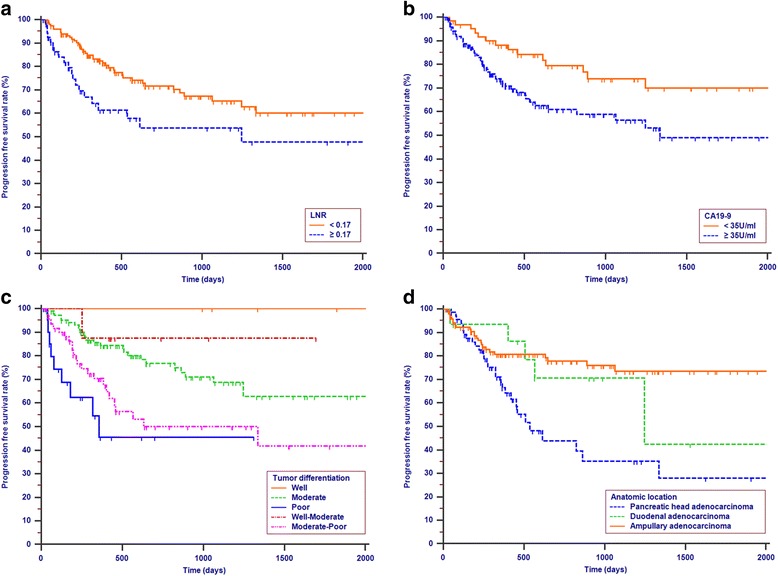
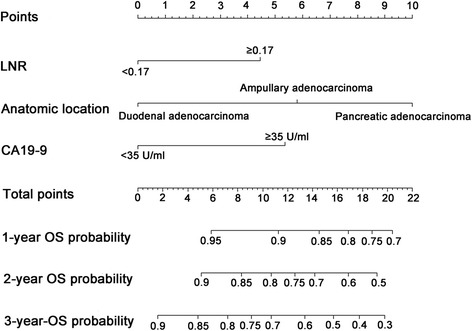
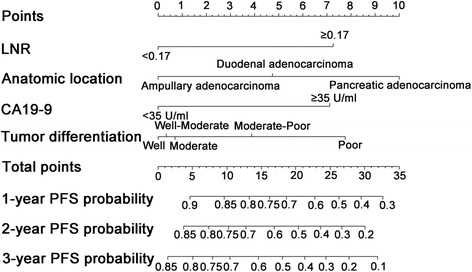
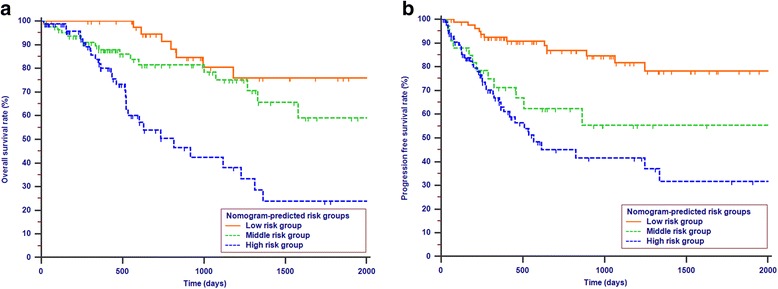
Results: Lymph node ratio (LNR), carbohydrate antigen 19-9 (CA19-9) and anatomical location were incorporated into the nomogram for OS prediction and LNR, CA19-9; anatomical location and tumor differentiation were incorporated into the nomogram for PFS prediction. All calibration plots for the probability of OS and PFS fit well. The Cindexes of the nomograms for OS and PFS prediction were 0.678 and 0.68, respectively. The OS and PFS survival times were stratified significantly using the nomogram-predicted survival probabilities.
Conclusions: The present nomograms for OS and PFS prediction can provide valuable information for tailored decision-making for patients with periampullary adenocarcinoma after pancreatoduodenectomy.
Keywords: Nomogram; Pancreatoduodenectomy; Periampullary adenocarcinoma; Prediction; Prognosis.
Conflict of interest statement
Ethics approval and consent to participate
This study was approved by the Institutional Review Board (IRB) of the Sun Yat-sen University Cancer Center. All procedures performed in studies involving human participants were in accordance with the ethical standards of the institutional and/or national research committee and with the 1964 Helsinki Declaration and its later amendments or comparable ethical standards. Written informed consent was obtained from patients prior to treatment.
Consent for publication
Not applicable
Competing interests
The authors declare that they have no competing interests.
Publisher’s Note
Springer Nature remains neutral with regard to jurisdictional claims in published maps and institutional affiliations.
Figures
References
-
- Amin MBES, Greene F. AJCC Cancer staging manual. 8. Chicago: Springer; 2017.
-
- Siegel RL, Miller KD, Jemal A. Cancer statistics, 2016. CA Cancer J Clin. 2016;66(1):7–30. - PubMed
-
- Petrova E, Ruckert F, Zach S, Shen Y, Weitz J, Grutzmann R, Wittel UA, Makowiec F, Hopt UT, Bronsert P, et al. Survival outcome and prognostic factors after pancreatoduodenectomy for distal bile duct carcinoma: a retrospective multicenter study. Langenbeck's Arch Surg. 2017;402(5):831–840. - PubMed
Publication types
MeSH terms
Substances
Grants and funding
LinkOut - more resources
Full Text Sources
Other Literature Sources
Medical
