. 2018 Mar 27:7:e30955.
doi: 10.7554/eLife.30955.

Hypoexcitability precedes denervation in the large fast-contracting motor units in two unrelated mouse models of ALS

Affiliations

Hypoexcitability precedes denervation in the large fast-contracting motor units in two unrelated mouse models of ALS

María de Lourdes Martínez-Silva et al. Elife. .

Abstract

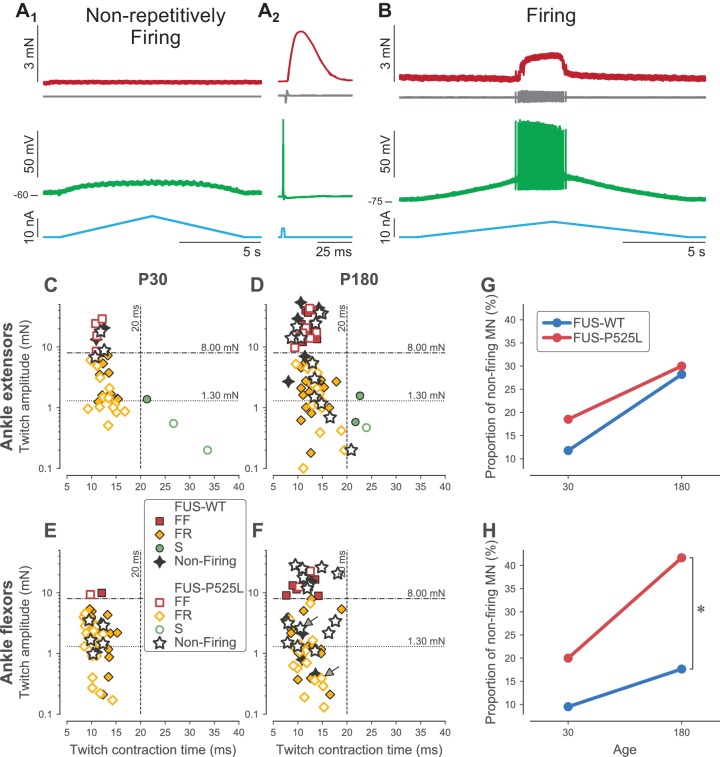
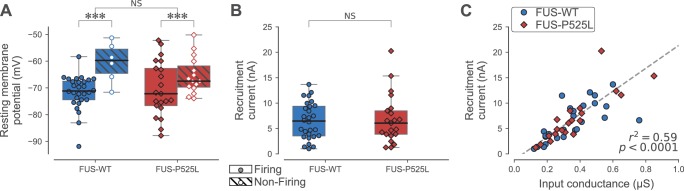
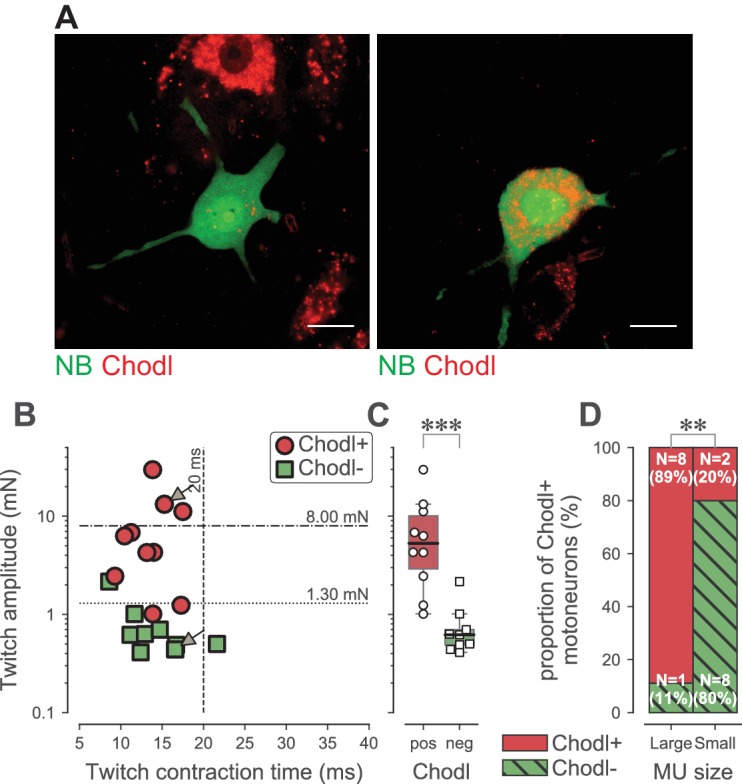
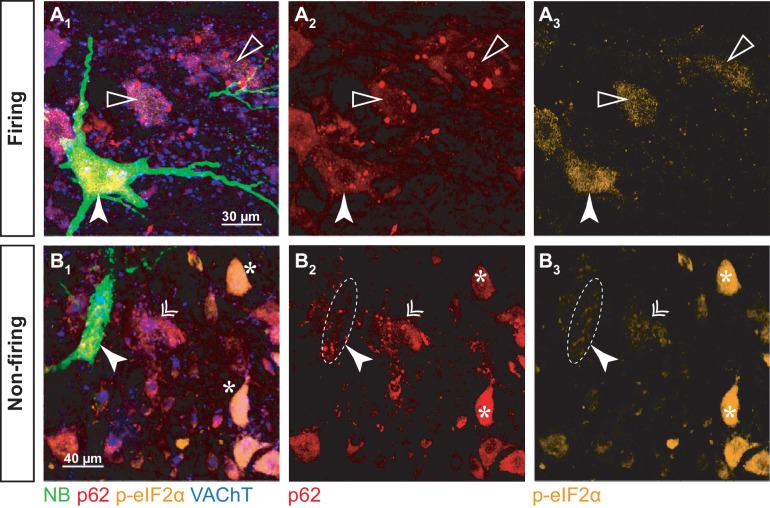
Hyperexcitability has been suggested to contribute to motoneuron degeneration in amyotrophic lateral sclerosis (ALS). If this is so, and given that the physiological type of a motor unit determines the relative susceptibility of its motoneuron in ALS, then one would expect the most vulnerable motoneurons to display the strongest hyperexcitability prior to their degeneration, whereas the less vulnerable should display a moderate hyperexcitability, if any. We tested this hypothesis in vivo in two unrelated ALS mouse models by correlating the electrical properties of motoneurons with their physiological types, identified based on their motor unit contractile properties. We found that, far from being hyperexcitable, the most vulnerable motoneurons become unable to fire repetitively despite the fact that their neuromuscular junctions were still functional. Disease markers confirm that this loss of function is an early sign of degeneration. Our results indicate that intrinsic hyperexcitability is unlikely to be the cause of motoneuron degeneration.

Keywords: electrophysiology; firing properties; in vivo intracellular recordings; motoneuron; motor neuron; mouse; neuroscience.


Conflict of interest statement

MM, RI, AS, CH, NS, FR, DZ, MM No competing interests declared

Figures

Figure 1.
Figure 1.. Examples of 3 motor units with different contractile properties.
(A) FF motor unit. (A1) Twitch (top trace), and motor unit action potential (MUAP, bottom trace) elicited by a spike generated in the cell body of the investigated motoneuron (green dot indicates the time the spike was generated). (A2) Examples of unfused tetani recorded at the beginning (0 min) the middle (11/2 min) and the end (3 min) of the fatigue test. Note that, in this particular motor unit, the MUAP tended to decrease during the train (filled arrowhead), but the amplitude of the first MUAP stayed constant during the fatigue test (empty arrowhead). (A3) Time course of the decline in amplitude of the first twitch in each train over the duration of the fatigue test. Horizontal dotted lines indicate the amplitude of the first twitch in the first train and the amplitude of the first twitch in the last train, used to calculate the Fatigue Index (FI; see Materials and methods). (B) FR unit, same arrangement as in A. (C) S motor unit, same arrangement as in A. Traces in A1, B1 and C1 are averages of 5–10 sweeps.
Figure 2.
Figure 2.. Classification of motor units.
(A) Contractile properties of WT motor units. (A1) Distribution of the twitch amplitude (logarithmic scale) vs. twitch contraction time. The motor units indicated by an arrow correspond to the three motor units of Figure 1. The vertical dashed line at 20 ms represents the limit between the fast and slow-contracting motor units. The horizontal dash-dotted line at 8 mN represents the limit between FR and FF motor units. The filled markers correspond to the motor units in which the fatigue index was measured, while the empty markers correspond to the motor units for which the fatigability was not measured. (A2) Distribution of the Fatigue Index vs. the twitch contraction time. The dash-dotted line at 0.5 represents the limit between fatigue-resistant and fatigable motor units. (A3) Distribution of the Fatigue Index vs. twitch amplitude (logarithmic scale). (B) Contractile properties of SOD1G93A motor units. Same organization as in A.
Figure 3.
Figure 3.. Loss of repetitive firing in a subpopulation of large motor units.
(A) Example of an FF-type SOD1G93A motoneuron that was unable to fire repetitively in response to a slow ramp of current (A1), despite being able to generate a single spike in response to a short pulse of current (A2), and despite being still connected to its muscle fibers, as shown by the presence of a motor unit action potential and a motor unit twitch following the spike. Top red trace: force developed by the motor unit. Grey trace, second from the top: EMG recording showing the motor unit action potentials. Green trace, second from bottom: membrane potential. Bottom blue trace: injected current. A2 is an average of 10 sweeps. (B) Example of a S-type SOD1G93A motoneuron that was able to fire repetitively in response to a slow ramp of current. Same organization as in A. (C) Comparison of the proportion of Firing (filled bar) and Non-Firing (hatched bar) motoneurons in WT (blue) vs. SOD1G93A mice (red). (D) Contractile properties of WT motor units in which we tested the ability to fire repetitively. The motoneurons that were unable to fire repetitively are indicated by a star. The dashed lines at 8 mN and 20 ms represent the limits used to classify the motor units, and the dotted line and 1.3 mN represent the separation line between Large and Small motor units. (E) Contractile properties of SOD1G93A motoneurons in which we tested the ability to fire repetitively. Motoneurons indicated by an arrow correspond to the two examples in panels A and B. Same legend as in D. Comparison of the twitch amplitude (F), input conductance (G) and resting membrane potential (H) of WT (blue circles) and SOD1G93A (red diamonds) motoneurons based on whether they were able (filled symbols, empty box-and-whisker plot) or unable (empty symbols, hatched box-and-whisker plot) to fire, repetitively. The box-and-whisker plots are defined as follows: the boxes extend from the first to third quartile values of the data, with a line at the median. The whiskers extend from the box up to 1.5 times the interquartile range to show the range of the data.
Figure 4.
Figure 4.. Firing properties of WT and SOD1G93A motoneurons.
(A) Relationship between recruitment current and input conductance of WT (blue circles) vs. SOD1G93A (red diamonds) motoneurons. (B) Comparison of the current required to elicit the first spike on a ramp of current (recruitment current) of WT (blue box, circles) vs. SOD1G93A (red box, diamonds) motoneurons. (C) Comparison of the distance between the resting membrane potential and the voltage threshold for spiking (∆V) of WT (blue box, circles) vs. SOD1G93A (red box, diamonds) motoneurons. (D) Comparison of the F-I curve gains (slope of the frequency versus injected current curve measured in the primary range) of WT (blue box, circles) vs. SOD1G93A (red box, diamonds) motoneurons. In all panels, the definition of the box-and-whisker plots is the same as in Figure 3.
Figure 5.
Figure 5.. Loss of repetitive firing in a subpopulation of cells of FUS mice.
(A) Example of an ankle flexor FUSP525L motoneuron (recorded at P180) that was unable to fire repetitively in response to a slow ramp of current (A1), despite being able to generate a single spike in response to a short pulse of current (A2), and despite being still connected to its muscle fibers, as shown by the presence of a motor unit action potential and a motor unit twitch following the spike. Top red trace: force developed by the motor unit. Grey trace, second from the top: EMG recording showing the motor unit action potentials. Green trace, second from bottom: membrane potential. Bottom blue trace: injected current. A2 is an average of 15 sweeps. (B) Example of an ankle flexor FUSP525L motoneuron (recorded at P180) that was able to fire repetitively in response to a slow ramp of current. Same organization as in A. (C) Contractile properties of motor units innervating ankle extensor muscles at P30. Filled symbols represent motor units recorded in FUSWT mice, colored according to their physiological type (FF: red squares; FR: yellow diamonds, S: green circles). WT motor units that were unable to fire repetitively are represented with a black four-pointed star. Empty symbols represent motor units recorded in FUSP525L, colored according to their physiological type (FF: red squares; FR: yellow diamonds, S: green circles). Mutant motor units that were unable to fire repetitively are represented with a black empty five-pointed star. The dashed lines at 8 mN and 20 ms represent the limits used to classify the motor units, and the dotted line and 1.3 mN represent the separation line between Large and Small motor units. (D) Contractile properties of motor units innervating ankle extensor muscles at P180. Same legend as in C. (E) Contractile properties of motor units innervating ankle flexor muscles at P30. Same legend as in C. (F) Contractile properties of motor units innervating ankle flexor muscles at P180. Same legend as in C. Motoneurons indicated by an arrow correspond to the two examples in panels A and B. (G) Comparison between FUSWT (blue) and FUSP525L (red) mice of the proportion of non-firing cells innervating ankle extensor muscles at P30 and P180. (H) Comparison between FUSWT (blue) and FUSP525L (red) mice of the proportion of non-firing cells innervating ankle flexor muscles at P30 and P180.
Figure 6.
Figure 6.. Electrical properties of FUSWT and FUSP525L motoneurons innervating ankle flexor muscles at P180.
(A) Comparison of the resting membrane potential of FUSWT (blue box, circles) vs. FUSP525L (red box, diamonds) motoneurons innervating ankle flexor muscles at P180, split according to whether they were able (filled symbols) to fire repetitively or not (empty symbols, hatched box-and-whisker plot). (B) Comparison of the current required to elicit the first spike on a ramp of current (recruitment current) of FUSWT (blue box, circles) vs. FUSP525L (red box, diamonds) motoneurons. (C) Relationship between recruitment current and input conductance of FUSWT (blue circles) vs. FUSP525L (red diamonds) motoneurons. In all panels, the definition of the box-and-whisker plots is the same as in Figure 3.
Figure 7.
Figure 7.. Chondrolectin expression in TS motor units.
(A) Two examples of intracellular-labeled (NB, green) motoneurons, coupled with ISH revelation of Chodl RNA (Chodl, red). Left panel: Chodl− small FR motoneuron; Right panel: Chodl +FF motoneuron. Scale bars: 15 µm. (B) Contractile properties of the motor units tested for chondrolectin expression. The motoneurons indicated with arrows correspond to the two cells in A. Red circles are the motoneurons that expressed chondrolectin, while green squares are those that did not. The dashed lines at 8 mN and 20 ms represent the limits used to classify the motor units, and the dotted line at 1.3 mN represent the separation line between Large and Small motor units. (C) Comparison of the average twitch amplitude of motor units split according to their expression of chondrolectin. Same legend as in B. The definition of the box-and-whisker plots is the same as in Figure 3. (D) Comparison of the proportion of cells expressing chondrolectin in the population of tested cells, split in two categories, large and small, according to a limit set to 1.3 mN.
Figure 8.
Figure 8.. p-eIF2α and p62 burden in firing and non-firing SOD1G93A motoneurons.
(A) Example of a neurobiotin-labeled repetitively firing motoneuron. (A1) shows the overlay of the neurobiotin (green), p62 (red), p-eIF2α (orange) and VAChT (blue). (A2) and A3) show the p62 and p-eIF2α labeling, respectively. The labeled motoneuron is indicated with a filled arrowhead. Empty arrowheads point to neighboring motoneurons with higher p62 burden but lower p-eIF2α fluorescence. (B) Example of a neurobiotin-labeled non-repetitively-firing motoneuron. Same organization as in A. The labeled motoneuron is indicated with a filled arrowhead. The double arrow point to a neighboring motoneuron with a similar p62 and p-eIF2α burden. The asterisks indicate other motoneurons with high p-eIF2α labeling but no p62 aggregates.
Figure 8—figure supplement 1.
Figure 8—figure supplement 1.. Small motoneurons express low levels of disease markers.
(A) Small α-motoneurons (filled arrowheads), identified by the presence of C-boutons (VAChT, blue) do not display p62 aggregates (red). (B) The same small motoneurons (filled arrowheads) express little to no p-eIF2α (orange). Scale bars: 35 µm.

Comment in

References

    1. Alstermark B, Ogawa J. In vivo recordings of bulbospinal excitation in adult mouse forelimb motoneurons. Journal of Neurophysiology. 2004;92:1958–1962. doi: 10.1152/jn.00092.2004. - DOI - PubMed
    1. Attwell D, Laughlin SB. An energy budget for signaling in the grey matter of the brain. Journal of Cerebral Blood Flow & Metabolism. 2001;21:1133–1145. doi: 10.1097/00004647-200110000-00001. - DOI - PubMed
    1. Bernard-Marissal N, Moumen A, Sunyach C, Pellegrino C, Dudley K, Henderson CE, Raoul C, Pettmann B. Reduced calreticulin levels link endoplasmic reticulum stress and Fas-triggered cell death in motoneurons vulnerable to ALS. Journal of Neuroscience. 2012;32:4901–4912. doi: 10.1523/JNEUROSCI.5431-11.2012. - DOI - PMC - PubMed
    1. Bloemberg D, Quadrilatero J. Rapid determination of myosin heavy chain expression in rat, mouse, and human skeletal muscle using multicolor immunofluorescence analysis. PLoS One. 2012;7:e35273. doi: 10.1371/journal.pone.0035273. - DOI - PMC - PubMed
    1. Bories C, Amendola J, Lamotte d'Incamps B, Durand J. Early electrophysiological abnormalities in lumbar motoneurons in a transgenic mouse model of amyotrophic lateral sclerosis. European Journal of Neuroscience. 2007;25:451–459. doi: 10.1111/j.1460-9568.2007.05306.x. - DOI - PubMed

Publication types