

Determination of Dynamical Heterogeneity from Dynamic Neutron Scattering of Proteins
- PMID: 29580551
- PMCID: PMC6129452
- DOI: 10.1016/j.bpj.2018.02.024
Determination of Dynamical Heterogeneity from Dynamic Neutron Scattering of Proteins
Abstract
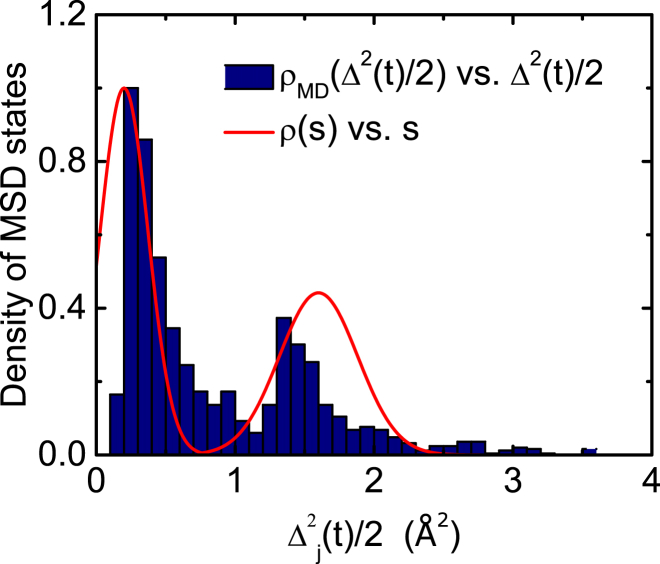
Motional displacements of hydrogen (H) in proteins can be measured using incoherent neutron-scattering methods. These displacements can also be calculated numerically using data from molecular dynamics simulations. An enormous amount of data on the average mean-square motional displacement (MSD) of H as a function of protein temperature, hydration, and other conditions has been collected. H resides in a wide spectrum of sites in a protein. Some H are tightly bound to molecular chains, and the H motion is dictated by that of the chain. Other H are quite independent. As a result, there is a distribution of motions and MSDs of H within a protein that is denoted dynamical heterogeneity. The goal of this paper is to incorporate a distribution of MSDs into models of the H incoherent intermediate scattering function, I(Q,t), that is calculated and observed. The aim is to contribute information on the distribution as well as on the average MSD from comparison of the models with simulations and experiment. For example, we find that simulations of I(Q,t) in lysozyme are well reproduced if the distribution of MSDs is bimodal with two broad peaks rather than a single broad peak.
Copyright © 2018 Biophysical Society. All rights reserved.
Figures


Similar articles
-
Motional displacements in proteins: The origin of wave-vector-dependent values.Phys Rev E Stat Nonlin Soft Matter Phys. 2015 May;91(5):052705. doi: 10.1103/PhysRevE.91.052705. Epub 2015 May 14. Phys Rev E Stat Nonlin Soft Matter Phys. 2015. PMID: 26066197
-
Derivation of mean-square displacements for protein dynamics from elastic incoherent neutron scattering.J Phys Chem B. 2012 Apr 26;116(16):5028-36. doi: 10.1021/jp2102868. Epub 2012 Apr 13. J Phys Chem B. 2012. PMID: 22471396
-
Impact of anisotropic atomic motions in proteins on powder-averaged incoherent neutron scattering intensities.J Chem Phys. 2012 Dec 14;137(22):225101. doi: 10.1063/1.4769782. J Chem Phys. 2012. PMID: 23249033
-
Rigidity of protein structure revealed by incoherent neutron scattering.Biochim Biophys Acta Gen Subj. 2020 Apr;1864(4):129536. doi: 10.1016/j.bbagen.2020.129536. Epub 2020 Jan 17. Biochim Biophys Acta Gen Subj. 2020. PMID: 31958544 Review.
-
Protein-water displacement distributions.Biochim Biophys Acta. 2005 Jun 1;1749(2):173-86. doi: 10.1016/j.bbapap.2005.03.010. Epub 2005 Apr 9. Biochim Biophys Acta. 2005. PMID: 15893505 Review.
References
-
- Krueger S., Zaccai G., Gellert M. Neutron and light-scattering studies of DNA gyrase and its complex with DNA. J. Mol. Biol. 1990;211:211–220. - PubMed
-
- Lindner P., Bewersdorff H.R., Oberthr R. Drag-reducing surfactant solutions in laminar and turbulent flow investigated by small-angle neutron scattering and light scattering. Prog. Colloid Polym. Sci. 1990;81:107–112.
Publication types
MeSH terms
Substances
LinkOut - more resources
Full Text Sources
Other Literature Sources
Research Materials
