. 2018 May 15:646:16-23.
doi: 10.1016/j.abb.2018.03.028. Epub 2018 Mar 24.

Inhibition of anthrax lethal factor by ssDNA aptamers

Affiliations

Inhibition of anthrax lethal factor by ssDNA aptamers

Mieke Lahousse et al. Arch Biochem Biophys. .

Abstract

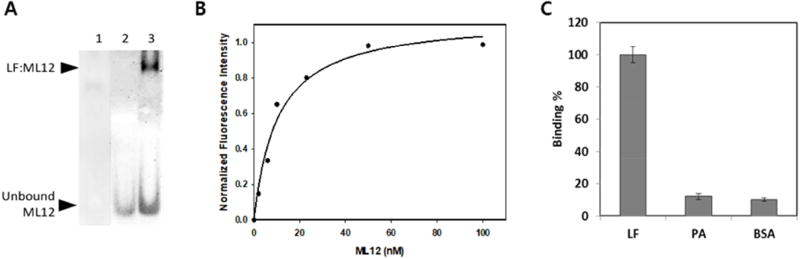
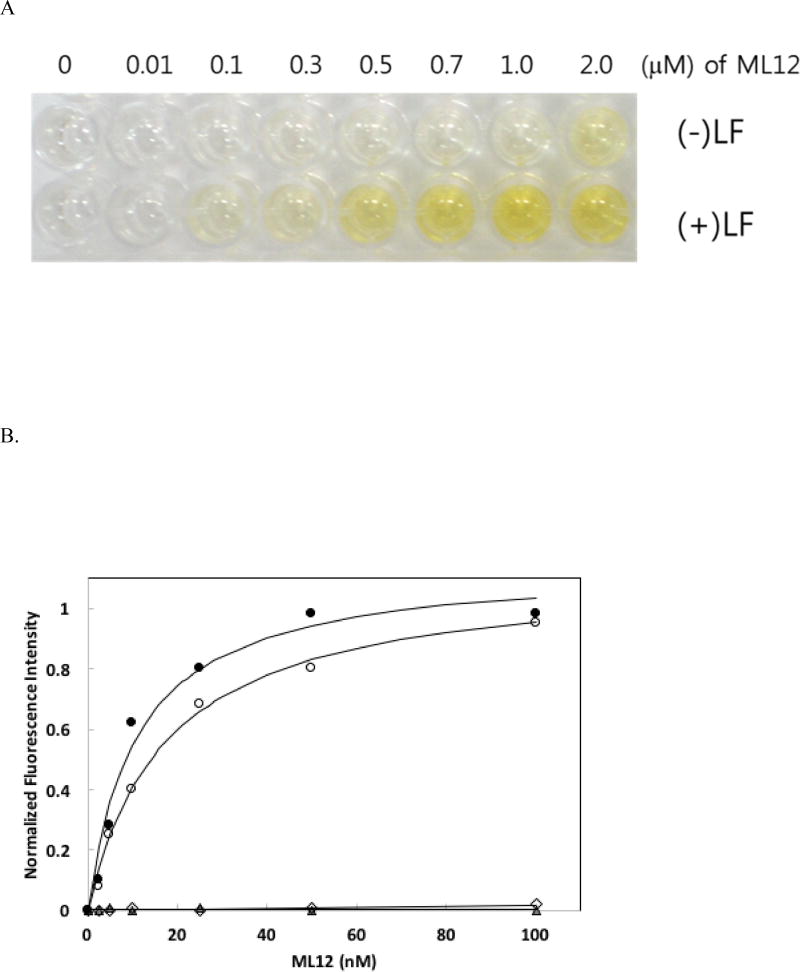
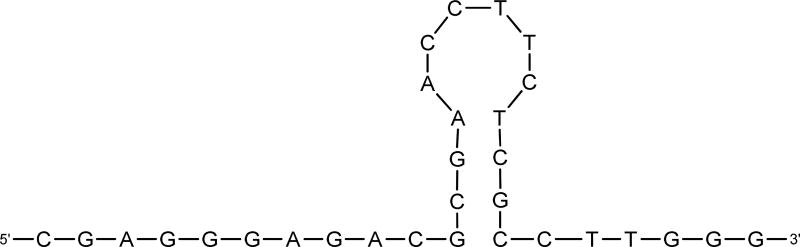
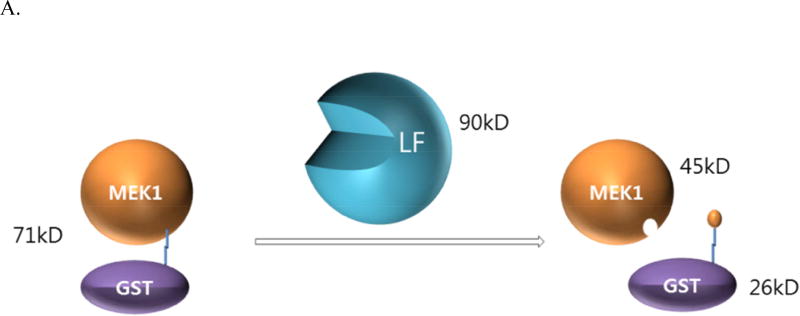
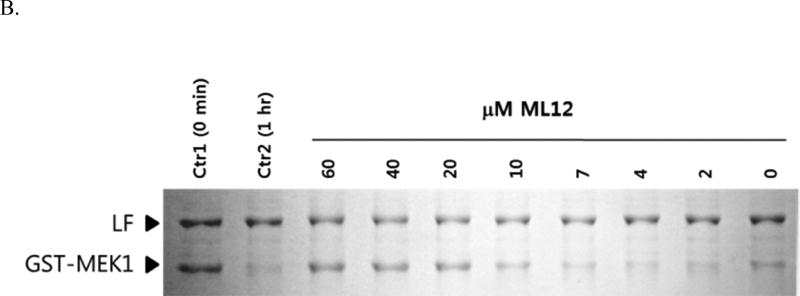
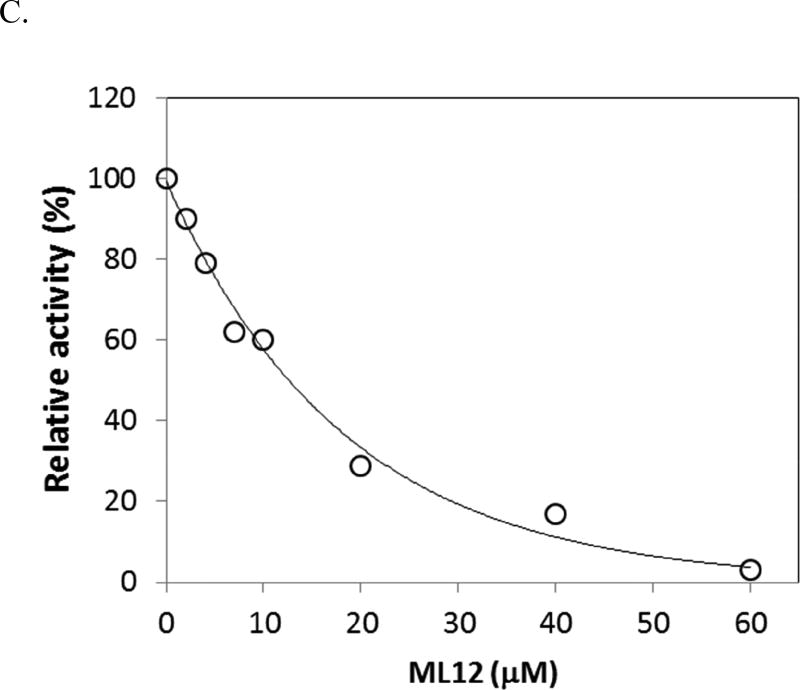
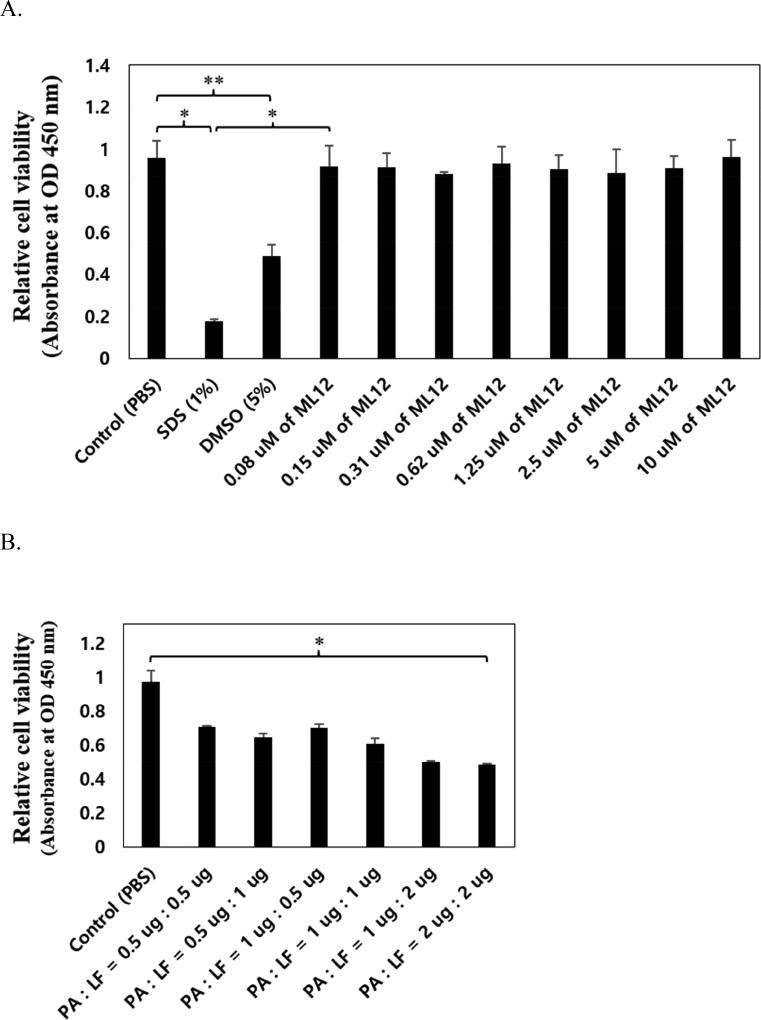
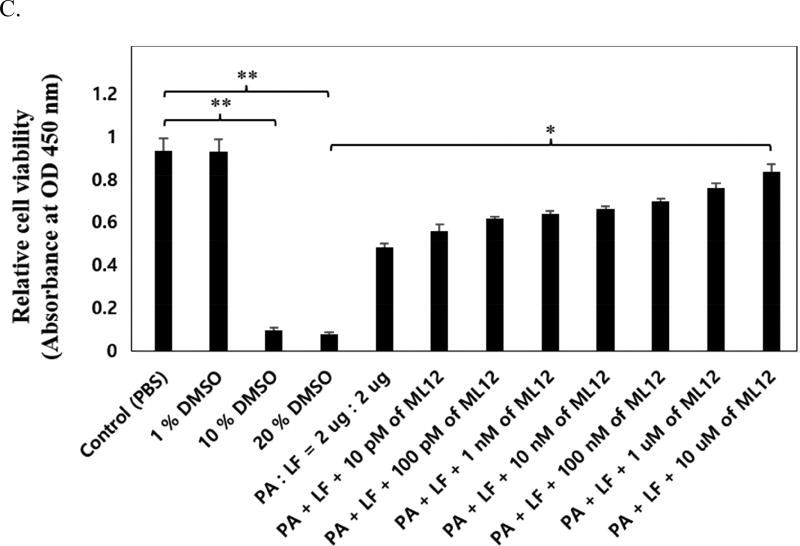
Anthrax is caused by Bacillus anthracis, a bacterium that is able to secrete the toxins protective antigen, edema factor and lethal factor. Due to the high level of secretion from the bacteria and its severe virulence, lethal factor (LF) has been sought as a biomarker for detecting bacterial infection and as an effective target to neutralize toxicity. In this study, we found three aptamers, and binding affinity was determined by fluorescently labeled aptamers. One of the aptamers exhibited high affinity, with a Kd value of 11.0 ± 2.7 nM, along with low cross reactivity relative to bovine serum albumin and protective antigen. The therapeutic functionality of the aptamer was examined by assessing the inhibition of LF protease activity against a mitogen-activated protein kinase kinase. The aptamer appears to be an effective inhibitor of LF with an IC50 value of 15 ± 1.5 μM and approximately 85% cell viability, suggesting that this aptamer provides a potential clue for not only development of a sensitive diagnostic device of B. anthracis infection but also the design of novel inhibitors of LF.


Figures

Figure 1
Figure 1
Binding experiments between LF and ML12. (A) Gel shift assay between LF and the aptamer ML12. Lane 1 represents the gel result after loading only LF; Lane 2 represents the gel result after loading only ssDNAs; Lane 3 respresent the gel result after loading ssDNAs and LF. The top band shows the complex of LF and ML12 and the bottom band shows unbound ML12 in a 6 % native gel with 5.9 µM LF and 100 nM ML12 using SYBR gold staining. Prior to loading sample, 20 min incubation at 30 °C in buffer (30 mM Tris, pH 8.0, 100 mM NaCl, 5.0 mM KCl and 0.6 mM MgCl2) was conducted. The total sample volume was 10 µL. (B) Determination of binding affinity of aptamers. The black circles are for ML12 and the empty circles are for ML12 with flanking sequences. Binding reactions were carried out with a constant concentration of LF protein in a 96-well black plate and varied concentarions of Cy3-attached ML12. The fluorescent intensity of the bound ML12 or ML12 with flanking sequences to LF was measured after a couple of washing steps. The Kd value was determined by nonlinear fitting of the saturation binding curve. (C) Binding specificty of ML12 against BSA by the fluorescent intensity measurement of bound Cy3-ML12 to either LF or BSA. The concentration of the proteins (LF and BSA) was kept constant at 0.5 µM, and 10 nM of ML12 was used for initial incubation against the proteins.
Figure 2
Figure 2
ELISA method using biotinylated aptamers. (A) The results of ELISA using biotinylated ML12. The first row contains only BSA and the second row contains a fixed concentration of LF (0.5 µg/well) with various concentrations of biotinylated ML12 (0 – 2.0 µM). Biotinlyated aptamers interacted with horseradish peroxidase-conjugated streptavidin, followed by the addition of teramethyl benzine. To quench the reaction, sulfuric acid was added. (B) Determination of binding affinity using ELISA. The gray-color filled circles are for ML12 and the empty circles are for ML12 with flanking sequences. The absorbance (450 nm) intensity of the bound ML12 or ML12 with flanking sequences to LF was measured. The Kd value was determined by nonlinear fitting of the saturation binding curve. The gray-color filled triangles are for ML6 and the empty diamonds are for ML7.
Figure 3
Figure 3
Predicted secondary structure of ML12. The 14-mer (5’-GCGAACCTTCTCGC-3’) is shown as a stem-and-loop structure.
Figure 4
Figure 4
Inhibition of LF by ML12. (A) A diagram for the proteolytic assay of LF to GST-MEK1. (B) ML12 inhibits cleavage of GST-MEK1 by LF. Lane 1 (Ctr1) is a control test with no pre-incubation time for LF cleavage reaction with GST-MEK1; Lane 2 (Ctr2) is another control with l h incubation for the reaction between LF and GST-MEK.1 Subsequent lanes (third through last lanes) contains LF and GST-MEK1 with treatment of varied concentration of ML12. Except the first lane (Ctr1), the pre-incubation time for the LF cleavage reaction with GST-MEK1 was 1 h. (C) Determination of IC50 value of ML12. The intensities of the band corresponding to GST-MEK1 were plotted as a function of the concentration of ML12. The data were fitted to an exponential decay curve.
Figure 4
Figure 4
Inhibition of LF by ML12. (A) A diagram for the proteolytic assay of LF to GST-MEK1. (B) ML12 inhibits cleavage of GST-MEK1 by LF. Lane 1 (Ctr1) is a control test with no pre-incubation time for LF cleavage reaction with GST-MEK1; Lane 2 (Ctr2) is another control with l h incubation for the reaction between LF and GST-MEK.1 Subsequent lanes (third through last lanes) contains LF and GST-MEK1 with treatment of varied concentration of ML12. Except the first lane (Ctr1), the pre-incubation time for the LF cleavage reaction with GST-MEK1 was 1 h. (C) Determination of IC50 value of ML12. The intensities of the band corresponding to GST-MEK1 were plotted as a function of the concentration of ML12. The data were fitted to an exponential decay curve.
Figure 5
Figure 5
Cytotoxicity test of ML12 on Raw 264.7 cell by MTT assay. (A) Confirmation of cell toxicity for ML12. ML12 was treated with various concentrations (0.08 – 10.0 µM), and 1% SDS and 5% DMSO were used as negative controls (*p < 0.02 and **p < 0.05). (B) Optimization of anthrax toxin effect in the cell by addition of PA and LF with concentration ratio dependent (*p < 0.005). (C) Confirmation of inhibitory effect of ML12 for anthrax lethal toxin. The experiment was conducted and relative cell viability in the presence or absence of both 2 µg of PA and LF with ML12 cocentration dependent manner. The DMSO was used as a negative control. (*p < 0.002 and **p < 0.005). All measurements were conducted in triplicate.
Figure 5
Figure 5
Cytotoxicity test of ML12 on Raw 264.7 cell by MTT assay. (A) Confirmation of cell toxicity for ML12. ML12 was treated with various concentrations (0.08 – 10.0 µM), and 1% SDS and 5% DMSO were used as negative controls (*p < 0.02 and **p < 0.05). (B) Optimization of anthrax toxin effect in the cell by addition of PA and LF with concentration ratio dependent (*p < 0.005). (C) Confirmation of inhibitory effect of ML12 for anthrax lethal toxin. The experiment was conducted and relative cell viability in the presence or absence of both 2 µg of PA and LF with ML12 cocentration dependent manner. The DMSO was used as a negative control. (*p < 0.002 and **p < 0.005). All measurements were conducted in triplicate.

References

    1. Baldari CT, Tonello F, Paccani SR, Montecucco C. Trends Immunol. 2006;27:434–440. - PubMed
    1. Turk BE. Biochem. J. 2007;402:405–417. - PubMed
    1. Koehler TM. Mol. Aspects Med. 2009;30:386–396. - PMC - PubMed
    1. Young JA, Collier RJ. Annu. Rev. Biochem. 2007;76:243–265. - PubMed
    1. Scobie HM, Young JA. Curr. Opin. Microbiol. 2005;8:106–112. - PubMed

Publication types

LinkOut - more resources