

Neurovascular Coupling During Visual Stimulation in Multiple Sclerosis: A MEG-fMRI Study
- PMID: 29580963
- PMCID: PMC6458991
- DOI: 10.1016/j.neuroscience.2018.03.018
Neurovascular Coupling During Visual Stimulation in Multiple Sclerosis: A MEG-fMRI Study
Abstract
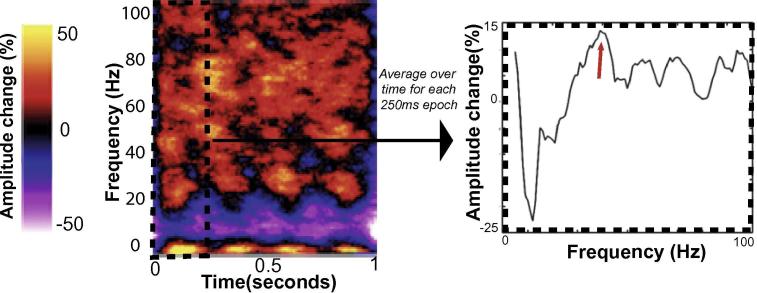
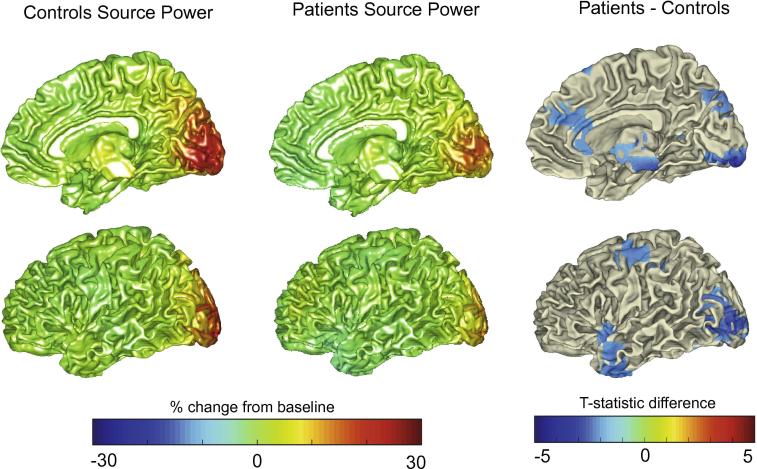
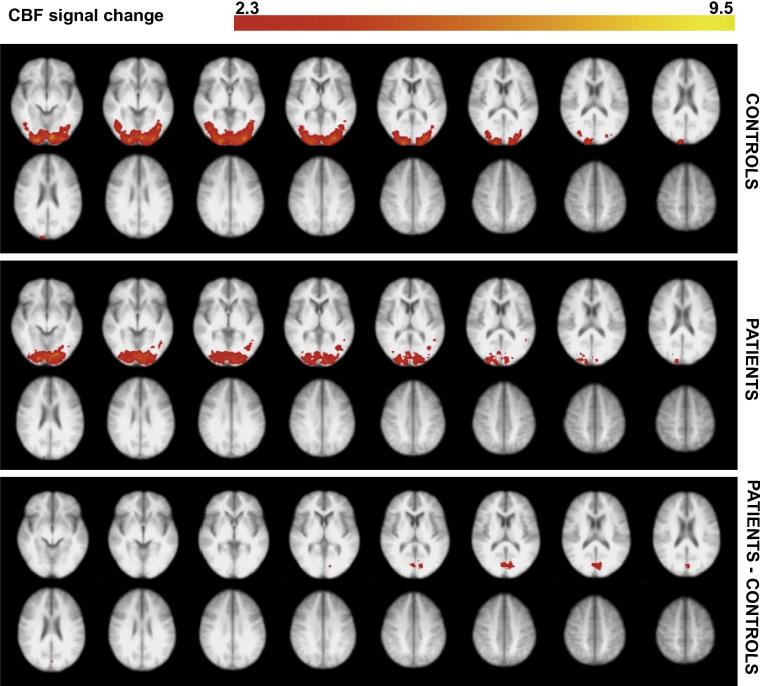
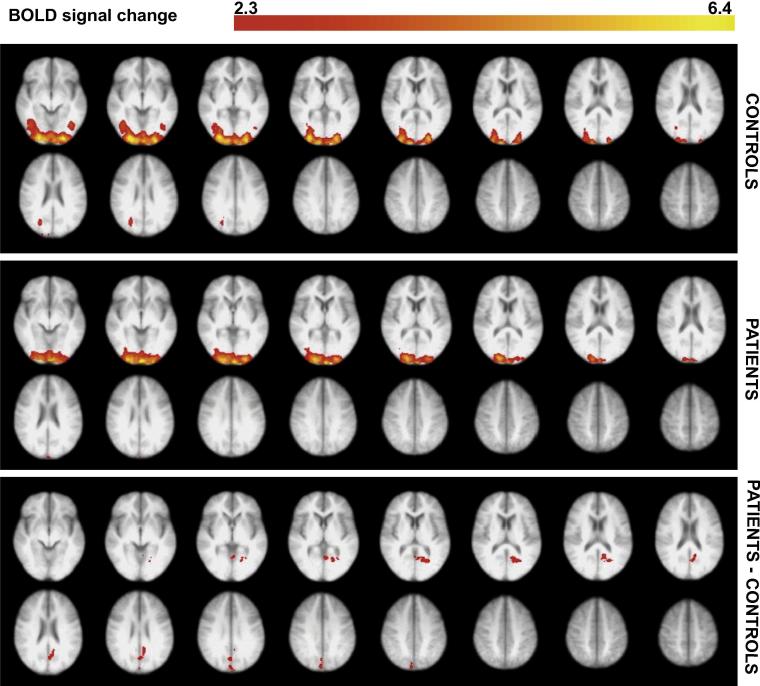
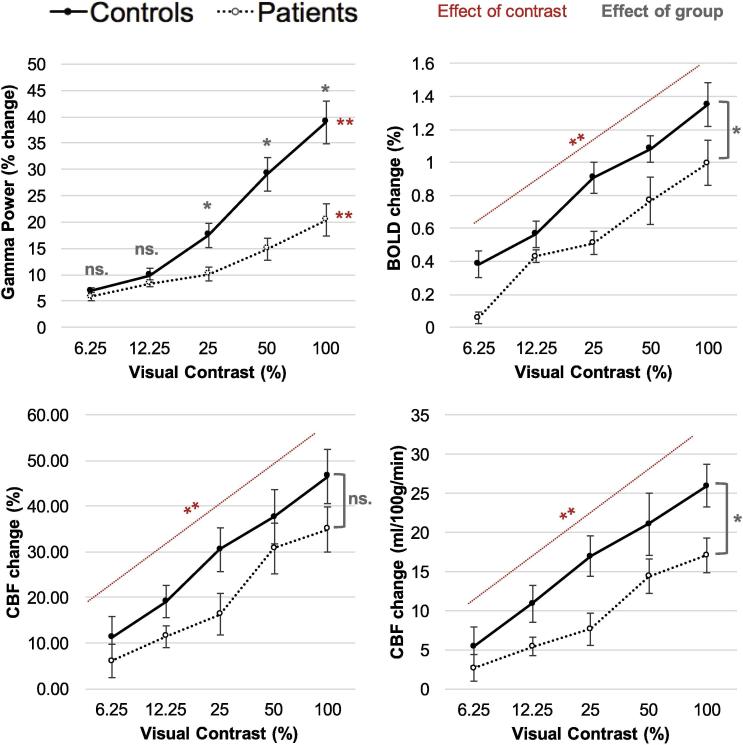
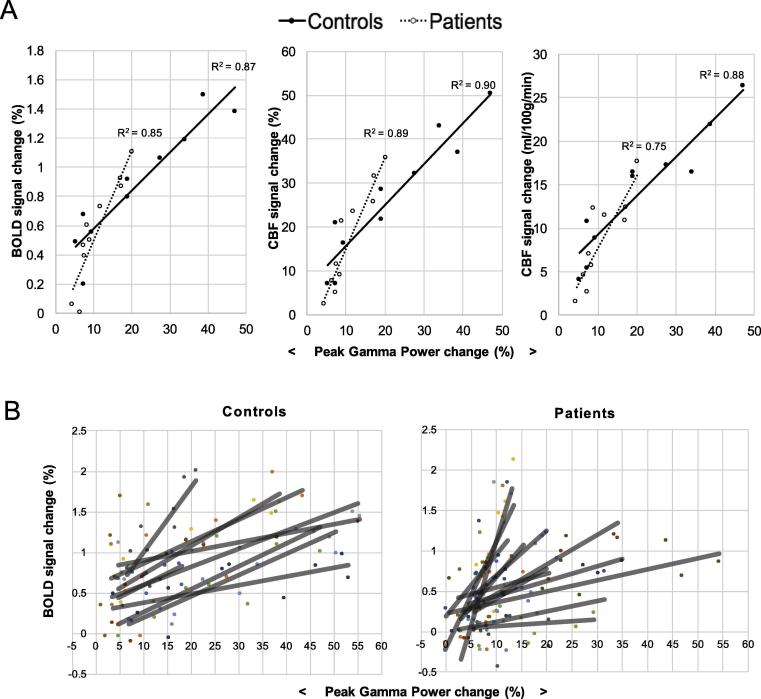
The process of neurovascular coupling ensures that increases in neuronal activity are fed by increases in cerebral blood flow. Evidence suggests that neurovascular coupling may be impaired in Multiple Sclerosis (MS) due to a combination of brain hypoperfusion, altered cerebrovascular reactivity and oxygen metabolism, and altered levels of vasoactive compounds. Here, we tested the hypothesis that neurovascular coupling is impaired in MS. We characterized neurovascular coupling as the relationship between changes in neuronal oscillatory power within the gamma frequency band (30-80 Hz), as measured by magnetoencephalography (MEG), and associated hemodynamic changes (blood oxygenation level dependent, BOLD, and cerebral blood flow, CBF) as measured by functional MRI. We characterized these responses in the visual cortex in 13 MS patients and in 10 matched healthy controls using a reversing checkerboard stimulus at five visual contrasts. There were no significant group differences in visual acuity, P100 latencies, occipital gray matter (GM) volumes and baseline CBF. However, in the MS patients we found a significant reduction in peak gamma power, BOLD and CBF responses. There were no significant differences in neurovascular coupling between groups, in the visual cortex. Our results suggest that neuronal and vascular responses are altered in MS. Gamma power reduction could be an indicator of GM dysfunction, possibly mediated by GABAergic changes. Altered hemodynamic responses confirm previous reports of a vascular dysfunction in MS. Despite altered neuronal and vascular responses, neurovascular coupling appears to be preserved in MS, at least within the range of damage and disability studied here.
Keywords: Multiple Sclerosis; cerebral blood flow; functional MRI; magnetoencephalography; neurovascular coupling; visual function.
Copyright © 2018 The Authors. Published by Elsevier Ltd.. All rights reserved.
Figures
Similar articles
-
The neurovascular basis of processing speed differences in humans: A model-systems approach using multiple sclerosis.Neuroimage. 2020 Jul 15;215:116812. doi: 10.1016/j.neuroimage.2020.116812. Epub 2020 Apr 8. Neuroimage. 2020. PMID: 32276075
-
Investigation of neuro-vascular reactivity on fMRI study during visual activation in people with multiple sclerosis using EEG and hypercapnia challenge.Med Phys. 2025 Jun;52(6):5081-5090. doi: 10.1002/mp.17772. Epub 2025 Mar 21. Med Phys. 2025. PMID: 40116356 Free PMC article.
-
The absolute CBF response to activation is preserved during elevated perfusion: Implications for neurovascular coupling measures.Neuroimage. 2016 Jan 15;125:198-207. doi: 10.1016/j.neuroimage.2015.10.023. Epub 2015 Oct 23. Neuroimage. 2016. PMID: 26477657 Free PMC article.
-
Submillimeter-resolution fMRI: Toward understanding local neural processing.Prog Brain Res. 2016;225:123-52. doi: 10.1016/bs.pbr.2016.03.003. Epub 2016 Apr 1. Prog Brain Res. 2016. PMID: 27130414 Review.
-
Separating vascular and neuronal effects of age on fMRI BOLD signals.Philos Trans R Soc Lond B Biol Sci. 2021 Jan 4;376(1815):20190631. doi: 10.1098/rstb.2019.0631. Epub 2020 Nov 16. Philos Trans R Soc Lond B Biol Sci. 2021. PMID: 33190597 Free PMC article. Review.
Cited by
-
Visual Dysfunction in Multiple Sclerosis and its Animal Model, Experimental Autoimmune Encephalomyelitis: a Review.Mol Neurobiol. 2021 Jul;58(7):3484-3493. doi: 10.1007/s12035-021-02355-4. Epub 2021 Mar 20. Mol Neurobiol. 2021. PMID: 33745114 Review.
-
Neurovascular dysfunction in vascular dementia, Alzheimer's and atherosclerosis.BMC Neurosci. 2018 Oct 17;19(1):62. doi: 10.1186/s12868-018-0465-5. BMC Neurosci. 2018. PMID: 30333009 Free PMC article. Review.
-
Deficits in Early Sensory and Cognitive Processing Are Related to Phase and Nonphase EEG Activity in Multiple Sclerosis Patients.Brain Sci. 2021 May 13;11(5):629. doi: 10.3390/brainsci11050629. Brain Sci. 2021. PMID: 34068315 Free PMC article.
-
N-acetyl cysteine administration affects cerebral blood flow as measured by arterial spin labeling MRI in patients with multiple sclerosis.Heliyon. 2021 Jul 16;7(7):e07615. doi: 10.1016/j.heliyon.2021.e07615. eCollection 2021 Jul. Heliyon. 2021. PMID: 34377857 Free PMC article.
-
Structural correlates of atypical visual and motor cortical oscillations in pediatric-onset multiple sclerosis.Hum Brain Mapp. 2020 Oct 15;41(15):4299-4313. doi: 10.1002/hbm.25126. Epub 2020 Jul 10. Hum Brain Mapp. 2020. PMID: 32648649 Free PMC article.
References
-
- Attwell D., Iadecola C. The neural basis of functional brain imaging signals. Trends Neurosci. 2002;25(12):621–625. - PubMed
Publication types
MeSH terms
Substances
Grants and funding
LinkOut - more resources
Full Text Sources
Other Literature Sources
Medical
