. 2018 Jul 15:175:12-21.
doi: 10.1016/j.neuroimage.2018.03.035. Epub 2018 Mar 23.

Correlation of neural activity with behavioral kinematics reveals distinct sensory encoding and evidence accumulation processes during active tactile sensing

Affiliations

Correlation of neural activity with behavioral kinematics reveals distinct sensory encoding and evidence accumulation processes during active tactile sensing

Ioannis Delis et al. Neuroimage. .

Abstract

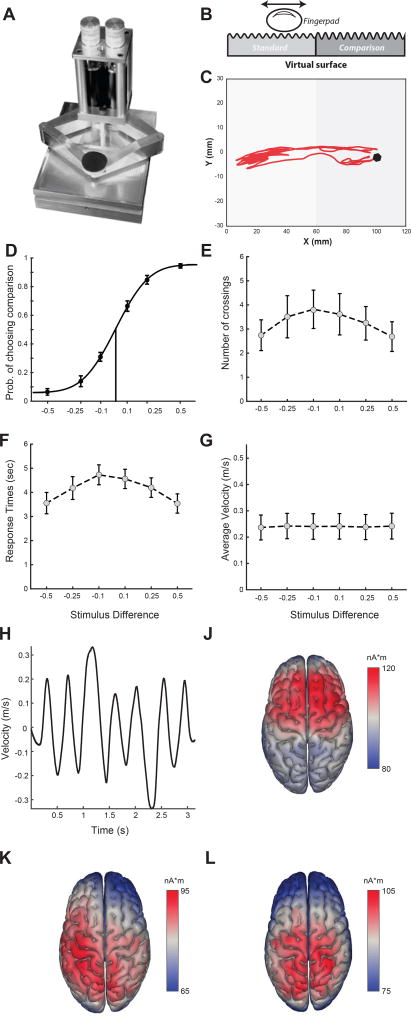
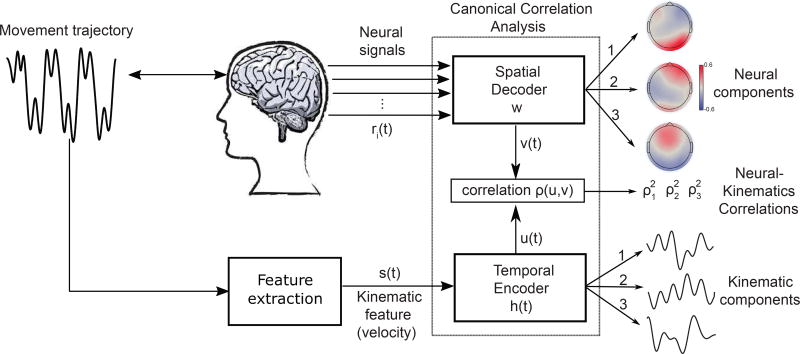
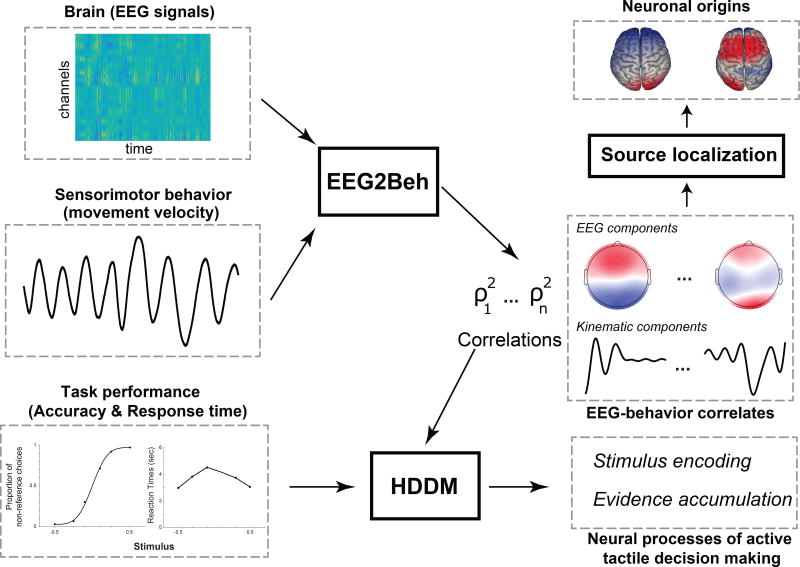
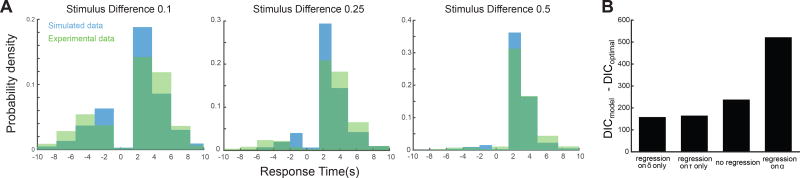
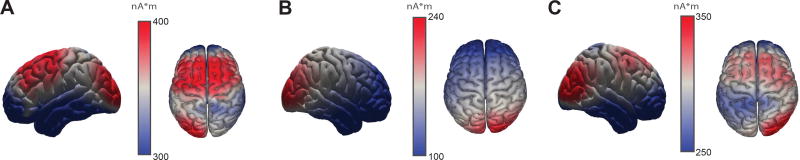
Many real-world decisions rely on active sensing, a dynamic process for directing our sensors (e.g. eyes or fingers) across a stimulus to maximize information gain. Though ecologically pervasive, limited work has focused on identifying neural correlates of the active sensing process. In tactile perception, we often make decisions about an object/surface by actively exploring its shape/texture. Here we investigate the neural correlates of active tactile decision-making by simultaneously measuring electroencephalography (EEG) and finger kinematics while subjects interrogated a haptic surface to make perceptual judgments. Since sensorimotor behavior underlies decision formation in active sensing tasks, we hypothesized that the neural correlates of decision-related processes would be detectable by relating active sensing to neural activity. Novel brain-behavior correlation analysis revealed that three distinct EEG components, localizing to right-lateralized occipital cortex (LOC), middle frontal gyrus (MFG), and supplementary motor area (SMA), respectively, were coupled with active sensing as their activity significantly correlated with finger kinematics. To probe the functional role of these components, we fit their single-trial-couplings to decision-making performance using a hierarchical-drift-diffusion-model (HDDM), revealing that the LOC modulated the encoding of the tactile stimulus whereas the MFG predicted the rate of information integration towards a choice. Interestingly, the MFG disappeared from components uncovered from control subjects performing active sensing but not required to make perceptual decisions. By uncovering the neural correlates of distinct stimulus encoding and evidence accumulation processes, this study delineated, for the first time, the functional role of cortical areas in active tactile decision-making.

Keywords: Active tactile sensing; Canonical correlation analysis; EEG; Hierarchical drift diffusion model; Pantograph; Perceptual decision-making.


Figures

Figure 1
Figure 1
Experimental design, behavioral results and principal components of EEG signals. A. The Pantograph is a haptic device used to render virtual surfaces that can be actively sensed. B. The stimulus. We programmed the Pantograph to generate a virtual grating texture. The workspace was split into two subspaces (left - L and right - R) that differed in the amplitude of the virtual surface that the subjects actively sensed. One of the two sides (randomly assigned) had the reference amplitude (equal to 1) and the other had the comparison amplitude that varied on each trial taking one of the values: 0.5, 0.75, 0.9, 1.1, 1.25, and 1.5. C. Index finger trajectory indicating the scanning pattern of the virtual texture in one trial. The two red dots indicate the starting point and endpoint. On this trial, the subject actively sensed the left subspace first, then moved to the right subspace and explored it before coming back to the left subspace again and reporting their choice. D. Psychometric curve indicating the percentage of non-reference choices for all stimulus differences. Dots indicate average proportion of choices across subjects and errorbars are standard error of the means (sem) across subjects. Data are fit using a cumulative Gaussian function. E. Response times for all stimulus differences shown as averages (± sem) across subjects. F. Number of crossings (i.e. switchings between the two stimuli) for all stimulus differences shown as averages (± sem) across subjects. G. Average finger velocities for all stimulus differences shown as averages (± sem) across subjects. H. Velocity profile of the finger movement during the example trial. J-K-L. Brain sources of the first three principal components of the recorded EEG signals across subjects.
Figure 2
Figure 2
Schematic view of EEG2Beh(avior) and the identified. Subjects move their fingers to actively sense a surface while their brain activity (e.g. EEG signals) ri(t) is recorded. The relevant kinematic features of the sensorimotor behavior (the movement velocity here) are extracted, resulting in a time series s(t). An optimization procedure, implemented via canonical correlation analysis, then computes spatial filters w to apply to the neural signals and temporal filters h(t) to apply to the velocity such that the resulting filter outputs are maximally correlated in time. The algorithm output is a set of multiple EEG-kinematic components and their coupling strengths ρ2. Three pairs of EEG components (scalp maps of neural activity) and their matching kinematic components (temporal profiles of velocity filters) were found to show significant correlations.
Figure 3
Figure 3
Illustration of the analysis framework implemented in this study. To characterize active tactile decision-making, three types of measurements are simultaneously made: a) EEG recordings, b) sensorimotor signals (movement kinematics), and c) task performance measures (accuracy and response time - RT). EEG and kinematic signals are input to the EEG2Beh algorithm that outputs pairs of brain – behavior coupling components (scalp maps and temporal kinematic filters) and their correlation measures ρ2. The brain (EEG) components are input to a source localization algorithm to identify their neuronal origins. The EEG2Beh coupling strengths ρ2 inform the hierarchical drift diffusion modelling (HDDM) of the task performance data. HDDM uses the ρ2 to translate accuracy and RT into the components of decision-making processing (such as evidence accumulation or stimulus encoding) thereby characterizing the functional role of each EEG2Beh component.
Figure 4
Figure 4
Brain sources of the three EEG components showing significant brain-behavior couplings.
Figure 5
Figure 5
HDDM fitting and model comparisons. A. Choice proportions and RT distributions are captured by EEG2Beh-informed HDDM. Behavioral RT distributions (in green) are shown for each stimulus difference together with posterior predictive simulations from the HDDM (in blue). Negative values in the time axis correspond to incorrect choices and positive values represent correct choices. Higher histogram values in the positive time axis indicate higher proportion of correct choices. Fitting accuracy is worse with lower stimulus differences. B. Comparison with alternate models. We compared the HDDM model of choice with alternative HDDM models using the Deviance Information Criterion (DIC). We tested HDDM models where either the drift rate (δ) or the non-decision time (τ) or both were not dependent on the EEG2Beh correlations and a model where the decision boundary (α) was dependent on the EEG2Beh correlations. Positive difference DIC values (DICmodel – DICoptimal) for all four models indicate that the model of choice achieved a better trade-off between goodness-of-fit and number of free parameters.
Figure 6
Figure 6
Formulation of best HDDM model and regression results. A. Graphical model showing hierarchical estimation of Drift Diffusion Model parameters with EEG2Beh regressors. Round nodes represent continuous random variables and double-bordered nodes represent deterministic variables, defined in terms of other variables. Shaded nodes represent recorded or computed signals, including single-trial behavioral data (accuracy, RT) and EEG2Beh coupling measures (ρ2). Open nodes represent unobserved latent parameters. Parameters are modelled as random variables with inferred means μ and variances σ2. Plates denote that multiple random variables share the same parents and children. The outer plate is over difficulty levels d while the inner plate is over trials n. For example, each single-trial boundary separation an,d shares the same parents μα and σα2 that define the distribution across trials and difficulty levels. Single-trial variations of non-decision time τ and drift rate δ are determined by EEG2Beh couplings with regression coefficients βi and γi. B. Violin plots showing the distribution of the regression coefficients βi (100 samples drawn from the distribution) of the coupling strengths ρi2 of the three EEG2Beh components for the prediction of single-trial non-decision times τ. C. Violin plots showing the distribution of the regression coefficients γi (100 samples drawn from the distribution) of the coupling strengths ρi2 of the three EEG2Beh components for the prediction of single-trial drift rates δ.
Figure 7
Figure 7
Brain sources of the three significant EEG2Beh components extracted from the data of the control experiment, i.e. when subjects actively explored the tactile stimuli but did not make any perceptual choice.

Similar articles

Cited by

References

    1. Bell AJ, Sejnowski TJ. An information-maximization approach to blind separation and blind deconvolution. Neural Comput. 1995;7:1129–1159. - PubMed
    1. Campion G, Wang Q, Hayward V. The Pantograph Mk-II: A haptic instrument. 2005 Ieee/Rsj International Conference on Intelligent Robots and Systems. 2005;1–4:723–728.
    1. Cavanagh JF, Wiecki TV, Kochar A, Frank MJ. Eye tracking and pupillometry are indicators of dissociable latent decision processes. Journal of experimental psychology General. 2014;143:1476–1488. - PMC - PubMed
    1. Cavanagh JF, Wiecki TV, Cohen MX, Figueroa CM, Samanta J, Sherman SJ, Frank MJ. Subthalamic nucleus stimulation reverses mediofrontal influence over decision threshold. Nat Neurosci. 2011;14:1462–1467. - PMC - PubMed
    1. Chukoskie L, Snider J, Mozer MC, Krauzlis RJ, Sejnowski TJ. Learning where to look for a hidden target. Proc Natl Acad Sci U S A. 2013;110(Suppl 2):10438–10445. - PMC - PubMed

Publication types