Spatial separation between replisome- and template-induced replication stress signaling
- PMID: 29581097
- PMCID: PMC5920239
- DOI: 10.15252/embj.201798369
Spatial separation between replisome- and template-induced replication stress signaling
Abstract
Polymerase-blocking DNA lesions are thought to elicit a checkpoint response via accumulation of single-stranded DNA at stalled replication forks. However, as an alternative to persistent fork stalling, re-priming downstream of lesions can give rise to daughter-strand gaps behind replication forks. We show here that the processing of such structures by an exonuclease, Exo1, is required for timely checkpoint activation, which in turn prevents further gap erosion in S phase. This Rad9-dependent mechanism of damage signaling is distinct from the Mrc1-dependent, fork-associated response to replication stress induced by conditions such as nucleotide depletion or replisome-inherent problems, but reminiscent of replication-independent checkpoint activation by single-stranded DNA Our results indicate that while replisome stalling triggers a checkpoint response directly at the stalled replication fork, the response to replication stress elicited by polymerase-blocking lesions mainly emanates from Exo1-processed, postreplicative daughter-strand gaps, thus offering a mechanistic explanation for the dichotomy between replisome- versus template-induced checkpoint signaling.
Keywords: DNA damage bypass; DNA damage checkpoint; Exo1; postreplication repair; replication stress.
© 2018 The Authors. Published under the terms of the CC BY 4.0 license.
Figures

DNA damage sensitivities of Tet‐RAD18 strains carrying the indicated gene deletions, determined by growth assays in the presence (top) or absence (bottom) of Rad18.
Experimental scheme for measuring recovery of viability after UV irradiation (20 J/m2) upon Tet‐RAD18 induction at the indicated times after release into S phase (AS: asynchronous; αF: alpha‐factor). For details, see Materials and Methods.
Cell cycle profiles of the indicated strains at the time of plating.
Survival of the indicated strains, relative to unirradiated controls. Error bars indicate SD derived from three independent experiments.

DNA damage sensitivities of yeast strains carrying the indicated gene deletions, determined by growth assays.
Re‐expression of Rad18 (top) and HisPCNA ubiquitylation (bottom) after removing doxycycline in UV‐irradiated cells of the indicated strains. Ubiquitylation of His6‐tagged PCNA was detected as described previously (Daigaku et al, 2010).
Experimental scheme for measuring viability after UV irradiation (20 J/m2) at the indicated times after release into S phase, performed as described in Fig 1B, but under conditions of continuous Tet‐RAD18 expression (AS: asynchronous; αF: alpha‐factor).
Survival of the indicated strains, relative to unirradiated controls. Survival above 100% reflects cell division within 4 h.
Recovery of viability is abolished in a catalytically inactive rad53 mutant.
Magnification of selected panels from Fig 1D.
Rad53 phosphorylation in the specified strains upon release into S phase after UV irradiation in the absence of Rad18, monitored by Western blotting.

Yeast chromosomes, analyzed by pulsed‐field gel electrophoresis and ethidium bromide staining (top) or Southern blotting for chromosome V (middle). Replication intermediates accumulate in the wells. Cell cycle profiles are shown below the respective strains.
Quantification of Rad52YFP recombination foci and representative images. Error bars indicate SD derived from three independent experiments. Scale bar = 5 μm.
Analysis of mitotic aberrations. Cells were classified into cell cycle stages according to spindle morphology (see Fig EV2C and D for examples).
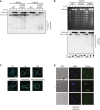
Pulsed‐field gel electrophoresis and Southern blotting analysis of chromosome IV in WT and rad53Δ released into S phase after UV irradiation in the presence or absence of Rad18. Replication intermediates accumulate in the wells.
Pulsed‐field gel electrophoresis analyzed by ethidium bromide staining (top) and Southern blotting (middle) for chromosome IV in WT, mrc1Δ, and rad9Δ in the absence of Rad18, treated as above. Cell cycle profiles are shown at the bottom.
Classification of cells into cell cycle stages according to spindle morphology (blue: DAPI: green: tubulin). Scale bar = 5 μm.
Examples of cells undergoing aberrant divisions.

Loss of Rad53 before S phase: recovery assays upon RAD18 induction were performed as described in Fig 1B, but Rad53AID*−9myc degradation was induced by adding auxin during synchronization.
Loss of Rad53 in G2/M phase: assays were performed as above, but Rad53AID*−9myc degradation was induced 4 h after release into S phase.
Transient loss of Rad53: recovery was measured after Rad53AID*−9myc degradation during synchronization and re‐expression together with RAD18 at the indicated times during the cell cycle.
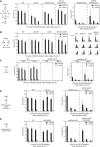
In response to replication stress, Rad53 upregulates dNTP production through phosphorylation of Dun1, which in turn targets the transcriptional repressor Crt1 and the protein inhibitors Sml1 and Dif1, thereby relieving ribonucleotide reductase (RNR) inhibition and boosting dNTP levels (Hustedt et al, 2013) (left). Deletion of DUN1 reduces the capacity of cells to recover, and this effect is suppressed partially by deletion of SML1 and almost completely by a concomitant deletion of SML1 and CRT1 (middle). Hence, upregulation of dNTP levels is required for efficient damage bypass. However, sml1Δ and crt1Δ do not compensate for loss of RAD53 (right). Therefore, upregulation of dNTP levels is required, but not sufficient to maintain bypass competence.
In response to replication stress, Rad53 inhibits late origin firing through phosphorylation of Dbf4 and Sld3 (Lopez‐Mosqueda et al, 2010; Zegerman & Diffley, 2010) (left). Cells expressing non‐phosphorylatable alleles of DBF4 and SLD3 (dbf4‐4A sld3‐A) (Zegerman & Diffley, 2010) recover virtually as efficiently as WT cells (middle), even though they progress through S phase as rapidly as the rad53Δ mutant (right). Hence, accelerated progression through S phase or firing of late origins does not preclude efficient postreplicative gap filling.
Delay of mitosis by nocodazole treatment is insufficient to restore viability in rad53Δ. Middle: recovery assays performed with or without addition of nocodazole (added twice: 15 μg/ml at 0 h and 10 μg/ml at 2 h). Right: magnification of the graphs showing rad53Δ.
Rad53 is responsible for induction of a set of MBF‐regulated genes during S phase in response to DNA damage, mediated via inactivation of the transcriptional co‐repressor Nrm1 (left) (Travesa et al, 2012). Hence, NRM1 deletion suppresses rad53Δ‐associated lethality (de Bruin et al, 2006). However, nrm1Δ does not restore Rad18‐dependent recovery of viability in rad53Δ (right), indicating that Nrm1 is not a relevant target of Rad53 in this context.
Rad53 is required for degradation of excess histones upon DNA damage (Gunjan & Verreault, 2003) (left). Reduction in histone gene dosage therefore suppresses HU and MMS sensitivities of rad53Δ (Gunjan & Verreault, 2003). However, reducing histone dosage by deletion of HHT2 and HHF2 does not restore damage bypass competence in a rad53Δ background (right), thus excluding histone dosage as a critical factor.

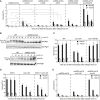
Recovery of viability in strains defective in distinct stages of homologous recombination: mre11Δ (affecting DNA resection), rad55Δ (disabled in the formation of recombinogenic filaments), mms4Δ, slx4Δ, yen1Δ, and sgs1Δ (defective in the resolution or dissolution of joint molecules). Top: control assays performed in a RAD53 background. Bottom: recovery assays of recombination mutants in combination with rad53Δ.
Recovery assays of srs2Δ (left) and srs2Δ rad53Δ (right) indicate that elevated homologous recombination in the srs2Δ mutant (Aguilera & Klein, 1988) does not rescue the recovery defect of rad53Δ.
Poor survival of UV‐irradiated srs2Δ cells grown in the continuous presence of Rad18 indicates that the recovery defect in the srs2Δ background is independent of Rad18.
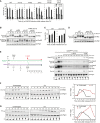
Recovery of viability upon RAD18 induction in the indicated strains, measured as described in Fig 1B (***P < 0.001).
Exo1 and Pif1 phosphorylation in the indicated strains, released into S phase after UV irradiation in the absence of Rad18. Exo19myc and Pif16HA were detected by Western blotting. Pgk1 served as loading control.
Recovery of viability in exo1 mutants (SA: dephospho‐mimicking; ND: nuclease‐dead).
Recovery of viability in strains harboring wild‐type EXO1, exo1‐SA mutant or both alleles (EXO1 + exo1‐SA).
Recovery of viability in rad53Δ exo1‐SA.
As a control for the experiment shown in Fig 4A, recovery of viability upon RAD18 induction was measured in the indicated mutants in a RAD53 background.
Exo1 and Rad53 phosphorylation is largely dependent on Rad9, with Mrc1 acting as a backup. Phosphorylation was assayed in the indicated strains upon release into S phase after UV irradiation (20 J/m2) in the absence of Rad18. Exo19myc and Rad53 were detected by Western blotting. Pgk1 served as loading control.
As a control for the experiment shown in Fig 4C, survival of UV‐irradiated exo1‐SA was measured in the continuous presence of Rad18.
Exo1 phosphorylation is not completely abolished in exo1‐SA. Exo1 phosphorylation was assayed in WT and exo1‐SA cells released into S phase after UV irradiation in the absence of Rad18.
Exo1 levels decline in a Rad53‐independent manner in G2/M, but without significant dephosphorylation. Left: experimental scheme; right: time course of Rad53AID*−9myc and Exo16HA phosphorylation and protein levels in rad53 AID*−9myc cells released into S phase after UV irradiation in the absence of Rad18. At 4 h after release, Rad53AID*−9myc degradation was induced by adding auxin to part of the culture. Pgk1 was used as loading control. Cell cycle profiles are shown at the bottom.
Time course of Exo19myc levels in WT cells released into S phase in the absence of damage or after UV irradiation. Re‐entry into the next S phase was prevented by adding αF after 60 or 90 min, respectively. Exo19myc protein levels, relative to G1 (0 min) and normalized to the Pgk1 signal, are plotted on the right.
Time course of Pif16HA levels in WT cells performed as in panel (F). Pif16HA protein levels, relative to G1 (0 min) and normalized to the Pgk1 signal, are plotted on the right.
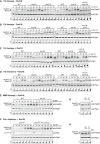
Rad53 phosphorylation in the indicated strains, synchronized in G1, UV‐irradiated (20 J/m2), and released into S phase in the absence of Rad18. Pgk1 served as loading control. Cell cycle profiles are shown below the blots.
Rad53 phosphorylation in the indicated strains, treated as in panel (A).
Rad53 phosphorylation in the indicated strains, treated as in panel (A) but grown in the presence of Rad18.
Rad53 phosphorylation in the indicated strains, synchronized in G1, and released into S phase in medium containing HU (120 mM).
Rad53 phosphorylation in the indicated strains, synchronized in G1, treated with MMS (0.08%) for 30 min, and released into S phase.
Rad53 phosphorylation in the indicated strains, synchronized in G1, and released into S phase. Auxin was added 30 min prior to release for induction of Pol1AID*−9myc degradation.
Rad53 phosphorylation in WT cells, synchronized in G1, undamaged, or UV‐irradiated (20 J/m2) and either maintained in G1 or released into S phase for 20 min.
Rad53 phosphorylation in WT cells, synchronized in G1, untreated or treated with 0.08% MMS for 30 min, and either maintained in G1 or released into S phase for 10 min.

DNA fibers, prepared by combing of genomic DNA isolated from cells synchronized in G1 and released into S phase in the presence of EdU (added 15 min before release). Cells were harvested 20 min after release for control; 30 min after UV irradiation (20 J/m2); 30 min after treatment with 0.04% MMS for 30 min prior to release; and 60 min after release into 120 mM HU. Fibers were stained with YOYO‐1 for total DNA (blue). EdU incorporation was visualized by a click reaction with Alexa Fluor 647 (red), and ssDNA was detected by means of an antibody (green). Scale bar = 10 kbp.
Quantification of the fraction of ssDNA within newly replicated DNA, determined for individual EdU‐stained tracts by measuring total tract length and total length of ssDNA within that tract. Evidence for EdU‐stained regions representing replication tracts is shown in Appendix Fig S3D and E. Number of replication tracts analyzed: Control = 186; UV = 204; MMS = 168; HU = 198.
Quantification of the fraction of ssDNA within or outside of EdU‐stained replication tracts derived from WT or exo1Δ cells, determined as above. G1‐arrested cells were incubated with or without 0.02% MMS for 30 min and released into EdU for 30 min. Number of replication tracts analyzed: WT control = 63; exo1Δ control = 151; WT MMS = 124; exo1Δ MMS = 122. Number of EdU‐negative tracts analyzed: WT control = 96; WT MMS = 171.
Density of ssDNA tracts within or outside of individual replication tracts from the experiment shown in panel (C), calculated by dividing the number of ssDNA tracts by the length (in kb) of the corresponding EdU‐stained or EdU‐negative region.

Upon replisome stalling—after HU treatment or Pol1 degradation—an excess of ssDNA at arrested forks activates Rad53 via Mrc1, which prevents replication fork breakdown by inhibition of Exo1, Pif1 and Rrm3 activities.
Replication through damaged DNA—after UV irradiation or MMS treatment—generates daughter‐strand gaps behind replication forks due to re‐priming events, thereby reducing the exposure of ssDNA at forks. Exo1‐mediated expansion of daughter‐strand gaps is then required for robust Rad9‐dependent Rad53 activation, which in turn leads to Exo1 and Pif1 inhibition by phosphorylation.
References
-
- Alcasabas AA, Osborn AJ, Bachant J, Hu F, Werler PJ, Bousset K, Furuya K, Diffley JF, Carr AM, Elledge SJ (2001) Mrc1 transduces signals of DNA replication stress to activate Rad53. Nat Cell Biol 3: 958–965 - PubMed
-
- Bianco JN, Poli J, Saksouk J, Bacal J, Silva MJ, Yoshida K, Lin YL, Tourriere H, Lengronne A, Pasero P (2012) Analysis of DNA replication profiles in budding yeast and mammalian cells using DNA combing. Methods 57: 149–157 - PubMed
-
- Branzei D, Foiani M (2009) The checkpoint response to replication stress. DNA Rep 8: 1038–1046 - PubMed
Publication types
MeSH terms
Substances
Grants and funding
LinkOut - more resources
Full Text Sources
Other Literature Sources
Research Materials
Miscellaneous

