. 2018 May 22;86(6):e00123-18.
doi: 10.1128/IAI.00123-18. Print 2018 Jun.

Role of Sca2 and RickA in the Dissemination of Rickettsia parkeri in Amblyomma maculatum

Affiliations

Role of Sca2 and RickA in the Dissemination of Rickettsia parkeri in Amblyomma maculatum

Emma K Harris et al. Infect Immun. .

Abstract

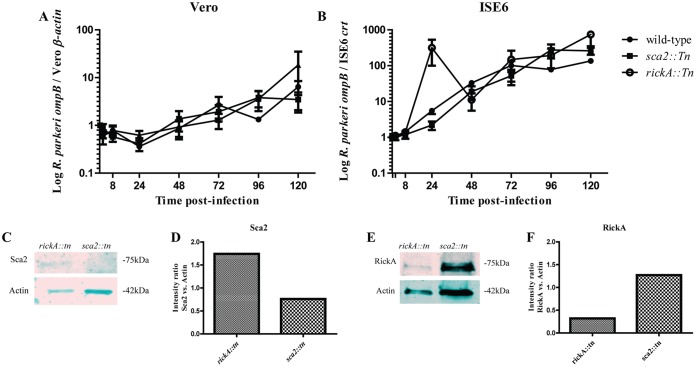
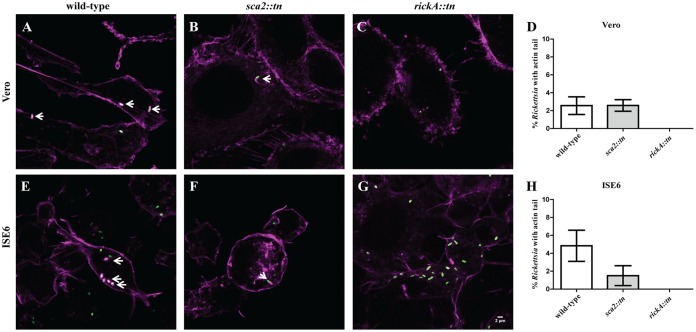
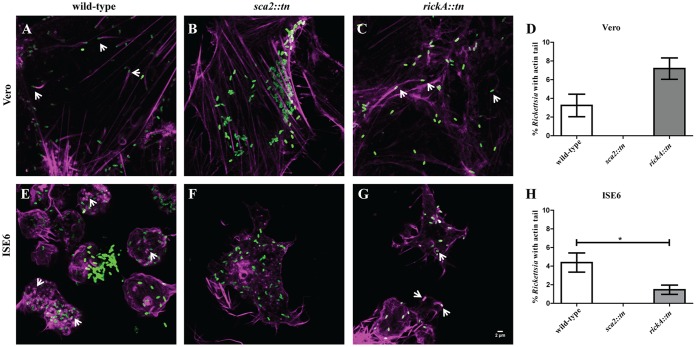
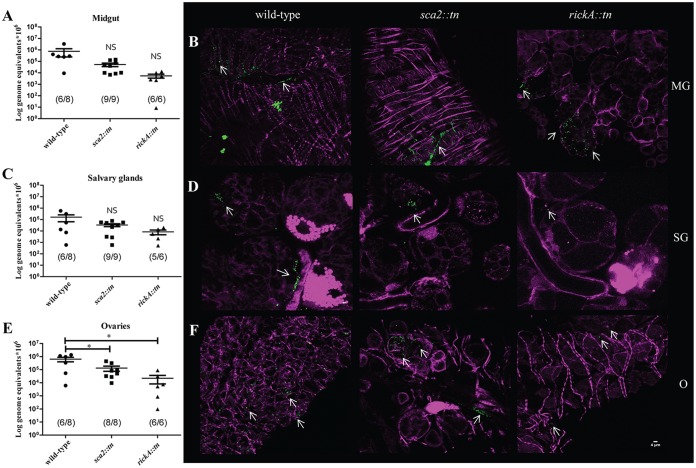
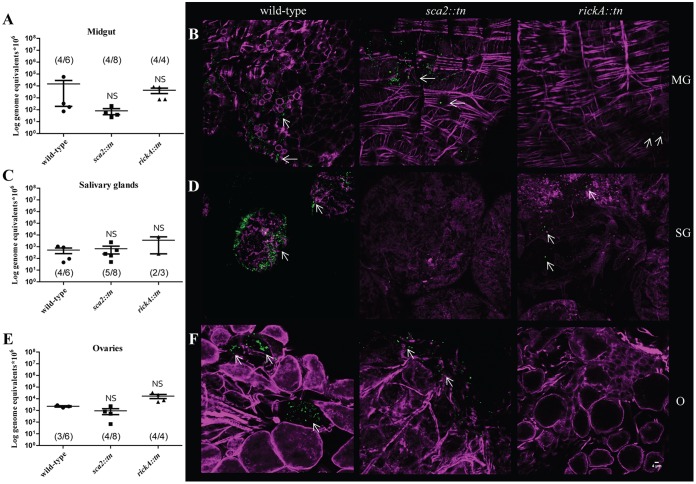
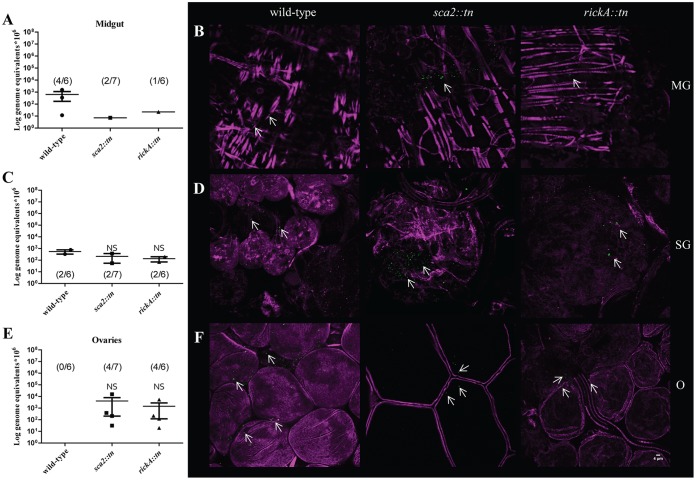
The Gram-negative obligate intracellular bacterium Rickettsia parkeri is an emerging tick-borne human pathogen. Recently, R. parkeri Sca2 and RickA have been implicated in adherence and actin-based motility in vertebrate host cell infection models; however, the rickettsia-derived factors essential to tick infection are unknown. Using R. parkeri mutants lacking functional Sca2 or RickA to compare actin polymerization, replication, and cell-to-cell spread in vitro, similar phenotypes in tick and mammalian cells were observed. Specifically, actin polymerization in cultured tick cells is controlled by the two separate proteins in a time-dependent manner. To assess the role of Sca2 and RickA in dissemination in the tick host, Rickettsia-free Amblyomma maculatum, the natural vector of R. parkeri, was exposed to wild-type, R. parkeri rickA::tn, or R. parkeri sca2::tn bacteria, and individual tick tissues, including salivary glands, midguts, ovaries, and hemolymph, were analyzed at 12 h and after continued bloodmeal acquisition for 3 or 7 days postexposure. Initially, ticks exposed to wild-type R. parkeri had the highest rickettsial load across all organs; however, rickettsial loads decreased and wild-type rickettsiae were cleared from the ovaries at 7 days postexposure. In contrast, ticks exposed to R. parkeririckA::tn or R. parkerisca2::tn had comparatively lower rickettsial loads, but bacteria persisted in all organs for 7 days. These data suggest that while RickA and Sca2 function in actin polymerization in tick cells, the absence of these proteins did not change dissemination patterns within the tick vector.

Keywords: Amblyomma maculatum; RickA; Rickettsia parkeri; Sca2; actin-based motility.


Figures

FIG 1
FIG 1
Actin polymerization of R. parkeri in Vero and ISE6 cells and expression of Sca2 and RickA in ISE6 cells. (A and B) Wild-type R. parkeri (green) polymerizing actin (magenta) in Vero cells at 30 mpi and 48 hpi. (C and D) Wild-type R. parkeri (green) polymerizing actin (magenta) in ISE6 cells 30 mpi and 48 hpi. White scale bar, 2 μm. Arrows indicate Rickettsia polymerizing actin. (E) Percentage of wild-type R. parkeri present in Vero and ISE6 cells with an actin tail at 30 mpi and 2, 24, and 48 hpi. Bacteria with and without actin tails were recorded at each time point postinfection in order to determine the profile of R. parkeri actin polymerization. Error bars represent the standard errors of the means. Data are representative of two replicates per experiment and two independent experiments. Ten images taken across all experimental replicates were used in analyses. (F and G) Western blot (F) and corresponding graph (G) of RickA expression normalized against ISE6 expression of β-actin at 30 mpi and 8 and 48 hpi for wild-type R. parkeri. (H and I) Western blot (H) and corresponding graph (I) of Sca2 expression normalized against ISE6 expression of β-actin at 30 mpi and 8 and 48 hpi for wild-type R. parkeri. Statistical analysis consisted of a one-way ANOVA followed by Tukey's post hoc analysis (G and I) or an unpaired t test (E), with a P value of <0.05 considered significant (denoted by an asterisk). Data are representative of two replicates per experiment and two independent experiments.
FIG 2
FIG 2
Growth curves for R. parkeri wild-type, sca2::tn, and rickA::tn strains in Vero (A) and ISE6 (B) cells. Data are fold change compared to initial input. Collection times consisted of 30 mpi and 2, 8, 24, 48, 72, 96, and 120 hpi. There was a lack of statistical significance at all time points for R. parkeri sca2::tn and rickA::tn strains compared to wild-type R. parkeri across both cell types. Data are representative of three replicates per experiment and two independent experiments. A Kruskal-Wallis test with Dunn's post hoc analysis was completed in GraphPad Prism software. A P value of <0.05 was considered significant. Western blots showing expression or lack of expression of Sca2 (C) and RickA (E) in R. parkeri sca2::tn and rickA::tn. Densitometric analysis of Sca2 (D) and RickA (F) expression in respective mutant strains was completed by normalizing expression of each protein against expression of β-actin in Vero cells.
FIG 3
FIG 3
Actin polymerization profile of wild-type R. parkeri compared to R. parkeri sca2::tn and rickA::tn in Vero and ISE6 cells at 30 mpi. Rickettsia (green) actively polymerizing actin (magenta) in Vero (A to C) and ISE6 (E to G) cells is shown. This assay was repeated for R. parkeri wild-type (A and E), R. parkeri sca2::tn (B and F), and R. parkeri rickA::tn (C and G) strains. (D and H) Graphical representation of percent Rickettsia with an actin tail in Vero (D) and ISE6 (H) cells. Data are representative of two replicates per experiment and two independent experiments. Statistical analysis consisted of a t test. P < 0.05. White scale bar, 2 μm. Arrows indicate Rickettsia polymerizing actin.
FIG 4
FIG 4
Actin polymerization of wild-type R. parkeri compared to that of R. parkeri sca2::tn and rickA::tn in Vero and ISE6 cells at 48 hpi. Rickettsia (green) actively polymerizing actin (magenta) in Vero (A to C) and ISE6 (E to G) cells is shown. Wild-type R. parkeri (A and E), R. parkeri sca2::tn (B and F), and R. parkeri rickA::tn (C and G) strains are depicted. (D and H) Graphical representation of percent Rickettsia with actin tails in Vero (D) and ISE6 (H) cells. Data are representative of two replicates per experiment and two independent experiments. Statistical analysis consisted of a t test, with a P value of <0.05 being significant. White scale bar, 2 μm. Arrows indicate Rickettsia polymerizing actin.
FIG 5
FIG 5
Percentage of R. parkeri-infected Vero and ISE6 cells at 24 hpi. Epifluorescence microscopy of Vero (A to C) or ISE6 (E to G) cells infected with R. parkeri wild type (A and E), R. parkeri sca2::tn (B and F), and R. parkeri rickA::tn (C and G). Cells were stained for Rickettsia (green), nuclear material (blue), and actin (magenta). (D and H) Graphical representation of percent infected Vero (D) and ISE6 (H) cells. Data are representative of two replicates per experiment and two independent experiments. Statistical analysis consisted of a one-way ANOVA with Tukey's post hoc analysis. P < 0.05. White scale bar, 2 μm. Stars indicate cells infected with Rickettsia.
FIG 6
FIG 6
Dissemination of R. parkeri wild-type, sca2::tn, and rickA::tn in A. maculatum at 12 hpe. Mean rickettsial load as quantified by qPCR for the midgut (A), salivary glands (C), and ovaries (E). Inset values represent the number of infected ticks over the number of total ticks tested via qPCR. (B) Confocal microscopy of midgut (B, top), salivary glands (D, middle), and ovaries (F, bottom), corresponding to the data presented in panel A for the R. parkeri wild-type (left), sca2::tn (center), and rickA::tn (right) strains. All tissues were stained for Rickettsia (green) and actin (magenta). Statistical analysis consisted of a one-way ANOVA followed by Tukey's post hoc analysis, with a P value of <0.05 being considered significant (denoted by an asterisk). Error bars represent the SEM. Means are represented by the bar between the SEM. NS indicates nonsignificant data sets compared to wild-type data. Data and images are representative of 2 independent experiments. White scale bar, 4 μm. Arrows indicate rickettsiae.
FIG 7
FIG 7
Dissemination of R. parkeri wild type, sca2::tn, and rickA::tn at 3 dpe. (A, C, and E) Mean rickettsial load as quantified by qPCR for the midgut (A), salivary glands (C), and ovaries (E). Inset values represent the number of infected ticks over the number of total ticks tested via qPCR. (B) Confocal microscopy of midgut (B, top), salivary glands (D, middle), and ovaries (F, bottom), corresponding to the data presented in panel A for R. parkeri wild-type (left), sca2::tn (center), and rickA::tn (right) strains. All tissues were stained for Rickettsia (green) and actin (magenta). Statistical analysis consisted of a one-way ANOVA followed by Tukey's post hoc analysis, with a P value of <0.05 considered significant (denoted by an asterisk). Error bars represent the SEM. The mean is represented by the bar between the SEM. NS indicates nonsignificant data sets compared to wild-type data. Data and images are representative of 2 independent experiments, excepting the R. parkeri rickA::tn strain. White scale bar, 4 μm. Arrows indicate rickettsiae.
FIG 8
FIG 8
Dissemination of R. parkeri wild type, sca2::tn, and rickA::tn at 7 dpe. (A, C, and E) Mean rickettsial load as quantified by qPCR for the midgut (A), salivary glands (C), and ovaries (E). Inset values represent the number of infected ticks over the number of total ticks tested via qPCR. (B) Confocal microscopy of midgut (B, top), salivary glands (D, middle), and ovaries (F, bottom), corresponding to the data presented in panel A for R. parkeri wild-type (left), sca2::tn (center), and rickA::tn (right) strains. All tissues were stained for Rickettsia (green) and actin (magenta). Statistical analysis consisted of a one-way ANOVA followed by Tukey's post hoc analysis, with a P value of <0.05 considered significant (denoted by an asterisk). Error bars represent the SEM. The mean is represented by the bar between the SEM. NS indicates nonsignificant data sets compared to wild-type data. Data and images are representative of 2 independent experiments. White scale bar, 4 μm. Arrows indicate rickettsiae.
FIG 9
FIG 9
Presence of R. parkeri wild type, sca2::tn, and rickA::tn in the hemolymph of exposed A. maculatum. Mean rickettsial load was quantified at 12 h (left), 3 days (middle), and 7 days (right) postexposure. Statistical analysis consisted of a one-way ANOVA followed by Tukey's post hoc analysis, with a P value of <0.05 considered significant (denoted by an asterisk). Error bars represent the SEM. The mean is represented by the bar between the SEM. NS indicates nonsignificant data sets compared to wild-type data. Data are representative of two replicates per experiment and two independent experiments.

References

    1. Harris EK, Verhoeve VI, Banajee KH, Macaluso JA, Azad AF, Macaluso KR. 2017. Comparative vertical transmission of Rickettsia by Dermacentor variabilis and Amblyomma maculatum. Ticks Tick Borne Dis 8:598–604. doi:10.1016/j.ttbdis.2017.04.003. - DOI - PMC - PubMed
    1. Paddock CD, Finley RW, Wright CS, Robinson HN, Schrodt BJ, Lane CC, Ekenna O, Blass MA, Tamminga CL, Ohl CA, McLellan SL, Goddard J, Holman RC, Openshaw JJ, Sumner JW, Zaki SR, Eremeeva ME. 2008. Rickettsia parkeri rickettsiosis and its clinical distinction from Rocky Mountain spotted fever. Clin Infect Dis 47:1188–1196. doi:10.1086/592254. - DOI - PubMed
    1. Lin L, Decker CF. 2012. Rocky Mountain spotted fever. Dis Mon 58:361–369. doi:10.1016/j.disamonth.2012.03.008. - DOI - PubMed
    1. Drexler NA, Dahlgren FS, Heitman KN, Massung RF, Paddock CD, Behravesh CB. 2016. National surveillance of spotted fever group rickettsioses in the United States, 2008-2012. Am J Trop Med Hyg 94:26–34. doi:10.4269/ajtmh.15-0472. - DOI - PMC - PubMed
    1. Paddock CD. 2009. The science and fiction of emerging rickettsioses. Ann N Y Acad Sci 1166:133–143. doi:10.1111/j.1749-6632.2009.04529.x. - DOI - PubMed

Publication types

LinkOut - more resources