

Global increase and geographic convergence in antibiotic consumption between 2000 and 2015
- PMID: 29581252
- PMCID: PMC5899442
- DOI: 10.1073/pnas.1717295115
Global increase and geographic convergence in antibiotic consumption between 2000 and 2015
Abstract
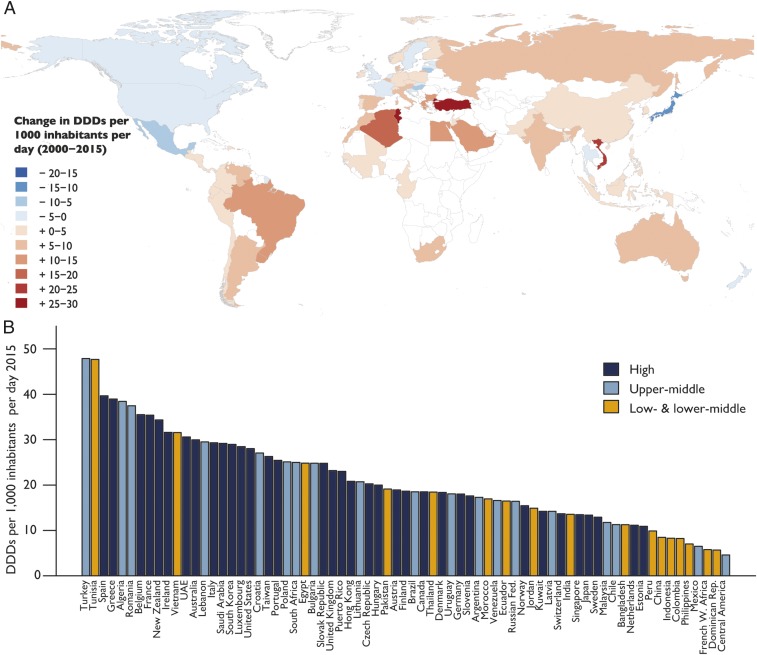
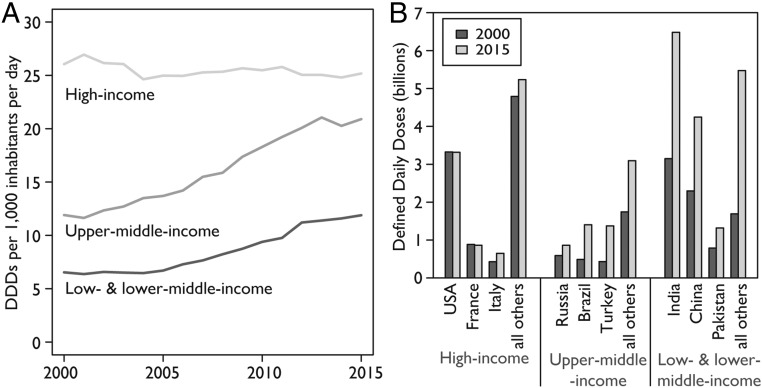
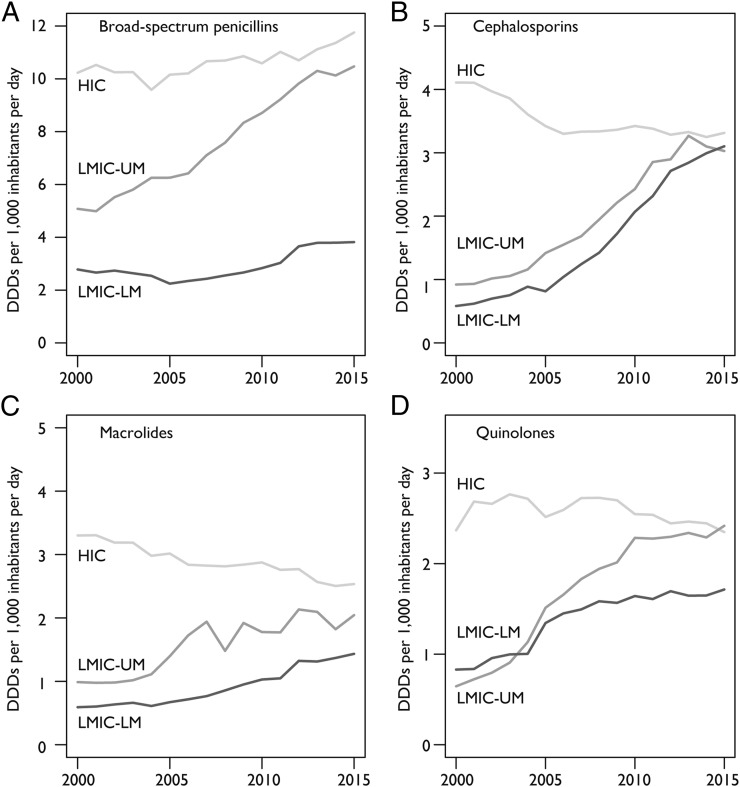
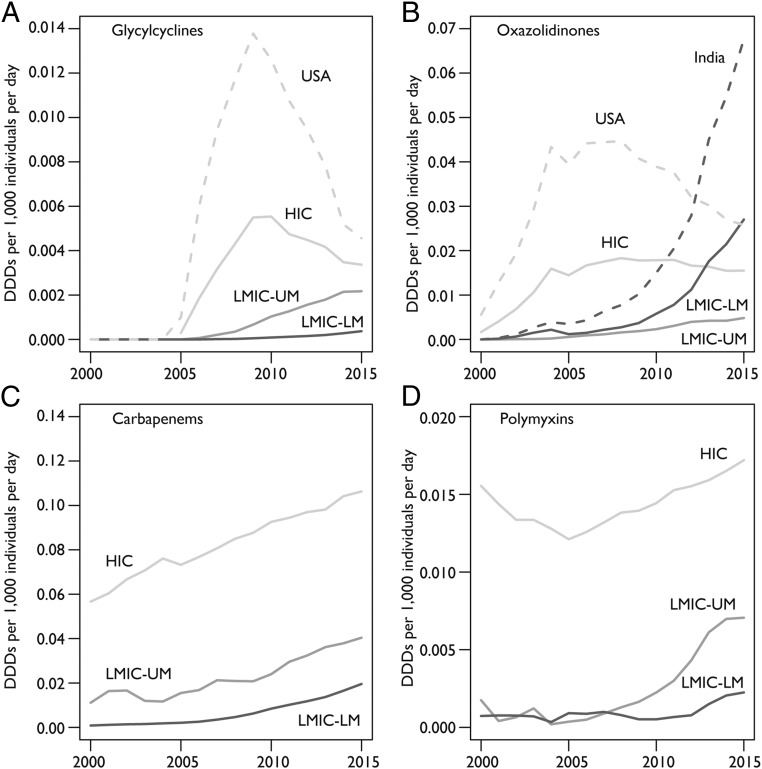
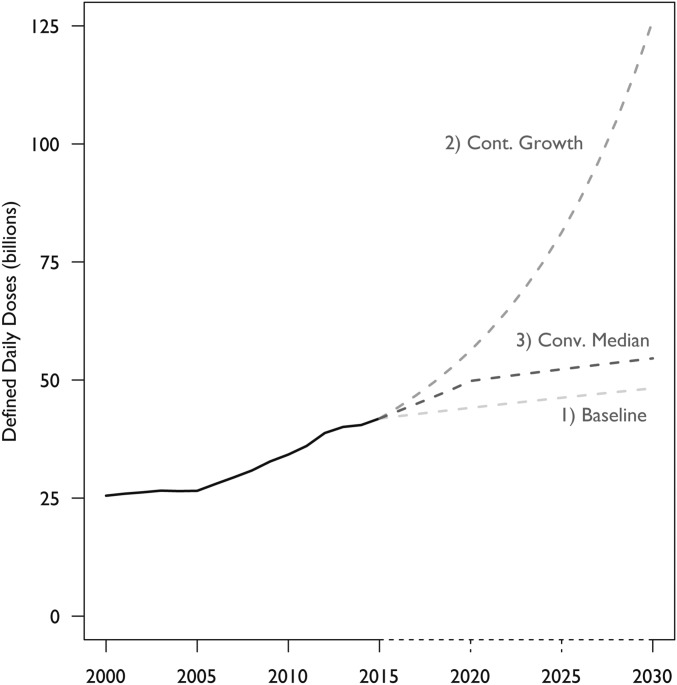
Tracking antibiotic consumption patterns over time and across countries could inform policies to optimize antibiotic prescribing and minimize antibiotic resistance, such as setting and enforcing per capita consumption targets or aiding investments in alternatives to antibiotics. In this study, we analyzed the trends and drivers of antibiotic consumption from 2000 to 2015 in 76 countries and projected total global antibiotic consumption through 2030. Between 2000 and 2015, antibiotic consumption, expressed in defined daily doses (DDD), increased 65% (21.1-34.8 billion DDDs), and the antibiotic consumption rate increased 39% (11.3-15.7 DDDs per 1,000 inhabitants per day). The increase was driven by low- and middle-income countries (LMICs), where rising consumption was correlated with gross domestic product per capita (GDPPC) growth (P = 0.004). In high-income countries (HICs), although overall consumption increased modestly, DDDs per 1,000 inhabitants per day fell 4%, and there was no correlation with GDPPC. Of particular concern was the rapid increase in the use of last-resort compounds, both in HICs and LMICs, such as glycylcyclines, oxazolidinones, carbapenems, and polymyxins. Projections of global antibiotic consumption in 2030, assuming no policy changes, were up to 200% higher than the 42 billion DDDs estimated in 2015. Although antibiotic consumption rates in most LMICs remain lower than in HICs despite higher bacterial disease burden, consumption in LMICs is rapidly converging to rates similar to HICs. Reducing global consumption is critical for reducing the threat of antibiotic resistance, but reduction efforts must balance access limitations in LMICs and take account of local and global resistance patterns.
Keywords: antibiotic stewardship; antibiotics; antimicrobial resistance; defined daily doses; low-income countries.
Copyright © 2018 the Author(s). Published by PNAS.
Conflict of interest statement
The authors declare no conflict of interest.
Figures
Comment in
-
Reply to Abat et al.: Improved policies necessary to ensure an effective future for antibiotics.Proc Natl Acad Sci U S A. 2018 Aug 28;115(35):E8111-E8112. doi: 10.1073/pnas.1811245115. Epub 2018 Aug 7. Proc Natl Acad Sci U S A. 2018. PMID: 30087188 Free PMC article. No abstract available.
-
Benefits of antibiotics burden in low-income countries.Proc Natl Acad Sci U S A. 2018 Aug 28;115(35):E8109-E8110. doi: 10.1073/pnas.1809354115. Epub 2018 Aug 7. Proc Natl Acad Sci U S A. 2018. PMID: 30087189 Free PMC article. No abstract available.
-
Reply to Charra et al.: Global longitudinal assessment of 2019 changes in defined daily doses.Proc Natl Acad Sci U S A. 2018 Dec 4;115(49):E11433-E11435. doi: 10.1073/pnas.1817182115. Epub 2018 Nov 13. Proc Natl Acad Sci U S A. 2018. PMID: 30425175 Free PMC article. No abstract available.
-
Penicillins' defined daily doses must be changed.Proc Natl Acad Sci U S A. 2018 Dec 4;115(49):E11432. doi: 10.1073/pnas.1816558115. Epub 2018 Nov 13. Proc Natl Acad Sci U S A. 2018. PMID: 30425176 Free PMC article. No abstract available.
-
Antibiotic consumption may be linked to exaggeration of COVID-19.Med Hypotheses. 2020 Oct;143:109913. doi: 10.1016/j.mehy.2020.109913. Epub 2020 May 30. Med Hypotheses. 2020. PMID: 32505911 Free PMC article. No abstract available.
References
-
- Laxminarayan R, et al. Access to effective antimicrobials: A worldwide challenge. Lancet. 2016;387:168–175. - PubMed
-
- Laxminarayan R, et al. Antibiotic resistance: The need for global solutions. Lancet Infect Dis. 2013;13:1057–1098. - PubMed
-
- Malhotra-Kumar S, Lammens C, Coenen S, Van Herck K, Goossens H. Effect of azithromycin and clarithromycin therapy on pharyngeal carriage of macrolide-resistant streptococci in healthy volunteers: A randomised, double-blind, placebo-controlled study. Lancet. 2007;369:482–490. - PubMed
-
- Fridkin SK, et al. Intensive Care Antimicrobial Resistance Epidemiology (ICARE) Project and the National Nosocomial Infections Surveillance (NNIS) System Hospitals The effect of vancomycin and third-generation cephalosporins on prevalence of vancomycin-resistant enterococci in 126 U.S. adult intensive care units. Ann Intern Med. 2001;135:175–183. - PubMed
Publication types
MeSH terms
Substances
LinkOut - more resources
Full Text Sources
Other Literature Sources
Medical
Research Materials
