. 2018 Apr 10;115(15):3930-3935.
doi: 10.1073/pnas.1717190115. Epub 2018 Mar 26.

PUMA amplifies necroptosis signaling by activating cytosolic DNA sensors

Affiliations

PUMA amplifies necroptosis signaling by activating cytosolic DNA sensors

Dongshi Chen et al. Proc Natl Acad Sci U S A. .

Abstract

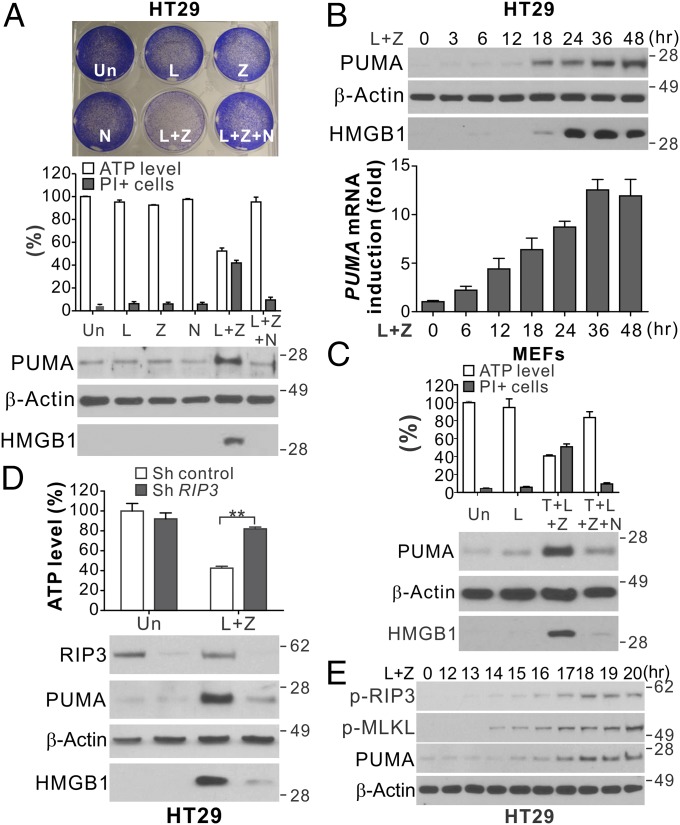
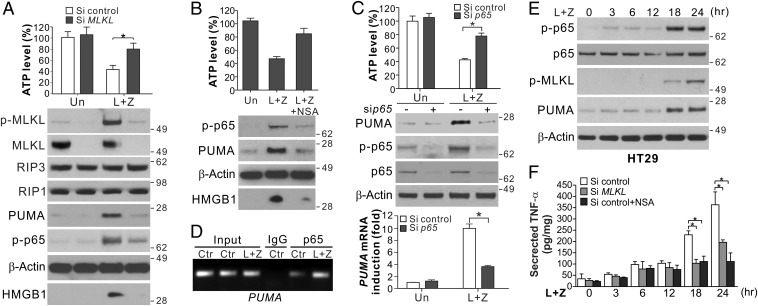
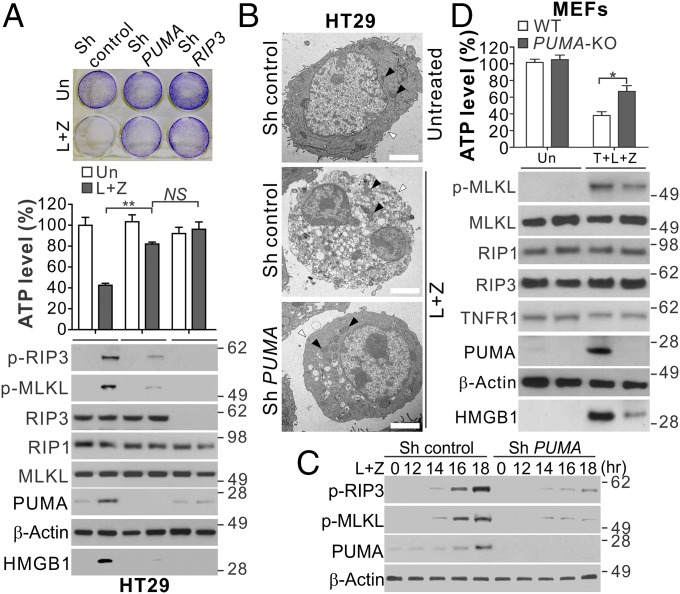
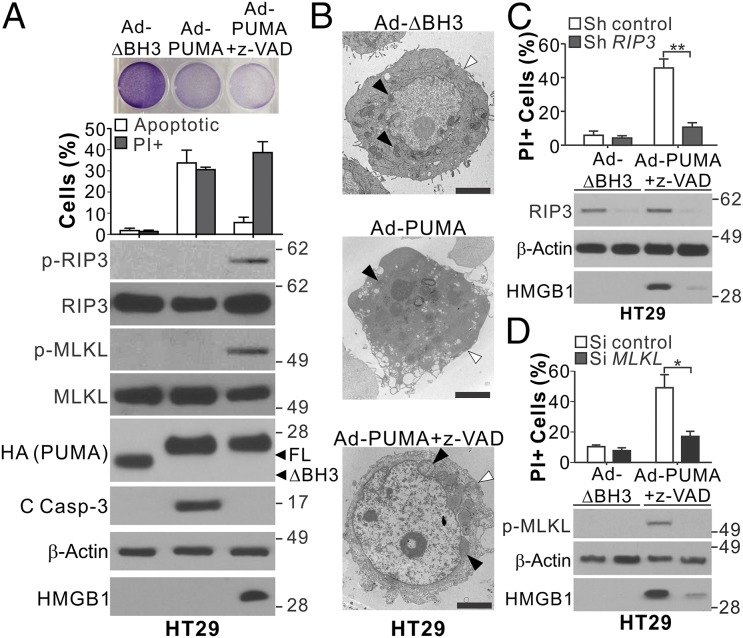
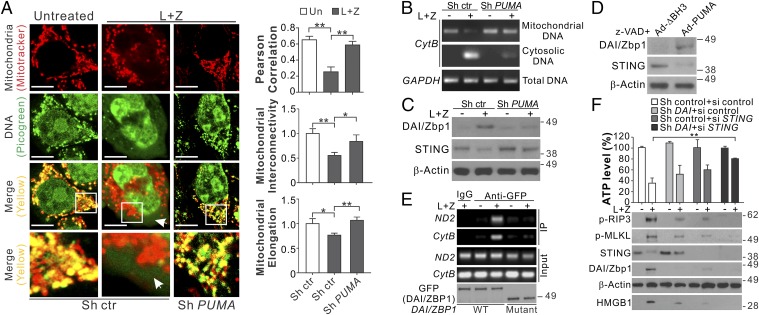
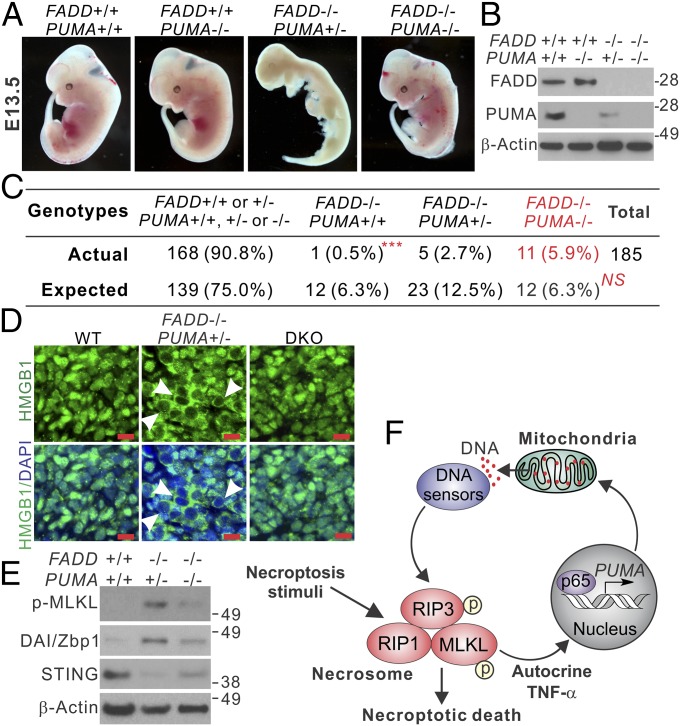
Necroptosis, a form of regulated necrotic cell death, is governed by RIP1/RIP3-mediated activation of MLKL. However, the signaling process leading to necroptotic death remains to be elucidated. In this study, we found that PUMA, a proapoptotic BH3-only Bcl-2 family member, is transcriptionally activated in an RIP3/MLKL-dependent manner following induction of necroptosis. The induction of PUMA, which is mediated by autocrine TNF-α and enhanced NF-κB activity, contributes to necroptotic death in RIP3-expressing cells with caspases inhibited. On induction, PUMA promotes the cytosolic release of mitochondrial DNA and activation of the DNA sensors DAI/Zbp1 and STING, leading to enhanced RIP3 and MLKL phosphorylation in a positive feedback loop. Furthermore, deletion of PUMA partially rescues necroptosis-mediated developmental defects in FADD-deficient embryos. Collectively, our results reveal a signal amplification mechanism mediated by PUMA and cytosolic DNA sensors that is involved in TNF-driven necroptotic death in vitro and in vivo.

Keywords: MLKL; NF-κB; PUMA; RIP3; necroptosis.


Conflict of interest statement

The authors declare no conflict of interest.

Figures

Fig. 1.
Fig. 1.
PUMA is induced in RIP1/RIP3-dependent necroptosis. (A) HT29 colon cancer cells were treated with the control DMSO (Un), LBW242 (L; 2 μM), z-VAD (Z; 10 μM), Necrostatin-1 (N; 20 μM), or the indicated combinations. (Upper) Crystal violet staining at 48 h. (Middle) ATP levels and PI staining at 48 h. (Lower) Western blots of PUMA in cell lysates and HMGB1 in 20 μL of cell culture medium at 24 h. (B) HT29 cells were treated with LBW242 and z-VAD (L+Z) as in A. (Upper) PUMA expression and HMGB1 release. (Lower) PUMA mRNA expression. (C) MEFs were treated with LBW242 (L; 2 μM), alone or in combination with TNF-α (T; 20 ng/mL), z-VAD (Z; 10 μM), or Necrostatin-1 (N; 20 μM). ATP levels and PI staining (Upper) and PUMA expression and HMGB1 release (Lower) were analyzed as in A. (D) HT29 cells stably expressing control or RIP3 shRNA were treated and analyzed as in A. (E) Western blots of phospho-RIP3 (p-RIP3; S227), phospho-MLKL (p-MLKL; S358), and PUMA in HT29 cells treated with L+Z at the indicated time points. Values in AD are expressed as mean ± SD. n = 3. **P < 0.01.
Fig. 2.
Fig. 2.
Induction of PUMA is mediated by NF-κB downstream of MLKL. (A) HT29 cells transfected with control scrambled or MLKL siRNA were treated with L+Z. (Upper) ATP levels at 48 h. (Lower) Protein expression and HMGB1 release at 24 h. (B) HT29 cells with or without pretreatment with NSA (1 μM) were treated and analyzed as in A. (C) HT29 cells transfected with control scrambled or p65 siRNA were treated with L+Z as in A. ATP levels at 24 h (Upper), indicated proteins at 48 h (Middle), and PUMA mRNA expression at 24 h (Lower) were analyzed. (D) Chromatin immunoprecipitation (ChIP) analysis of the binding of p65 to the PUMA promoter in HT29 cells treated as in A for 24 h. (E) Western blots of total and phospho-p65 (p-p65; S536) at indicated time points in HT29 cells treated as in A. (F) TNF-α secretion at indicated time points in HT29 cells treated as in A. Values in AC and F are expressed as mean ± SD. n = 3. *P < 0.05.
Fig. 3.
Fig. 3.
PUMA induction contributes to necroptosis and enhanced RIP3 and MLKL phosphorylation in RIP3-expressing cells with caspase inhibition. (A) HT29 cells expressing control, PUMA, or RIP3 shRNA were treated with L+Z. (Upper) Crystal violet staining at 48 h. (Middle) ATP levels at 48 h. (Lower) Western blots of indicated proteins and HMGB1 release at 24 h. (B) Representative TEM pictures of HT29 cells treated as in A for 24 h. Black arrowheads indicate mitochondria, and white arrowheads indicate plasma membranes. (Scale bars: 2 μm.) (C) Western blots of indicated proteins in HT29 cells transfected with control or PUMA shRNA treated with L+Z. (D) WT and PUMA KO MEFs were treated with 20 ng/mL TNF-α, 2 μM LBW242, and 10 μM z-VAD (T+L+Z) and analyzed as in A. Values in A and D are expressed as mean ± SD. n = 3. NS, P > 0.05; *P < 0.05; **P < 0.01.
Fig. 4.
Fig. 4.
PUMA expression alone can induce necroptosis and RIP3 and MLKL phosphorylation in RIP3-expressing cells with caspase inhibition. (A) HT29 cells with or without pretreatment with 10 μM z-VAD were infected with control (BH3 domain deleted; ΔBH3) or PUMA-expressing adenovirus (Ad-PUMA). (Upper) Crystal violet staining at 24 h. (Middle) analysis of apoptosis and PI staining at 48 h. (Lower) Western blots of indicated proteins and HMGB1 release at 24 h. (B) Representative TEM pictures of HT29 cells treated as in A for 24 h. Black arrowheads indicate mitochondria, and white arrowheads indicate plasma membranes. (Scale bars: 2 μm.) (C) HT29 cells stably transfected with control or RIP3 shRNA were treated and analyzed as in A. (D) HT29 cells transfected with control scrambled or MLKL siRNA were treated and analyzed as in A. Values in A, C, and D are expressed as mean ± SD. n = 3. *P < 0.05; **P < 0.01.
Fig. 5.
Fig. 5.
PUMA promotes mitochondrial DNA release and activates DNA sensors to enhance RIP3/MLKL activation in necroptosis. (A) HT29 cells stably expressing control or PUMA shRNA were treated with L+Z for 24 h. Cells were analyzed by confocal microscopy after mitochondria staining with MitoTracker (red) and DNA staining with PicoGreen (green). (Left) Representative pictures with the arrow indicating cytoplasmic DNA. (Scale bars: 5 μm.) (Right) Quantification of colocalization of MitoTracker and PicoGreen staining and mitochondrial interconnectivity and elongation by Image J software in at least 20 randomly selected individual cells. (B) Mitochondrial and cytosolic fractions isolated from an equal number of HT29 cells treated as in A were analyzed by genomic PCR for CytB. (C) Western blots of DAI/Zbp1 and STING in HT29 cells treated as in A. (D) Western blots of DAI/Zbp1 and STING in HT29 cells infected with control (Ad-ΔBH3) or PUMA-expressing adenovirus (Ad-PUMA) and treated with 10 μM z-VAD for 24 h. (E) HT29 cells transfected with GFP-tagged full-length DAI/Zbp1 (WT) or a deletion mutant of its N-terminal DNA binding domain (mutant) were treated with L+Z as in A. Transfected DAI/Zbp1 was examined by Western blot analysis (Lower) and pulled down by IP with anti-GFP antibody, followed by PCR analysis of mitochondrial CytB and ND2 DNA. (F) HT29 cells stably expressing control or DAI/Zbp1 shRNA were transfected with control scrambled or STING siRNA and then treated as in A. (Upper) ATP levels at 48 h. (Lower) Western blots of indicated proteins and HMGB1 release at 24 h. Values in F are expressed as mean ± SD. n = 3. *P < 0.05; **P < 0.01.
Fig. 6.
Fig. 6.
PUMA deficiency rescues defective embryonic development and suppresses necroptosis in FADD KO embryos. (A) Representative pictures of mouse embryos with indicated FADD and PUMA genotypes at 13.5 d (E13.5). (B) Western blots of FADD and PUMA in E13.5 embryos with the indicated genotypes. (C) Expected and observed numbers of embryos with the indicated FADD and PUMA genotypes from 185 dissected E13.5 embryos. ***P < 0.001, FADD−/−/PUMA/ vs. FADD−/−/PUMA+/+; NS, P = 0.5252, FADD−/−/PUMA/ vs. the expected ratio of Mendelian inheritance (χ2 test). (D) HMGB1 staining of fibroblast tissues from E13.5 embryos with the indicated genotypes. Arrowheads indicate cells with cytoplasmic HMGB1 staining and hollow nuclei. (Scale bars: 10 μm.) (E) Western blots of indicated proteins in E13.5 embryos with the indicated genotypes. (F) Model depicting the role of PUMA in necroptosis.

References

    1. Ofengeim D, Yuan J. Regulation of RIP1 kinase signalling at the crossroads of inflammation and cell death. Nat Rev Mol Cell Biol. 2013;14:727–736. - PubMed
    1. Pasparakis M, Vandenabeele P. Necroptosis and its role in inflammation. Nature. 2015;517:311–320. - PubMed
    1. Linkermann A, Green DR. Necroptosis. N Engl J Med. 2014;370:455–465. - PMC - PubMed
    1. Sun L, Wang X. A new kind of cell suicide: Mechanisms and functions of programmed necrosis. Trends Biochem Sci. 2014;39:587–593. - PubMed
    1. He S, et al. Receptor interacting protein kinase-3 determines cellular necrotic response to TNF-alpha. Cell. 2009;137:1100–1111. - PubMed

Publication types

MeSH terms

Substances