. 2018 Apr 10;115(15):E3509-E3518.
doi: 10.1073/pnas.1802691115. Epub 2018 Mar 26.

Inhibition of Enhancer of zeste homolog 2 (EZH2) induces natural killer cell-mediated eradication of hepatocellular carcinoma cells

Affiliations

Inhibition of Enhancer of zeste homolog 2 (EZH2) induces natural killer cell-mediated eradication of hepatocellular carcinoma cells

Suresh Bugide et al. Proc Natl Acad Sci U S A. .

Abstract

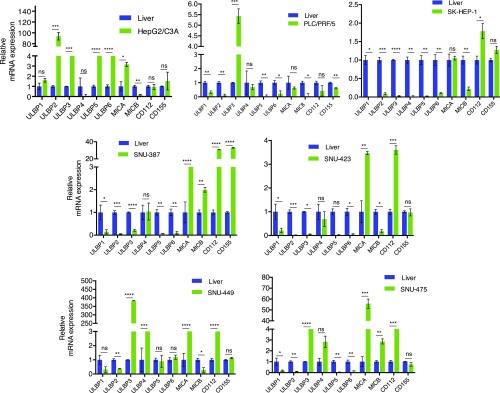
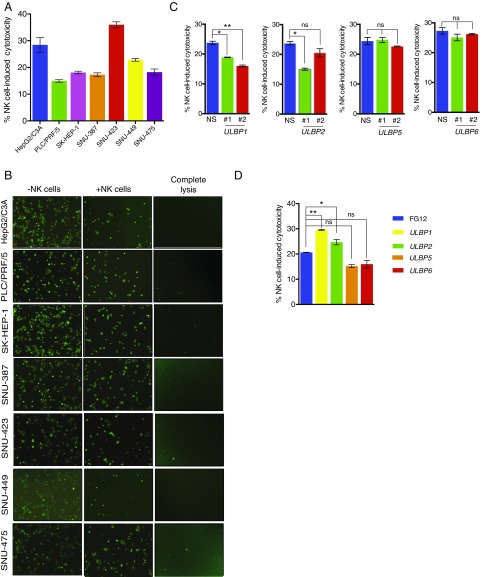
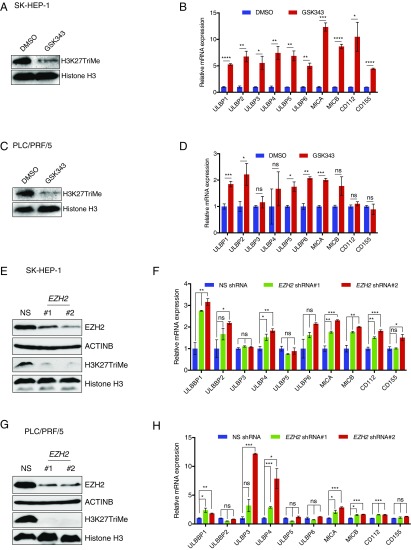
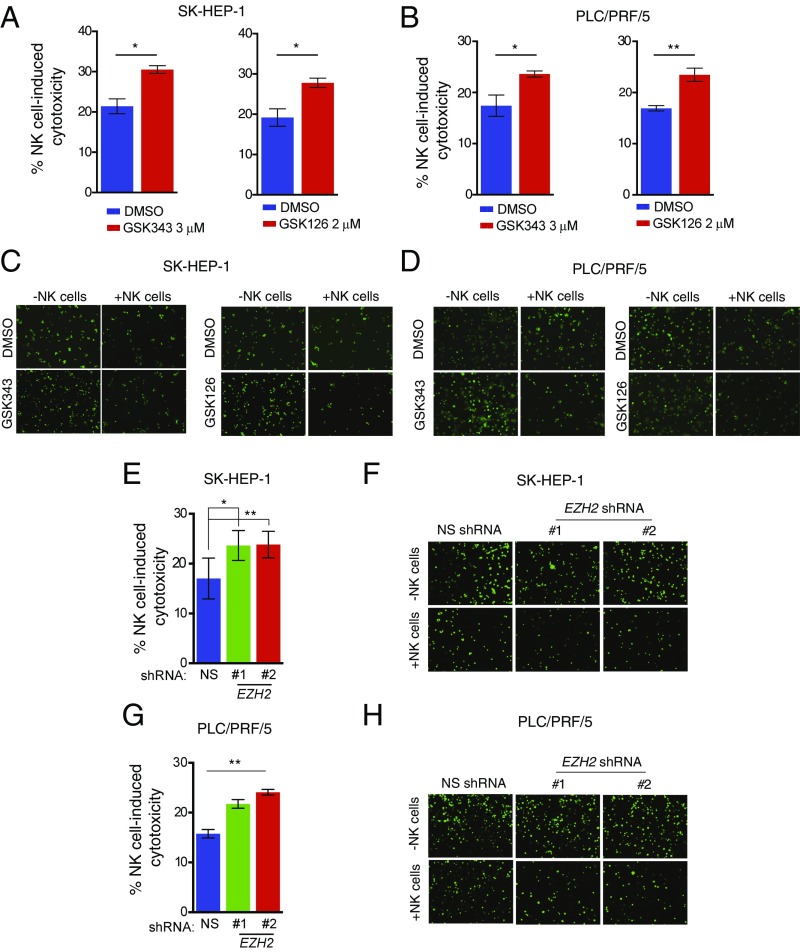
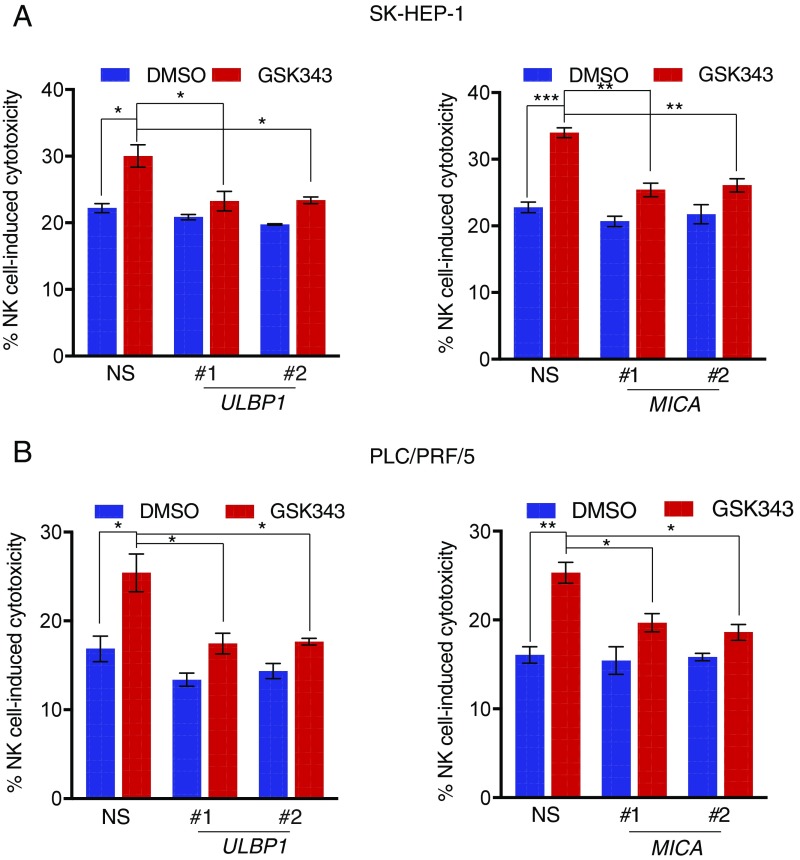
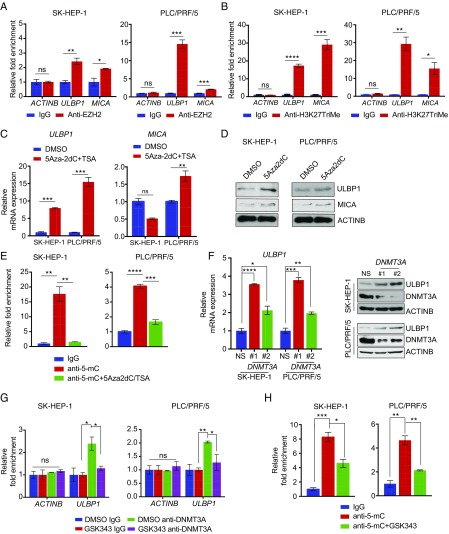
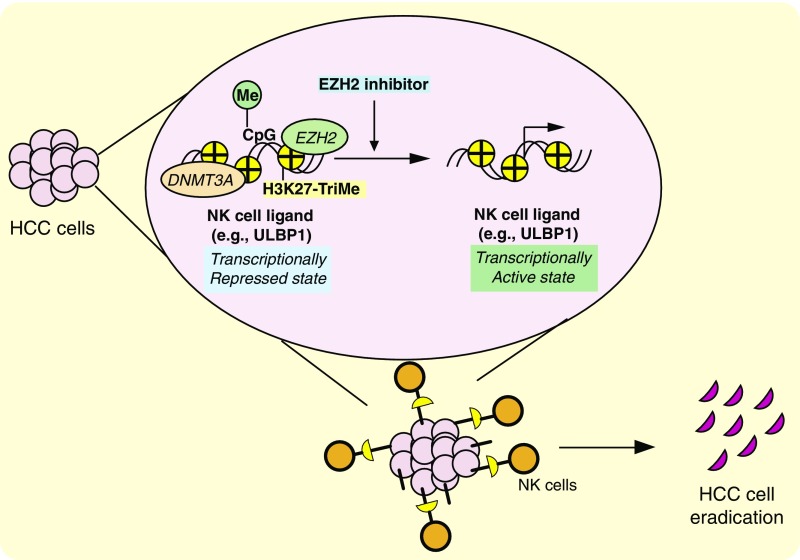
Natural killer (NK) cell-mediated tumor cell eradication could inhibit tumor initiation and progression. However, the factors that regulate NK cell-mediated cancer cell eradication remain unclear. We determined that hepatocellular carcinoma (HCC) cells exhibit transcriptional down-regulation of NK group 2D (NKG2D) ligands and are largely resistant to NK cell-mediated eradication. Because the down-regulation of NKG2D ligands occurred at the transcriptional level, we tested 32 chemical inhibitors of epigenetic regulators for their ability to re-express NKG2D ligands and enhance HCC cell eradication by NK cells and found that Enhancer of zeste homolog 2 (EZH2) was a transcriptional repressor of NKG2D ligands. The inhibition of EZH2 by small-molecule inhibitors or genetic means enhanced HCC cell eradication by NK cells in a NKG2D ligand-dependent manner. Collectively, these results demonstrate that EZH2 inhibition enhances HCC eradication by NK cells and that EZH2 functions, in part, as an oncogene by inhibiting immune response.

Keywords: DNMT3A; EZH2; HCC; NK cell ligands; NK cells.


Conflict of interest statement

The authors declare no conflict of interest.

Figures

Fig. 1.
Fig. 1.
HCC cell lines exhibit widespread down-regulation of the NKG2D ligands. The expression of NK cell ligands was analyzed in human HCC cell lines and normal liver samples using RT-qPCR. mRNA expression for indicated genes relative to normal liver mRNA in indicated HCC cell lines is shown. Data are presented as mean ± SEM; ns, not significant; *P < 0.05; **P < 0.01; ***P < 0.001; and ****P < 0.0001.
Fig. 2.
Fig. 2.
NK cells exhibit differences in the ability to eradicate HCC. (A) HCC cell lines were incubated with NK cells in a 96-well plate at a 20:1 NK cell:cancer cell ratio. After incubating for 2 h, the supernatants were collected and LDH activity was measured. The percentage (%) of NK cell-induced cytotoxicity was calculated and plotted. (B) The cells were stained with Calcein AM and seeded with NK cells in 96-well plates at a 10:1 NK cell:cancer cell ratio. After incubation for 4 h, fluorescent images were captured using an inverted microscope. Images of indicated HCC cell lines showing loss of fluorescent cells (live cells) are presented. Calcein AM-stained cancer cells without NK cells served as the control. (C) HepG2 cells expressing shRNAs against ULBP1, -2, -5, or -6 and control nonspecific shRNAs were analyzed for NK cell cytotoxicity using an LDH activity cytotoxicity assay. The percentage (%) of NK cell-induced cytotoxicity in HepG2 cells was calculated and plotted for the indicated shRNAs. (D) ULBP1, -2, -5 or -6 ligands were ectopically expressed in SK-HEP-1 cells and analyzed for NK cell-mediated cytotoxicity using an LDH activity-based cytotoxicity assay. FG12 vector-transfected cells served as the negative control. The percentage (%) of NK cell-induced cytotoxicity in SK-HEP-1 cells was calculated and plotted for the indicated vector or ligand. Data are presented as mean ± SEM; ns, not significant; *P < 0.05; and **P < 0.01.
Fig. 3.
Fig. 3.
Pharmacological and genetic inhibition of EZH2 results in the up-regulation of NK cell ligands on HCC cells. (A) SK-HEP-1 cells were treated with DMSO or the EZH2 inhibitor GSK343 (3 μM) for 48 h. Immunoblotting for the EZH2-mediated H3K27TriMe mark was performed using DMSO or GSK343-treated cells. Histone H3 was used as a loading control. (B) SK-HEP-1 cells were treated with DMSO or the EZH2 inhibitor GSK343 (3 μM) for 48 h. NK cell ligand mRNA expression in GSK343-treated cells relative to DMSO-treated cells is shown. (C) PLC/PRF/5 cells were treated with DMSO or the EZH2 inhibitor GSK343 (3 μM) for 48 h. Immunoblotting for the EZH2-mediated H3K27TriMe mark was performed using DMSO- or GSK343-treated cells. Histone H3 was used as a loading control. (D) PLC/PRF/5 cells were treated with DMSO or the EZH2 inhibitor GSK343 (3 μM) for 48 h. NK cell ligand mRNA expression in GSK343-treated cells relative to DMSO-treated cells is shown. (E) SK-HEP-1 cells expressing either a nonsilencing (NS) shRNA or EZH2 shRNAs were analyzed for the indicated proteins by immunoblotting. (F) SK-HEP-1 cells expressing either a NS shRNA or EZH2 shRNAs were analyzed for the indicated ligands by RT-qPCR. NK cell ligand mRNA expression is plotted relative to NS shRNA-expressing cells. (G) PLC/PRF/5 cells expressing either a NS shRNA or EZH2 shRNAs were analyzed for the indicated proteins by immunoblotting. (H) PLC/PRF/5 cells expressing either a NS shRNA or EZH2 shRNAs were analyzed for the expression of the indicated ligands by RT-qPCR. NK cell ligand mRNA expression is plotted relative to NS shRNA-expressing cells. Data are presented as mean ± SEM; ns, not significant; *P < 0.05; **P < 0.01; ***P < 0.001; and ****P < 0.0001.
Fig. 4.
Fig. 4.
Pharmacological and genetic inhibition of EZH2 enhances NK cell-mediated cytotoxicity against HCC cells. (A) SK-HEP-1 cells were treated with DMSO or the EZH2 inhibitors GSK343 (3 μM) or GSK126 (2 μM) for 48 h and incubated with NK cells at a ratio of 20:1. The percentage (%) of NK cell-induced cytotoxicity was calculated and plotted. (B) PLC/PRF/5 cells were treated with DMSO or the EZH2 inhibitors GSK343 (3 μM) or GSK126 (2 μM) for 48 h and incubated with NK cells at a ratio of 20:1. The percentage (%) of NK cell-induced cytotoxicity was calculated and plotted. (C) SK-HEP-1 cells were treated with DMSO or the EZH2 inhibitors GSK343 (3 μM) or GSK126 (2 μM) for 48 h, stained with Calcein AM, and incubated with NK cells at a ratio of 10:1. At 4 h post incubation, fluorescent images were captured using an inverted microscope. Images depicting the loss of fluorescent cells (live cells) under the indicated conditions are presented. Calcein AM-stained cancer cells without NK cells served as a negative control. (D) PLC/PRF/5 cells were treated with DMSO or the EZH2 inhibitors GSK343 (3 μM) or GSK126 (2 μM) for 48 h, stained with Calcein AM, and incubated with NK cells at a ratio of 10:1. At 4 h post incubation, fluorescent images were captured using an inverted microscope. Images depicting the loss of fluorescent cells (live cells) under the indicated conditions are presented. Calcein AM-stained cancer cells without NK cells served as the negative control. (E) SK-HEP-1 cells expressing NS or EZH2 shRNAs were analyzed for NK cell-induced cytotoxicity following incubation with NK cells at a ratio of 20:1. The percentage (%) of NK cell-induced cytotoxicity was calculated and plotted. (F) SK-HEP-1 cells expressing NS or EZH2 shRNAs were stained with Calcein AM and incubated with NK cells at a ratio of 10:1. Fluorescent images were captured 4 h post incubation using an inverted microscope. Images depicting the loss of fluorescent cells under the indicated conditions (live cells) are presented. Calcein AM-stained cancer cells without NK cells served as a negative control. (G) PLC/PRF/5 cells expressing NS or EZH2 shRNAs were analyzed for NK cell-induced cytotoxicity by incubation with NK cells at a ratio of 20:1. The percentage (%) of NK cell-induced cytotoxicity was calculated and plotted. (H) PLC/PRF/5 cells expressing NS or EZH2 shRNAs were stained with Calcein AM and incubated with NK cells at a ratio of 10:1. Fluorescent images were captured 4 h post incubation using an inverted microscope. Images depicting the loss of fluorescent cells (live cells) under the indicated conditions are presented. Calcein AM-stained cancer cells without NK cells served as a negative control. Data are presented as mean ± SEM; *P < 0.05 and **P < 0.01.
Fig. 5.
Fig. 5.
ULBP1 and MICA are necessary for EZH2 inhibition-induced enhanced NK cell-mediated HCC cell eradication. (A) SK-HEP-1 cells expressing either NS shRNA, ULBP1 (Left), or MICA (Right) shRNAs were treated with GSK343 (3 μM) for 48 h and analyzed for NK cell-induced cytotoxicity. The percentage (%) of NK cell-induced cytotoxicity is shown. (B) PLC/PRF/5 cells expressing either NS shRNA, ULBP1 (Left), or MICA (Right) shRNAs were treated with GSK343 (3 μM) for 48 h and analyzed for NK cell-induced cytotoxicity. The percentage (%) of NK cell-induced cytotoxicity is shown. Data are presented as mean ± SEM; *P < 0.05; **P < 0.01; and ***P < 0.001.
Fig. 6.
Fig. 6.
ULBP1 is repressed by EZH2 in a DNMT3A-mediated DNA methylation-dependent manner. (A) SK-HEP-1 or PLC/PRF/5 cells were analyzed for EZH2 recruitment on the ULBP1 or MICA promoter by ChIP analysis. The ACTINB promoter was used as a negative control. The ChIP results are shown as fold-change relative to the IgG control. (B) SK-HEP-1 or PLC/PRF/5 cells were analyzed for the H3K27TriMe mark on the ULBP1 or MICA promoter by ChIP analysis. The ACTINB promoter was used as a negative control. The ChIP results are shown as fold-change relative to the IgG control. (C) SK-HEP-1 or PLC/PRF/5 cells were treated with either DMSO or 5Aza2dC (5 μM) and TSA (1 μM) for 72 h. The expression of ULBP1 or MICA mRNA was analyzed by RT-qPCR. ULBP1 or MICA mRNA expression relative to DMSO-treated cells is shown. (D) SK-HEP-1 or PLC/PRF/5 cells were treated with either DMSO or 5Aza2dC (5 μM) and TSA (1 μM) for 72 h. The expression of the indicated proteins was analyzed by immunoblotting. (E) SK-HEP-1 or PLC/PRF/5 cells were treated with either DMSO or 3Aza2DC (5 μM) and TSA (1 μM) for 72 h. The ULBP1 promoter was analyzed for DNA methylation using the MeDIP method. The MeDIP results are shown as the fold-change in DNA methylation relative to IgG in either DMSO or 5Aza2dC+TSA-treated HCC cells. (F) SK-HEP-1 or PLCPRF/5 cells expressing either a NS shRNA or DNMT3A shRNAs were analyzed for ULBP1 mRNA expression (Left) or for the expression of the indicated proteins by immunoblotting (Right). (G) SK-HEP-1 or PLCPRF/5 cells were analyzed for DNMT3A recruitment on the ULBP1 promoter using a ChIP assay. The ACTINB promoter was used as a negative control. Relative fold-change compared with IgG is shown. (H) SK-HEP-1 or PLC/PRF/5 cells were treated with either DMSO or GSK343 (3 μM) for 48 h. The ULBP1 promoter was analyzed for DNA methylation using the MeDIP method. The MeDIP results are shown as fold-change in DNA methylation relative to IgG in either DMSO- or GSK343-treated HCC cells. Data are presented as mean ± SEM; ns, not significant; *P < 0.05; **P < 0.01; ***P < 0.001; and ****P < 0.0001.
Fig. 7.
Fig. 7.
Model of EZH2-mediated regulation of HCC cell eradication. The model indicates that EZH2 represses the expression of NK cell ligands and that the pharmacological inhibition of EZH2 results in the re-expression of NK cell ligands and increases NK cell-mediated cytotoxicity against HCC cells.

References

    1. Llovet JM, et al. Hepatocellular carcinoma. Nat Rev Dis Primers. 2016;2:16018. - PubMed
    1. Cancer Genome Atlas Research Network Comprehensive and integrative genomic characterization of hepatocellular carcinoma. Cell. 2017;169:1327–1341 e23. - PMC - PubMed
    1. Jemal A, et al. Global cancer statistics. CA Cancer J Clin. 2011;61:69–90. - PubMed
    1. Cannon MS, Hostetler JR. The anatomy of the parotoid gland in Bufonidae with some histochemical findings. II. Bufo alvarius. J Morphol. 1976;148:137–160. - PubMed
    1. Sutherland LM, et al. Radiofrequency ablation of liver tumors: a systematic review. Arch Surg. 2006;141:181–190. - PubMed

Publication types

MeSH terms

Substances

LinkOut - more resources