. 2018 Apr 10;115(15):E3388-E3397.
doi: 10.1073/pnas.1722452115. Epub 2018 Mar 26.

S-nitrosylation drives cell senescence and aging in mammals by controlling mitochondrial dynamics and mitophagy

Affiliations

S-nitrosylation drives cell senescence and aging in mammals by controlling mitochondrial dynamics and mitophagy

Salvatore Rizza et al. Proc Natl Acad Sci U S A. .

Abstract

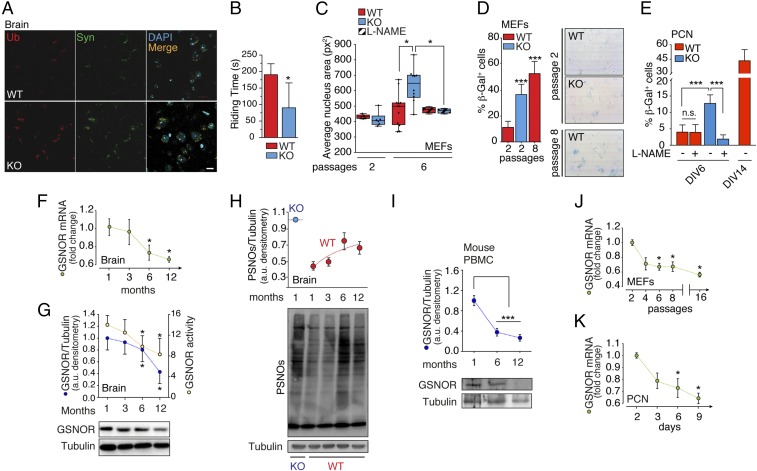
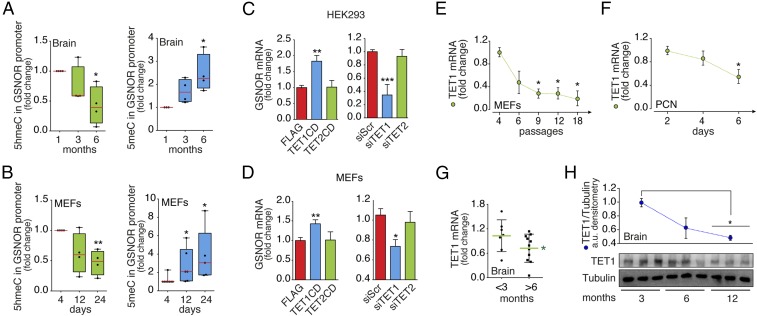
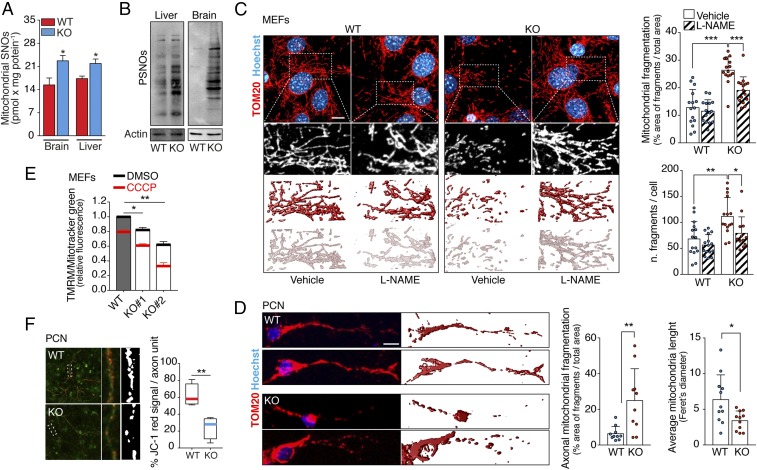
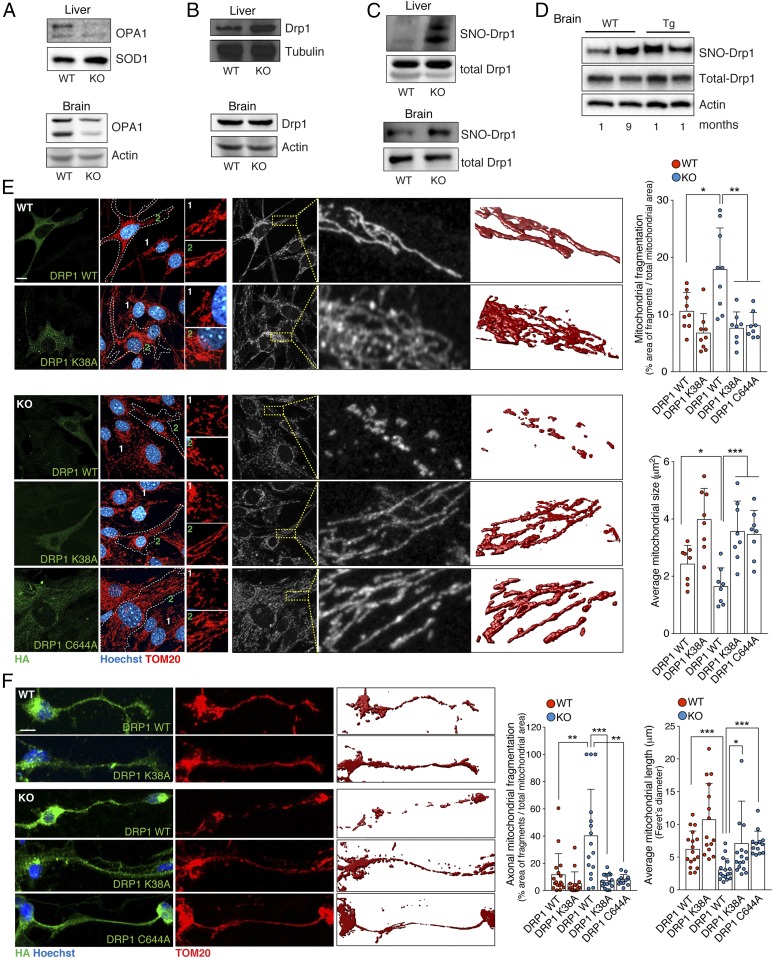
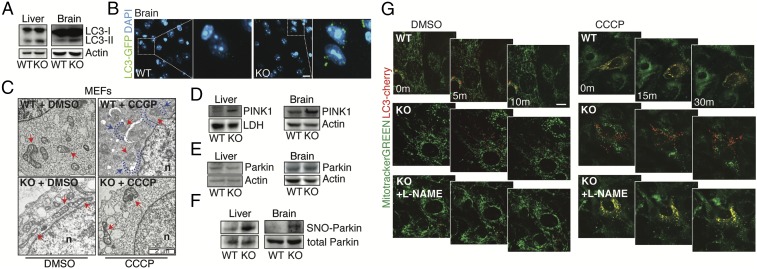
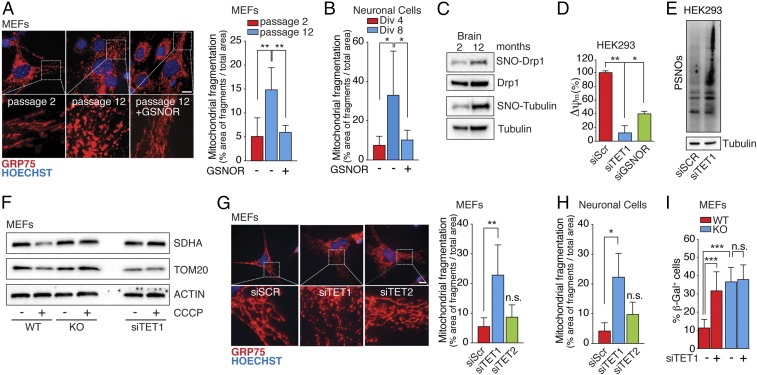
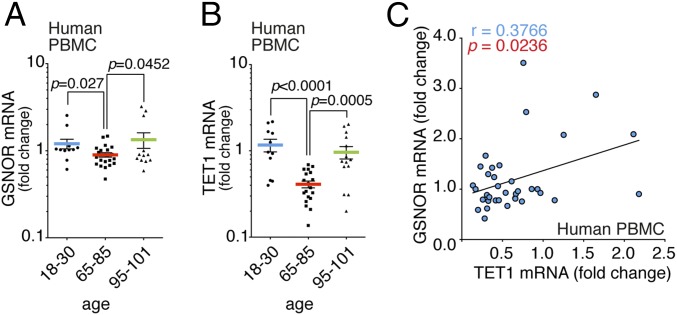
S-nitrosylation, a prototypic redox-based posttranslational modification, is frequently dysregulated in disease. S-nitrosoglutathione reductase (GSNOR) regulates protein S-nitrosylation by functioning as a protein denitrosylase. Deficiency of GSNOR results in tumorigenesis and disrupts cellular homeostasis broadly, including metabolic, cardiovascular, and immune function. Here, we demonstrate that GSNOR expression decreases in primary cells undergoing senescence, as well as in mice and humans during their life span. In stark contrast, exceptionally long-lived individuals maintain GSNOR levels. We also show that GSNOR deficiency promotes mitochondrial nitrosative stress, including excessive S-nitrosylation of Drp1 and Parkin, thereby impairing mitochondrial dynamics and mitophagy. Our findings implicate GSNOR in mammalian longevity, suggest a molecular link between protein S-nitrosylation and mitochondria quality control in aging, and provide a redox-based perspective on aging with direct therapeutic implications.

Keywords: GSNOR; S-nitrosylation; aging; mitochondria; mitophagy.


Conflict of interest statement

Conflict of interest statement: J.S.S. has received a commercial research grant from Novartis and has ownership interest (including patents) in Adamas and Lifehealth.

Figures

Fig. 1.
Fig. 1.
GSNOR decrease is associated with age and cell senescence. (A) Immunofluorescence analyses of brain cortexes from 2-mo-old WT and Gsnor−/− (KO) mice incubated with antiubiquitin (Ub, red) and anti–α-synuclein (Syn, green) antibodies. DAPI was used to stain nuclei. Ub spot count per field = 30.67 ± 4.17 (WT); 62.67 ± 8.67 (KO); average Syn spot count per field = 33.67 ± 6.96 (WT); 64.67 ± 6.96 (KO). Values represent mean ± SEM of n = 3 fields containing ∼35 cells per field. (Scale bar: 10 μm.) (B) Rotarod test. Values are expressed as latency to fall off the rod (riding time) and represent mean ± SEM of 2-mo old WT (n = 5) and KO (n = 5) mice, respectively, analyzed at three different times. *P < 0.05 (Student’s t test). (C) Nuclear size evaluated in WT and KO MEFs after two and six passages in culture in the presence or lack of 500 μM L-NAME added every 48 h. Size is expressed as squared pixels (px2). Values represent mean ± SEM of n ≥ 6 independent experiments. *P < 0.05 (Student’s t test). β-Galactosidase (β-Gal) activity of WT and KO MEFs (D) and PCNs (E) is shown. Values represent mean ± SEM of n = 3 independent experiments performed in duplicate. ***P < 0.001 (Student’s t test). DIV, days in vitro. (F) Real-time PCR analysis of GSNOR expression in brain from WT mice 1 to 12 mo of age. Actin and the ribosomal protein L34 were used as internal standards. Values represent mean ± SEM of n = 5 animals per experimental point analyzed in triplicate. *P < 0.05 (Student’s t test). (G) GSNOR activity and protein levels in brain homogenates from WT mice from 1 to12 mo of age. Results of GSNOR immunoreactive band densitometry (relative to tubulin) and enzymatic activity (expressed as nanomoles of NADH × milligrams of protein−1 × min−1) are shown and represent mean ± SEM of n ≥ 3 animals per experimental point analyzed in duplicate. *P < 0.05 (Student’s t test). (H) Amount of PSNOs in the brain from WT and KO mice from 1 to 12 mo of age. Results of PSNO densitometry (relative to tubulin) are shown. Values represent mean ± SD of n = 3 animals for each experimental point. (I) Western blot analysis of GSNOR in PBMCs from WT mice 1 to 12 mo of age. Results of band densitometry (relative to tubulin) are shown. Values represent mean ± SD of n = 3 animals for each experimental point. ***P < 0.001 (Student’s t test). Real-time PCR analysis of GSNOR expression in MEFs (J) and PCNs (K) is shown. L34 was selected as an internal standard, and values are expressed as fold change relative to cells maintained in culture for two passages (MEFs) or 2 d (PCNs). Values represent mean ± SEM of n = 3 independent experiments performed in triplicate. *P < 0.05 (Student’s t test).
Fig. 2.
Fig. 2.
Age-dependent GSNOR expression is regulated by DNA methylation and controlled by TET1. Real-time PCR analyses of (5hmeC, green) and (5meC, blue) levels in the Gsnor promoter in the mouse brain (A) and MEFs (B) are shown. Values are expressed as fold change relative to 1-mo-old WT brains or MEFs maintained in culture for four passages, and represent mean ± SEM of n ≥ 4 independent experiments performed in quadruplicate. *P < 0.05; **P < 0.01 (Student’s t test). Real-time PCR analyses of GSNOR expression in HEK293 cells (C) and WT MEFs (D) transfected with either catalytic domains or siRNA for TET1 and TET2 are shown. Values represent mean ± SEM of n = 3 independent experiments performed in duplicate. *P < 0.05; **P < 0.01; ***P < 0.001 (Student’s t test). Real-time PCR analyses of TET1 expression in WT MEFs (E) and PCNs (F) maintained in culture for up to 18 passages or 6 d, respectively, as well as in brains obtained from WT mice of different ages, are shown. (G) Values are normalized on actin, and represent mean ± SEM of n = 3 independent experiments (MEFs and PCNs) and n ≥ 6 animals (mouse brain) performed in triplicate. *P < 0.05 (Student’s t test). (H, Bottom) Western blot analysis of TET1 in brain homogenates from WT mice in a range from 3 to 12 mo of age. (H, Top) Results of band densitometry (relative to tubulin) are shown. Values represent mean ± SD of n = 3 animals per age. *P < 0.05 (Student’s t test). CD, catalytic domain.
Fig. 3.
Fig. 3.
GSNOR deficiency results in the accumulation of S-nitrosylated proteins and affects mitochondrial homeostasis. (A) S-nitrosothiols (SNOs) of the mitochondria-enriched fraction of brain and liver obtained from WT and Gsnor−/− (KO) mice at 2 mo of age evaluated by the Seville–Griess assay. (B) PSNO amount in the brain and liver from WT and KO mice at 2 mo of age. Actin was used as a loading control. Three-dimensional reconstruction of the mitochondrial network of WT and KO MEFs (C, Top) and PCNs (D, Top) is revealed by confocal fluorescence microscopy upon incubation with an antibody against the mitochondrial protein TOM20. A total of seven to 11 z-stacks (0.3-μm size) were merged. (C, Bottom and D, Bottom) Three-dimensional rendering of TOM20 signal is shown. Hoechst 33342 dye was used to visualize nuclei. (C) In MEFs, values are expressed as both the percentage area of fragments within the total mitochondrial area and the number of fragments per cell. (Scale bar: 10 μm.) (D) In PCNs, the analysis was performed in the axonal region, and Feret’s diameter is reported as an estimation of average mitochondrial length. (Scale bar: 5 μm.) The data shown represent mean ± SD of at least n ≥ 15 cells per experimental point. *P < 0.05; **P < 0.01; ***P < 0.001 (Student’s t test). (E) Δψm in WT and KO MEFs was evaluated by flow cytometry analysis of tetramethylrhodamine methyl ester (TMRM) fluorescence. CCCP (20 μM) was used as a positive control of mitochondrial depolarization. Values are normalized on the total mitochondrial mass (obtained upon incubation with MitoTracker Green) and expressed as the TMRM fluorescence fold change. Values represent mean ± SD of n = 3 independent experiments performed in triplicate. *P < 0.05; **P < 0.01. (F) Δψm in WT and KO PCNs was evaluated upon JC-1 staining. Values are expressed as a percentage area of red signal (polarized mitochondria) within the green signal area (axon). The red signal was thresholded, and the resulting area is shown in white. Values represent mean ± SD of n ≥ 15 axons counted deriving from three independent experiments. **P < 0.01.
Fig. 4.
Fig. 4.
Gsnor−/− cells exhibit increased fragmentation due to S-nitrosylation of Drp1. Representative Western blots of OPA1 (A) and Drp1 (B) in the brain and liver from 2-mo-old WT and GSNOR-KO mice are shown. Actin, SOD1, or tubulin was used as a loading control. (C) Western blot analysis of SNO-Drp1 performed on a pool of PSNOs obtained from liver and brain lysates of WT and KO mice. As a control, Western blot analyses of total Drp1 were performed on the lysates using the same anti-Drp1 antibody. (D) Western blot analysis of SNO-Drp1 performed on a pool of PSNOs obtained from brain lysates of 1- and 9-mo-old WT mice and 1-mo-old Tg2576 mice. Actin was used as a loading control. Three-dimensional reconstructions of the mitochondrial network of WT and KO MEFs (E) and PCNs (F) are revealed by confocal fluorescence microscopy as described in Fig. 3C. (Scale bars: 5 μm.) Data shown represent mean ± SD of at least n ≥ 8 cells (MEFs) and n ≥ 15 axons (PCNs) per experimental point. *P < 0.05; **P < 0.01; ***P < 0.001 (Student’s t test).
Fig. 5.
Fig. 5.
Gsnor−/− cells show defects in mitophagy linked to S-nitrosylation. (A) Representative Western blot of LC3 in brain and liver homogenates obtained from 2-mo old WT and Gsnor−/− (KO) mice. Actin was used as a loading control. (B, Left) Brain slices (i.e., cerebral cortex) obtained from Lc3+/GFP:Adh5+/+ (2) and Lc3+/GFP:Adh5−/− (KO) mice analyzed by fluorescence microscopy to visualize autophagosomes. DAPI was used to visualize nuclei. (B, Right) Digital magnification is shown. (Scale bar: 10 μm.) (C) Transmission electron microscopy images of WT and KO MEFs treated for 6 h with CCCP or vehicle (DMSO). Nuclei (n) and mitochondria (red arrows) are indicated, along with internal double-membraned structures surrounding mitochondria (phagophores, blue dotted lines and arrows). Representative Western blots of PINK1 (D) and Parkin (E) in brain and liver total extracts obtained from 2-mo old WT and KO mice are shown. LDH or actin was used as a loading control. (F) Western blot analysis of SNO-Parkin performed on PSNOs obtained from liver and brain lysates of WT and KO mice. Western blot analysis of total Parkin is shown as a control. (G) Representative frames captured upon live-imaging fluorescence microscopy (Movies S1–S6) of mitochondrial networks in WT and KO MEFs expressing the fluorescent protein LC3-cherry (red) and stained with MitoTracker Green (green) to visualize autophagosomes and mitochondria, respectively. MEFs were pretreated with 0.5 mM L-NAME (where indicated) or with the vehicle solution for 1 wk with administration every 48 h. CCCP was added before image acquisition to induce mitophagy. m, minute(s). (Scale bar: 10 μm.)
Fig. 6.
Fig. 6.
GSNOR and TET1 manipulation impact on mitochondrial homeostasis, dynamics, and cell senescence. Fluorescence microscopy analyses of mitochondrial networks performed upon incubation with an antibody against Grp75 in WT MEFs maintained in culture for two or 12 passages (A, Top) or in WT neuronal cells after 4 or 8 d in vitro (Div) (B) are shown. Transfection with the WT form of GSNOR (+GSNOR) or an empty vector as a control is shown. Hoechst 33342 dye was used to stain nuclei in blue. (A, Bottom) Digital magnifications are shown. Values are expressed as a percentage area of fragments within the total mitochondrial area. Data shown represent mean ± SD of at least n ≥ 8 cells per experimental point. *P < 0.05; **P < 0.01 (Student’s t test). (Scale bar: 10 μm.) (C) Western blot analysis of SNO-Drp1 performed on a pool of PSNOs obtained from the brain of WT mice aged 2 and 12 mo upon biotin-switch assay. As a control, Western blot analysis of total Drp1 was performed. Tubulin is also shown as an indicator that excessive nitrosylation occurs with age. (D) Δψm in HEK293 cells transfected with siRNA against TET1 or GSNOR. siScr cells were used as a control. Values are expressed as a percentage of siScr cells and represent mean ± SEM of n = 3 independent experiments performed in duplicate. *P < 0.05; **P < 0.01 (Student’s t test). (E) Amounts of PSNOs in siScr and siTET1 HEK293 cells measured by biotin-switch assay. Tubulin was selected as a loading control. (F) Western blot analysis of the mitochondrial proteins SDHA and TOM20 in GSNOR KO and WT MEFs (with or deficient in TET1); CCCP was added for 8 h to induce mitophagy. Actin was selected as a loading control. Fluorescence microscopic images of mitochondrial networks performed in WT MEFs (G, Top) and WT neuronal cells (H) transfected with siRNA against TET1 or TET2 are shown; the antibody is against Grp75, and siScr cells were used as a control. Hoechst 33342 dye was used to stain nuclei in blue. (G, Bottom) Digital magnifications are shown. Values are expressed as a percentage area of fragments within the total mitochondrial area. Data shown represent mean ± SD of at least n ≥ 8 cells per experimental point. n.s., not significant. *P < 0.05; **P < 0.01 (Student’s t test). (Scale bar: 10 μm.) (I) β-Galactosidase (β-Gal) activity of WT and KO MEFs with or without TET1 knockdown. Values represent mean ± SD of n = 3 independent experiments performed in triplicate. ***P < 0.001 (Student’s t test).
Fig. 7.
Fig. 7.
TET1 and GSNOR are hypoexpressed in elderly, but not in exceptionally long-lived, humans. Real-time PCR assays of GSNOR (A) and TET1 expression (B) in PBMCs obtained from humans of different ages, including long-lived individuals (95–101 y of age), are shown. Values are expressed as fold change relative to a young group (18–30 y of age) after normalizing to two different internal standards (actin and L34), and they represent mean ± SEM of n ≥ 12 individuals per experimental point analyzed in triplicate. P values are shown in the graph (Student’s t test). (C) Correlation between the paired mRNA levels of GSNOR and TET1 analyzed by real-time PCR in PBMCs from humans of different ages (as shown in A and B). The linear regression and Pearson correlation coefficient were calculated using GraphPad Prism 6.0 (GraphPad Software, Inc.). R2 = 0.1418, P = 0.0236.

References

    1. Hess DT, Stamler JS. Regulation by S-nitrosylation of protein post-translational modification. J Biol Chem. 2012;287:4411–4418. - PMC - PubMed
    1. Stamler JS, Lamas S, Fang FC. Nitrosylation. The prototypic redox-based signaling mechanism. Cell. 2001;106:675–683. - PubMed
    1. Jaffrey SR, Erdjument-Bromage H, Ferris CD, Tempst P, Snyder SH. Protein S-nitrosylation: A physiological signal for neuronal nitric oxide. Nat Cell Biol. 2001;3:193–197. - PubMed
    1. Iyer AKV, Rojanasakul Y, Azad N. Nitrosothiol signaling and protein nitrosation in cell death. Nitric Oxide. 2014;42:9–18. - PMC - PubMed
    1. Nakamura T, Lipton SA. Redox modulation by S-nitrosylation contributes to protein misfolding, mitochondrial dynamics, and neuronal synaptic damage in neurodegenerative diseases. Cell Death Differ. 2011;18:1478–1486. - PMC - PubMed

Publication types

Substances

LinkOut - more resources