. 2018 May 19;373(1746):20170007.
doi: 10.1098/rstb.2017.0007.

Disentangling social interactions and environmental drivers in multi-individual wildlife tracking data

Affiliations

Disentangling social interactions and environmental drivers in multi-individual wildlife tracking data

Justin M Calabrese et al. Philos Trans R Soc Lond B Biol Sci. .

Abstract

While many animal species exhibit strong conspecific interactions, movement analyses of wildlife tracking datasets still largely focus on single individuals. Multi-individual wildlife tracking studies provide new opportunities to explore how individuals move relative to one another, but such datasets are frequently too sparse for the detailed, acceleration-based analytical methods typically employed in collective motion studies. Here, we address the methodological gap between wildlife tracking data and collective motion by developing a general method for quantifying movement correlation from sparsely sampled data. Unlike most existing techniques for studying the non-independence of individual movements with wildlife tracking data, our approach is derived from an analytically tractable stochastic model of correlated movement. Our approach partitions correlation into a deterministic tendency to move in the same direction termed 'drift correlation' and a stochastic component called 'diffusive correlation'. These components suggest the mechanisms that coordinate movements, with drift correlation indicating external influences, and diffusive correlation pointing to social interactions. We use two case studies to highlight the ability of our approach both to quantify correlated movements in tracking data and to suggest the mechanisms that generate the correlation. First, we use an abrupt change in movement correlation to pinpoint the onset of spring migration in barren-ground caribou. Second, we show how spatial proximity mediates intermittently correlated movements among khulans in the Gobi desert. We conclude by discussing the linkages of our approach to the theory of collective motion.This article is part of the theme issue 'Collective movement ecology'.

Keywords: caribou; correlated diffusion; khulan; movement correlation indices; shared drift; wildlife tracking data.


Conflict of interest statement

We declare we have no competing interests.

Figures

Figure 1.
Figure 1.
(a) A realization of a simulated partitioning experiment for parameter scenario 1 displaying the total correlation index, ηtot, with the dashed line denoting the true ηtot values and true model (via colour). Estimated ηtot values are displayed by points with the colour indicating the selected model for a given partition. Error bars on the ηtot estimates are 95% CIs. (b) A realization of a simulated partitioning experiment from parameter scenario 2. Note that in scenario 1, transitions between partitions correspond with transitions between models, whereas in scenario 2, transitions between partitions are driven by variation in parameter values, with the CC model being constant across all partitions.
Figure 2.
Figure 2.
Classification accuracy of the partitioning algorithm on simulated data as a function of number of individuals, N, across parameter scenarios 1 (a,b) and 2 (c,d), with intact data (a,c) and with 25% of observations randomly missing (b,d). Curves within each panel represent different values of W.
Figure 3.
Figure 3.
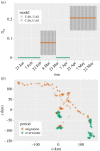
(a) Partitioned MCI analysis with a minimum partition length of W = 25 days for caribou focusing on ηdft. Colours indicate the selected model for each partition of the data, while error bars on the MCI estimates are 95% confidence intervals. Drift correlation jumps abruptly on 14 April 1988 and then remains high thereafter, which is consistent with this date being the onset of spring migration. (b) Caribou tracks with individuals denoted by different symbols and the overwintering period (green) and spring migration (orange) denoted by colour. To eliminate visual clutter, only three of the five individuals are shown, and the period of drift correlation apparent in (a) from late February to late March is not shown in (b).
Figure 4.
Figure 4.
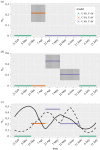
Partitioned MCI analysis with a minimum partition length of W = 25 days for the khulans. (a) Shows the drift correlation index, (b) presents the diffusive correlation index and (c) shows the total correlation index. Colours indicate the selected model for each partition, while error bars on the MCI estimates are 95% confidence intervals. The solid black curve in (c) is the Loess fit to the median pairwise distance between individuals, while the dashed lines is a Loess fit to median daily move distance. Both distance curves are scaled so they can be displayed on the MCI plot. Note that the CIs on the ηtot in (c) are suppressed to prevent visual clutter, but are equivalent to those on each of the components in (a) (ηdft) and (b) (ηdif).

References

    1. Nathan R, et al. 2008. A movement ecology paradigm for unifying organismal movement research. Proc. Natl Acad. Sci. USA 105, 19 052–19 059. (10.1073/pnas.0800375105) - DOI - PMC - PubMed
    1. Schick RS, et al. 2008. Understanding movement data and movement processes: current and emerging directions. Ecol. Lett. 11, 1338–1350. (10.1111/j.1461-0248.2008.01249.x) - DOI - PubMed
    1. Fleming CH, Calabrese JM, Mueller T, Olson KA, Leimgruber P, Fagan WF. 2014. From fine-scale foraging to home ranges: a semi-variance approach to identifying movement modes across spatiotemporal scales. Am. Nat. 183, E154–E167. (10.1086/675504) - DOI - PubMed
    1. Polansky L, Wittemyer G, Cross PC, Tambling CJ, Getz WM. 2010. From moonlight to movement and synchronized randomness: Fourier and wavelet analyses of animal location time series data. Ecology 91, 1506–1518. (10.1890/08-2159.1) - DOI - PMC - PubMed
    1. Katz Y, Tunstrøm K, Ioannou CC, Huepe C, Couzin ID. 2011. Inferring the structure and dynamics of interactions in schooling fish. Proc. Natl Acad. Sci. USA 108, 18 720–18 725. (10.1073/pnas.1107583108) - DOI - PMC - PubMed

Publication types

LinkOut - more resources