. 2018 Mar 26;9(1):1226.
doi: 10.1038/s41467-018-03538-9.

A comprehensive map coupling histone modifications with gene regulation in adult dopaminergic and serotonergic neurons

Affiliations

A comprehensive map coupling histone modifications with gene regulation in adult dopaminergic and serotonergic neurons

Erik Södersten et al. Nat Commun. .

Erratum in

Abstract

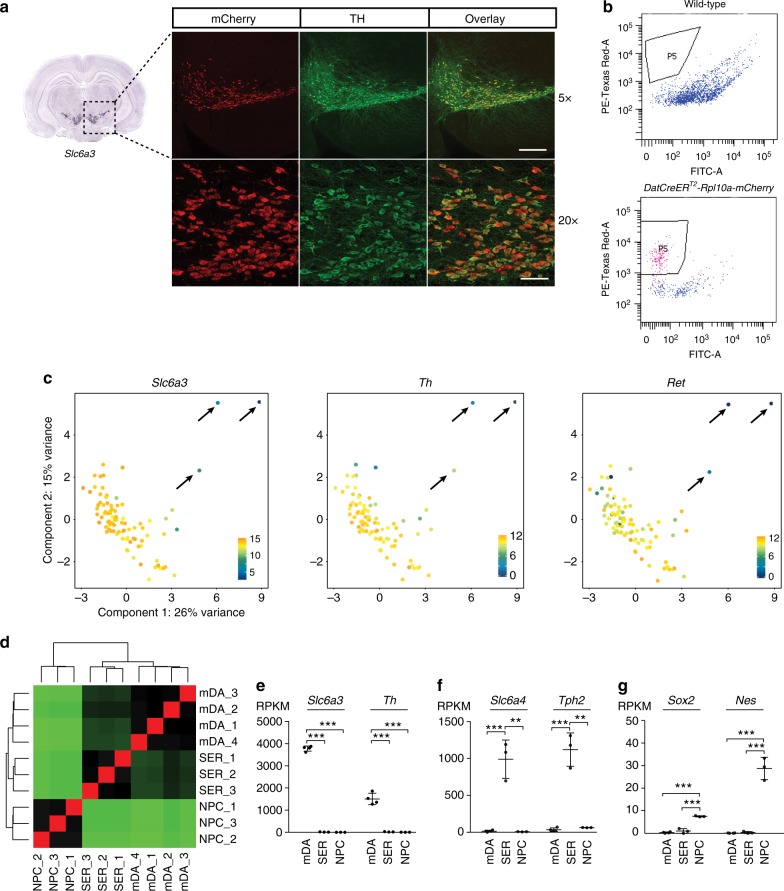
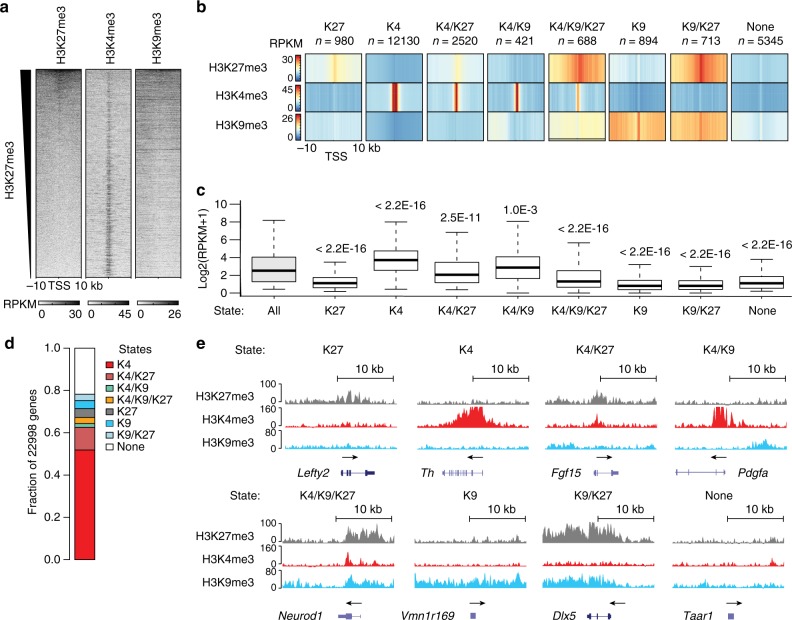
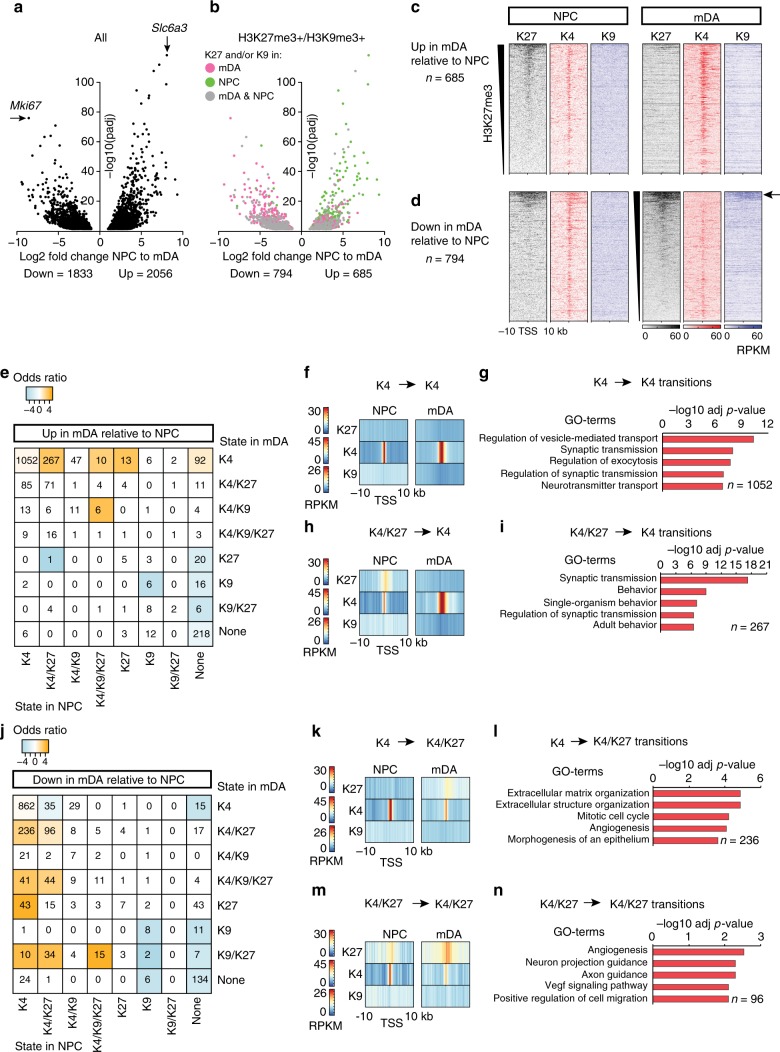
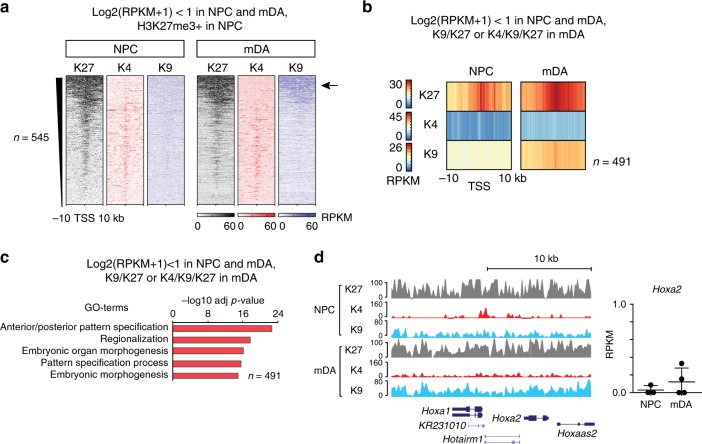
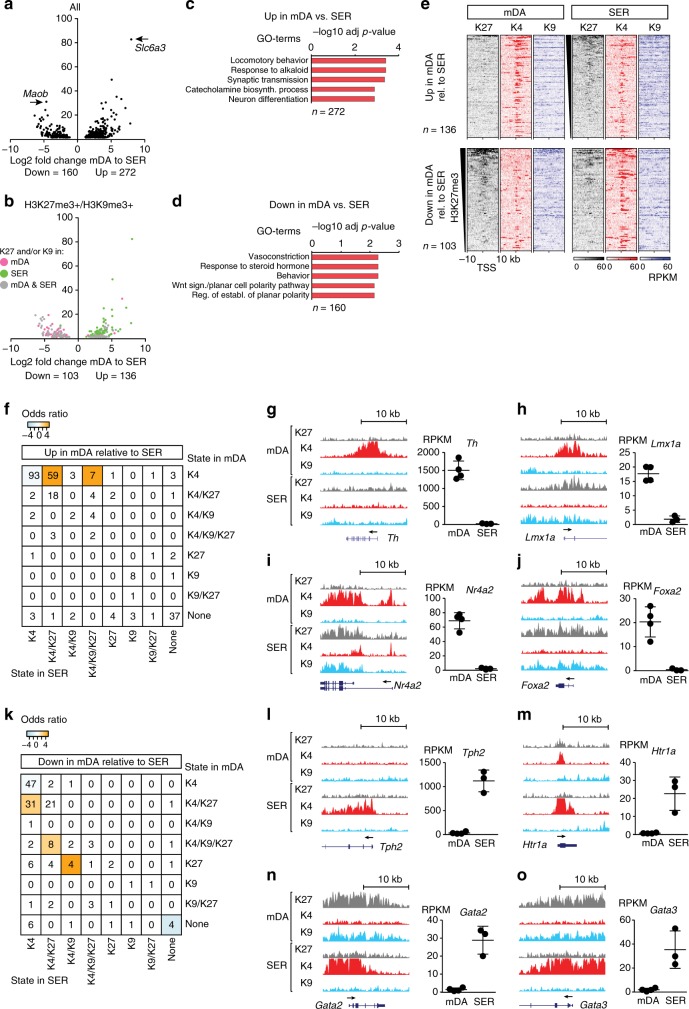
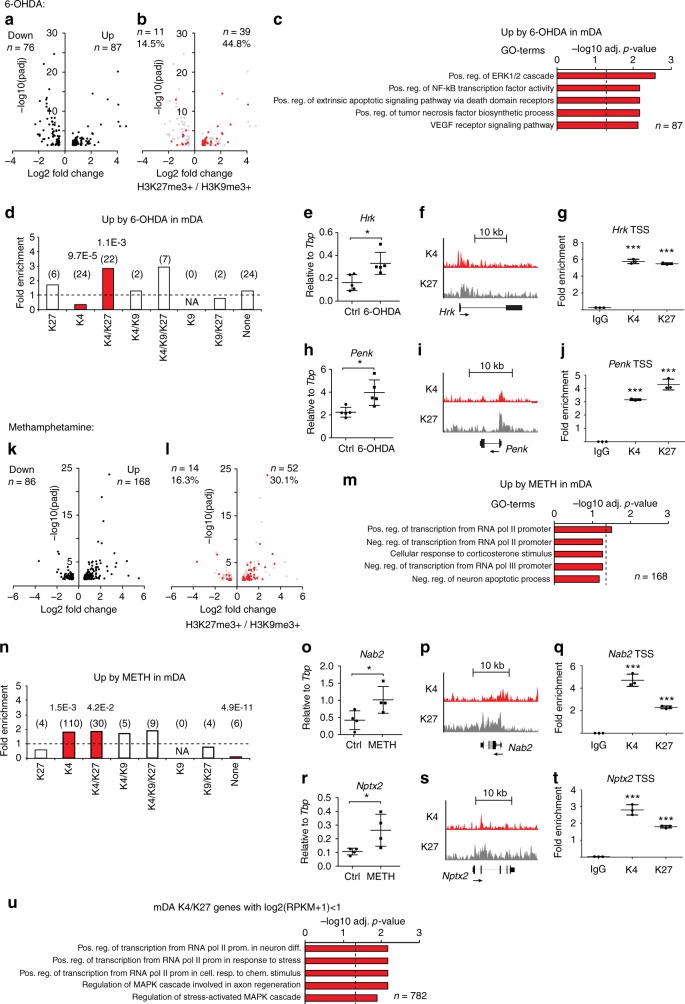
The brain is composed of hundreds of different neuronal subtypes, which largely retain their identity throughout the lifespan of the organism. The mechanisms governing this stability are not fully understood, partly due to the diversity and limited size of clinically relevant neuronal populations, which constitute a technical challenge for analysis. Here, using a strategy that allows for ChIP-seq combined with RNA-seq in small neuronal populations in vivo, we present a comparative analysis of permissive and repressive histone modifications in adult midbrain dopaminergic neurons, raphe nuclei serotonergic neurons, and embryonic neural progenitors. Furthermore, we utilize the map generated by our analysis to show that the transcriptional response of midbrain dopaminergic neurons following 6-OHDA or methamphetamine injection is characterized by increased expression of genes with promoters dually marked by H3K4me3/H3K27me3. Our study provides an in vivo genome-wide analysis of permissive/repressive histone modifications coupled to gene expression in these rare neuronal subtypes.


Conflict of interest statement

The authors declare no competing interests.

Figures

Fig. 1
Fig. 1
Purification of adult neuronal and neural progenitor nuclei. a Rpl10a-mCherry expression (red) overlaps TH (green) expression in the ventral midbrain in DatCreERT2-Rpl10a-mCherry mice. 5x and 20x magnification. To the left is an in situ hybridization for Slc6a3 taken from the Allen Brain Atlas (mouse.brain-map.org, image credit: Allen Institute), indicating the position of the images. Scale bars: 200 μm (upper panels), 50 μm (lower panels). b FACS plots showing a population of nuclei, indicated by “P5,” occurring in DatCreERT2-Rpl10a-mCherry mice but not in wild-type mice. Single-nuclei RNA-seq: c PCA-plots constructed from normalized single-nuclei log-expression values of correlated HVGs. Each nucleus is colored according to the expression of Slc6a3, Th, or Ret. Arrows indicate three outlier nuclei identified as originating from non-mDA neurons. A total of 1000 nuclei bulk RNA-seq: d Heatmap showing sample-to-sample distances between hierarchically clustered mDA, SER, and NPC RNA-seq libraries. e Expression of dopaminergic neuron markers is restricted to mDA nuclei: bars indicate average RPKM ± SD for Slc6a3 and Th as RPKMs in mDA (n = 4 mice), SER (n = 3 mice), and NPC nuclei (n = 3 embryos). f Expression of serotonergic markers is restricted to SER nuclei: bars indicate average RPKM ± SD for Slc6a4 and Tph2 as RPKMs in mDA, SER, and NPC nuclei. g Expression of neural progenitor markers is restricted to NPC nuclei: bars indicate average RPKM ± SD for Sox2 and Nes as RPKMs in mDA, SER, and NPC nuclei. Significance for eg according to two-tailed Student’s t-test assuming equal variances. ***p ≤ 0.001, **p ≤ 0.01
Fig. 2
Fig. 2
Histone modifications and gene expression in adult mDA neurons. a H3K27me3 and H3K9me3 abundance around TSS is inversely correlated with H3K4me3 abundance: Heatmaps showing genome-wide abundance of H3K27me3, H3K4me3, and H3K9me3 ± 10 kb around TSS of individual genes in mDA neurons as RPKMs obtained by ChIP-seq. Heatmaps were sorted for descending H3K27me3 abundance. b Categorization of TSS regions into chromatin states: Heatmap profiles of average H3K27me3, H3K4me3, and H3K9me3 RPKMs ± 10 kb around TSS of genes per defined chromatin state in mDA neurons (denoted as K27, K4, K4/K27, K4/K9, K4/K9/K27, K9, K9/K27, and None, respectively). c Individual chromatin states are associated with different levels of gene expression: box-plots showing the expression levels (log2(RPKM + 1)) of genes in the different chromatin-state categories. The center line is the median, bounds are the 25th and 75th percentiles, and whiskers are ±1.5 IQR. Chromatin states with an average gene expression that is different compared to the global average gene expression are indicated by p-values obtained by a two-sided Wilcoxon rank-sum test. d Genome-wide relative abundance of ChIP-seq defined chromatin states in promoter regions ±10 kb around TSS in mDA neurons. e UCSC Genome browser excerpts (https://genome.ucsc.edu) showing examples of enrichment for H3K27me3 (gray, vertical scale 0–100 RPKM), H3K4me3 (red, vertical scale 0–160 RPKM), and H3K9me3 (blue, vertical scale 0–80 RPKM) at representative genes per chromatin state in mDA neurons. Each plot spans 20 kb
Fig. 3
Fig. 3
Chromatin-state transitions reflect mDA development. a RNA-seq: Volcano plot showing differential gene expression between NPC and mDA neurons. Differentially expressed genes with an adjusted p-value < 0.05 obtained by Wald test are shown. b Volcano plot as in a where differentially expressed and H3K27me3 and/or H3K9me3-marked genes are colored according to: marked in mDA – pink, marked in NPC – green, and marked in both mDA and NPC – gray. c ChIP-seq heatmaps showing the abundance of H3K27me3, H3K4me3, and H3K9me3 as RPKMs ± 10 kb around TSS of genes that were upregulated in mDA and associated with a chromatin state containing H3K27me3 and/or H3K9me3 and d genes that were downregulated in mDA and associated with a chromatin state containing H3K27me3 and/or H3K9me3, respectively. The arrow indicates H3K27me3+ genes that gain H3K9me3 in mDA. e Chromatin-state transitions between NPC and mDA neurons for upregulated genes in mDA. Colored squares indicate transitions that occurred significantly more often than expected (odds ratio, orange = more than expected, blue = less than expected, p < 0.05 according to Fisher’s exact test and adjusted for multiple testing). f Heatmaps of average H3K27me3, H3K4me3, and H3K9me3 RPKMs ± 10 kb around TSS of genes upregulated from NPC to mDA and K4 in NPC and K4 in mDA. g Gene ontology (GO) of the top (−log10 (adj p-value), Fisher’s exact test) biological processes for upregulated genes in mDA that were K4 in NPC and K4 in mDA. h Heatmaps as in f of genes upregulated in mDA and K4/K27 in NPC and K4 in mDA. i GO of the top biological processes for upregulated genes in mDA that were K4/K27 in NPC and K4 in mDA. j Chromatin-state transitions between NPC and mDA neurons for downregulated genes in mDA (e). k Heatmaps as in f of genes downregulated in mDA and K4 in NPC and K4/K27 in mDA. l GO of the top biological processes for downregulated genes in mDA that were K4 in NPC and K4/K27 in mDA. m Heatmaps as in f of genes downregulated in mDA, and categorized as K4/K27 in NPC and K4/K27 in mDA. n GO of the top biological processes for downregulated genes in mDA that were K4/K27 in NPC and K4/K27 in mDA
Fig. 4
Fig. 4
Expansion of H3K27me3/H3K9me3 onto silenced genes in mDA neurons. a Genes repressed and H3K27me3-marked in both NPC and mDA gain H3K9me3 during terminal differentiation into mDA neurons: ChIP-seq heatmaps showing the abundance of H3K27me3, H3K4me3, and H3K9me3 as RPKMs ± 10 kb around TSS in NPC and mDA of silent (log2(RPKM + 1) < 1) and H3K27me3-marked genes in NPC. The arrow indicates a subset of silent and H3K27me3-marked genes displaying an increase in H3K9me3 in mDA compared to NPC. b Heatmap profiles of average H3K27me3, H3K4me3, and H3K9me3 RPKMs ± 10 kb around TSS of silent genes (log2(RPKM + 1) < 1) in NPC and mDA and categorized as K9/K27 or K4/K9/K27 in mDA. c Gene ontology (GO) of the top (−log10 (adj p-value), Fisher’s exact test) biological processes for silent genes (log2(RPKM + 1) < 1 in NPC and mDA neurons as in b that were K9/K27 or K4/K9/K27 in mDA neurons (n = 491). d Example of a silent and H3K27me3-marked gene in NPC that gains H3K9me3 in mDA: Left: UCSC Genome browser excerpt showing enrichment for H3K27me3 (gray, vertical scale 0–100 RPKM), H3K4me3 (red, vertical scale 0–160 RPKM), and H3K9me3 (blue, vertical scale 0–80 RPKM) within the Hoxa-locus. Right: Bars indicate average RPKM ± SD for Hoxa2, which is <1 in NPC and mDA
Fig. 5
Fig. 5
Subtype-specific chromatin landscapes define adult neurons. a RNA-seq: Volcano plot showing differential gene expression between SER and mDA neurons. Differentially expressed genes with an adjusted p-value < 0.05 obtained by Wald test are shown. b Volcano plot as in a, differentially expressed and H3K27me3 and/or H3K9me3-marked genes colored according to: marked in mDA – pink, marked in SER – green, and marked in both mDA and SER – gray. c Gene ontology (GO) of selected (−log10 (adj p-value), Fisher’s exact test) biological processes for upregulated genes in mDA relative to SER (n = 272). d As in b for downregulated genes in mDA relative to SER (n = 160). e ChIP-seq heatmaps showing the abundance of H3K27me3, H3K4me3, and H3K9me3 as RPKMs ± 10 kb around TSS of genes upregulated in mDA relative to SER neurons and associated with a chromatin state containing H3K27me3 and/or H3K9me3 in mDA and/or SER (top panels), and genes downregulated in mDA relative to SER neurons and associated with a chromatin state containing H3K27me3 and/or H3K9me3 in mDA and/or SER (bottom panels). f Chromatin-state transitions between SER and mDA neurons for upregulated genes in mDA relative to SER. Colored squares indicate transitions that occurred significantly more often than expected (odds ratio, orange = more than expected, blue = less than expected, and p < 0.05 according to Fisher’s exact test and adjusted for multiple testing). g–j Left: UCSC Genome browser excerpts showing examples of H3K27me3- (gray, vertical scale 0–100 RPKM), H3K4me3- (red, vertical scale 0–160 RPKM), and H3K9me3 enrichment (blue, vertical scale 0–80 RPKM) around the Th, Lmx1a, Nr4a2, and Foxa2 loci. Each plot spans 20 kb. Right: Bars indicate average RPKM ± SD for Th, Lmx1a, Nr4a2, and Foxa2 in mDA and SER neurons, respectively. k Chromatin-state transitions between SER and mDA neurons for downregulated genes in mDA relative to SER as in f. l–o Left: UCSC Genome browser excerpts showing examples of enrichment of H3K27me3 (gray, vertical scale 0–100 RPKM), H3K4me3 (red, vertical scale 0–160 RPKM), and H3K9me3 (blue, vertical scale 0–80 RPKM) around the Tph2, Htr1a, Gata2, and Gata3 loci. Each plot spans 20 kb. Right: Bars indicate average RPKM ± SD for Tph2, Htr1a, Gata2, and Gata3 in mDA and SER neurons, respectively
Fig. 6
Fig. 6
Activation of H3K27me3 marked genes during stress. a TRAP-seq: Volcano plot showing differential gene expression in mDA neurons from lesioned and unlesioned hemispheres 14 days after unilateral 6-OHDA injections (n = 5 mice) (Methods). b As in a where H3K27me3 and/or H3K9me3-marked and regulated genes are marked with red. c Gene ontology (GO) of selected (−log10(adj p-value), Fisher’s exact test) biological processes for upregulated genes in mDA neurons of the lesioned hemisphere (n = 87). d Bars indicate the odds-ratio fold enrichment for upregulated genes after 6-OHDA treatments per chromatin state. Absolute numbers of genes per state are given in parenthesis. Red bars indicate significant enrichment according to Fisher’s exact test and are adjusted for multiple testing. e TRAP-qPCR confirming induction of Hrk relative to Tbp in mDA after 6-OHDA. Bars indicate average expression ± SD. Two-tailed Student’s t-test assuming equal variances. *p ≤ 0.05. f Genome browser excerpt showing H3K4me3 (K4, red, vertical scale 0–160 RPKM) and H3K27me3 (K27, gray, vertical scale 0–100 RPKM) enrichment at the Hrk locus in naive mDA nuclei. g ChIP-qPCR in mDA nuclei showing fold-enrichment of IgG, K4, and K27 relative to input near the Hrk TSS. Bars indicate average enrichment ± SD. K4 enrichment was significantly higher near Hrk compared to near the Hoxa2 TSS and K27 enrichment was significantly higher compared to near the Tbp TSS (Supplementary Fig. 11f,h). Two-tailed Student’s t-test assuming equal variances. ***p ≤ 0.001. hj As in eg for Penk. k TRAP-seq: Volcano plot showing differential gene expression in mDA neurons 2 h after a single methamphetamine injection compared to saline-injected controls, similar to a. l As in k where H3K27me3 and/or H3K9me3-marked and regulated genes are marked with red. m GO for selected (−log10 (adj p-value), Fisher’s exact test) biological processes for upregulated genes in mDA neurons after methamphetamine (n = 52). n Odds ratio for upregulated genes after methamphetamine per chromatin state as in d. ot Examples of upregulated K4/K27 genes after methamphetamine, similar to eg. u Silent genes with K4/K27-marked promoters are commonly involved in stress responses: GO for selected (−log10 (adj p-value), Fisher’s exact test) biological processes for K4/K27 genes with log2(RPKM + 1)<1 in naive mDA neurons

References

    1. La Manno G, et al. Molecular diversity of midbrain development in mouse, human, and stem cells. Cell. 2016;167:566–580 e519. doi: 10.1016/j.cell.2016.09.027. - DOI - PMC - PubMed
    1. Holmberg J, Perlmann T. Maintaining differentiated cellular identity. Nat. Rev. Genet. 2012;13:429–439. doi: 10.1038/nrg3209. - DOI - PubMed
    1. Cholewa-Waclaw J, et al. The role of epigenetic mechanisms in the regulation of gene expression in the nervous system. J. Neurosci. 2016;36:11427–11434. doi: 10.1523/JNEUROSCI.2492-16.2016. - DOI - PMC - PubMed
    1. Nestler EJ, Pena CJ, Kundakovic M, Mitchell A, Akbarian S. Epigenetic basis of mental illness. Neuroscientist. 2016;22:447–463. doi: 10.1177/1073858415608147. - DOI - PMC - PubMed
    1. Nelson EL, Liang CL, Sinton CM, German DC. Midbrain dopaminergic neurons in the mouse: computer-assisted mapping. J. Comp. Neurol. 1996;369:361–371. doi: 10.1002/(SICI)1096-9861(19960603)369:3<361::AID-CNE3>3.0.CO;2-3. - DOI - PubMed

Publication types