. 2018 Mar 26;8(1):5210.
doi: 10.1038/s41598-018-23534-9.

Extracting biological age from biomedical data via deep learning: too much of a good thing?

Affiliations

Extracting biological age from biomedical data via deep learning: too much of a good thing?

Timothy V Pyrkov et al. Sci Rep. .

Abstract

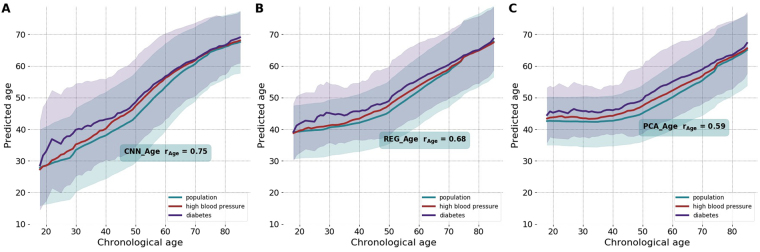
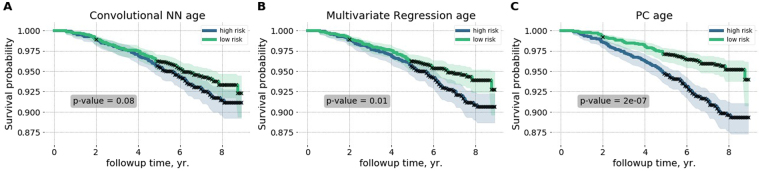
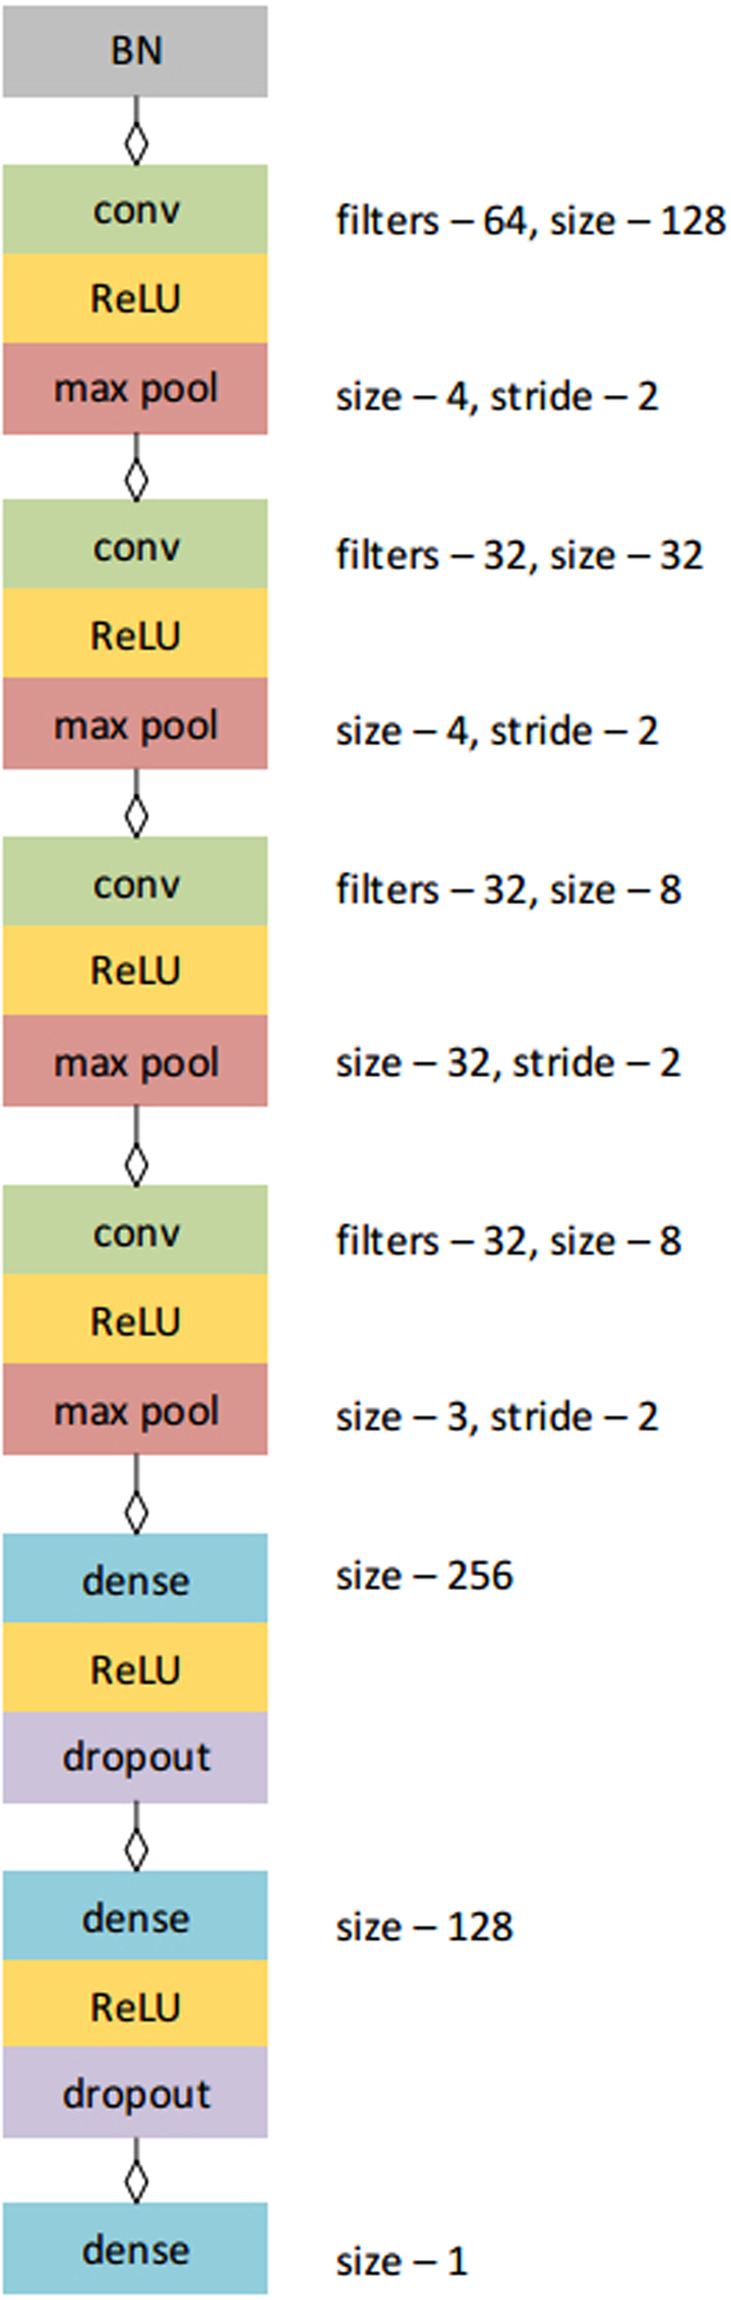
Age-related physiological changes in humans are linearly associated with age. Naturally, linear combinations of physiological measures trained to estimate chronological age have recently emerged as a practical way to quantify aging in the form of biological age. In this work, we used one-week long physical activity records from a 2003-2006 National Health and Nutrition Examination Survey (NHANES) to compare three increasingly accurate biological age models: the unsupervised Principal Components Analysis (PCA) score, a multivariate linear regression, and a state-of-the-art deep convolutional neural network (CNN). We found that the supervised approaches produce better chronological age estimations at the expense of a loss of the association between the aging acceleration and all-cause mortality. Consequently, we turned to the NHANES death register directly and introduced a novel way to train parametric proportional hazards models suitable for out-of-the-box implementation with any modern machine learning software. As a demonstration, we produced a separate deep CNN for mortality risks prediction that outperformed any of the biological age or a simple linear proportional hazards model. Altogether, our findings demonstrate the emerging potential of combined wearable sensors and deep learning technologies for applications involving continuous health risk monitoring and real-time feedback to patients and care providers.


Conflict of interest statement

P.O. Fedichev is a shareholder of Gero LLC. T. V. Pyrkov, B. Zhurov, A. Zenin, M. Pyatnitskiy, L. Menshikov, and P.O. Fedichev are employees of Gero LLC. A patent application submitted by Gero LLC on the described methods and tools for evaluating health non-invasively is pending.

Figures

Figure 1
Figure 1
Accuracy of age-predicting models. The biological age estimation according to deep convolutional neural network CNN_Age (A), the multivariate regression REG_Age (B), and the unsupervised PCA_Age (C) models. The solid lines and the transparent ± standard deviation bands are color coded as green, blue, and red, representing the whole population, the patients diagnosed with diabetes by a doctor, and individuals with self-reported high blood pressure, respectively. All the calculations were produced using the NHANES 2003–2006 cohort wearable accelerometers data, comprising one-week long activity tracks (1 min−1 sampling rate).
Figure 2
Figure 2
Performance of the biological age models to distinguish between the longer- and the shorter-living individuals illustrated with Kaplan-Meier survival curves. Each participant was classified into the “high-” and the “low-” risks groups according to the deep convolutional neural network CNN_Age (A), the multivariate regression REG_Age (B), and the unsupervised PCA_Age (C) models. The p-values characterize the survival curves separation significance.
Figure 3
Figure 3
Architecture of convolutional neural network. The same network architecture was used to train both models for predicting age and for predicting mortality rates.
Figure 4
Figure 4
Learning curves for the CNN age and hazard predictor models. Learning curves for age-predicting model CNN_Age are shown for each of 5 folds for the training (A) and test (B) subsets. Cross-validation learning curves (B) show a minimum of MSE at epochs 500–800, while further training results in model overfitting. Panels (C,D) show the learning curves for the mortality risk-predicting CNN model. Here some of the cross-validation learning curves show a minimum of MSE at epoch 3000. Learning curves are color-coded according to the fold number in the 5-fold training/cross-validation setup.

References

    1. Hannum G, et al. Genome-wide methylation profiles reveal quantitative views of human aging rates. Mol. Cell. 2013;49:359–367. doi: 10.1016/j.molcel.2012.10.016. - DOI - PMC - PubMed
    1. Peters MJ, et al. The transcriptional landscape of age in human peripheral blood. Nat Commun. 2015;6:8570. doi: 10.1038/ncomms9570. - DOI - PMC - PubMed
    1. Enroth S, Enroth SB, Johansson A, Gyllensten U. Protein profiling reveals consequences of lifestyle choices on predicted biological aging. Sci Rep. 2015;5:17282. doi: 10.1038/srep17282. - DOI - PMC - PubMed
    1. Choi BC, Pak AW, Choi JC. Daily step goal of 10,000 steps: a literature review. Clin. & Investig. Medicine. 2007;30:146–151. doi: 10.25011/cim.v30i3.1083. - DOI - PubMed
    1. Pyrkov, T. V. et al. Quantitative characterization of biological age and frailty based on locomotor activity records. bioRxiv 186569 (2017). - PMC - PubMed

Publication types