. 2018 May;14(5):431-441.
doi: 10.1038/s41589-018-0021-8. Epub 2018 Mar 26.

The dTAG system for immediate and target-specific protein degradation

Affiliations

The dTAG system for immediate and target-specific protein degradation

Behnam Nabet et al. Nat Chem Biol. 2018 May.

Abstract

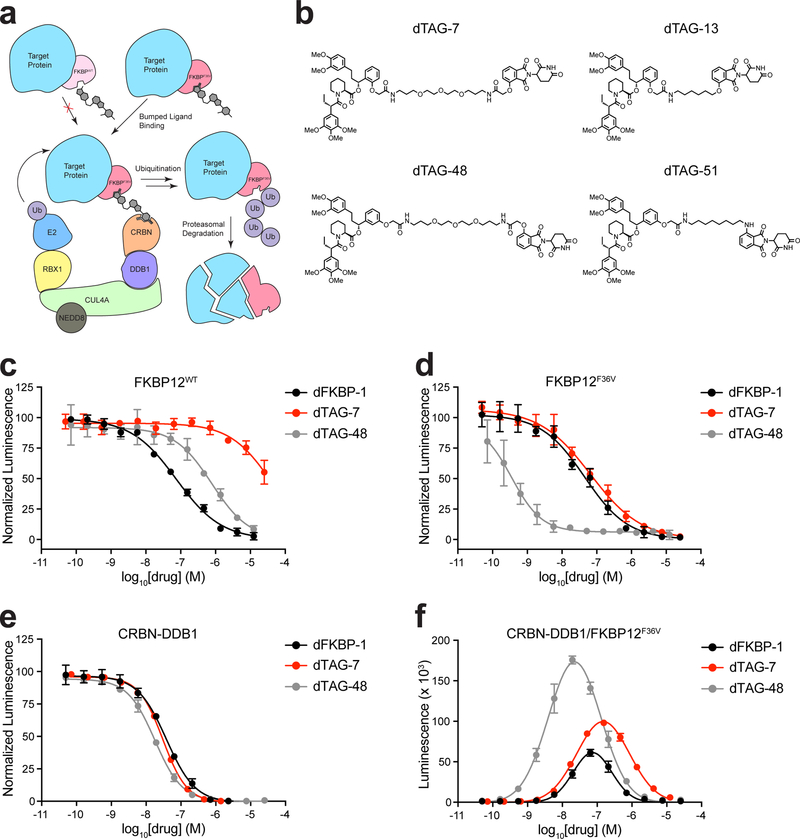
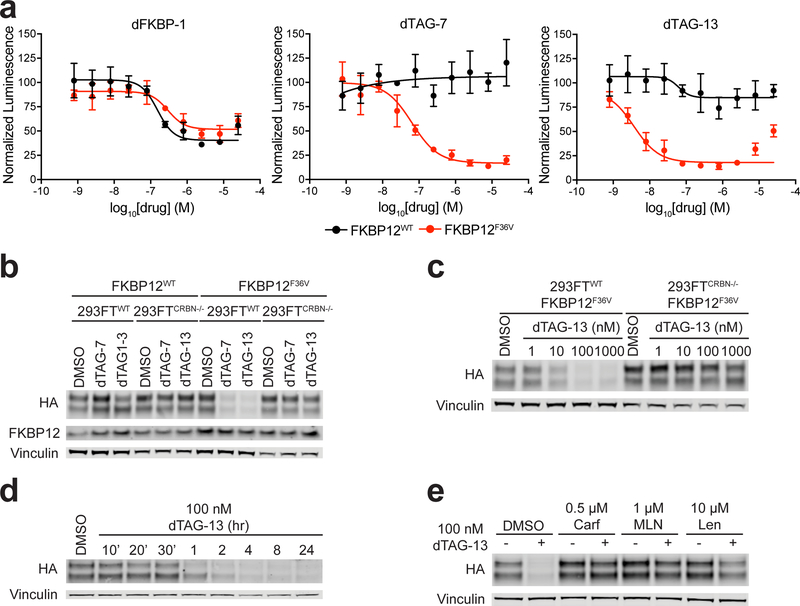
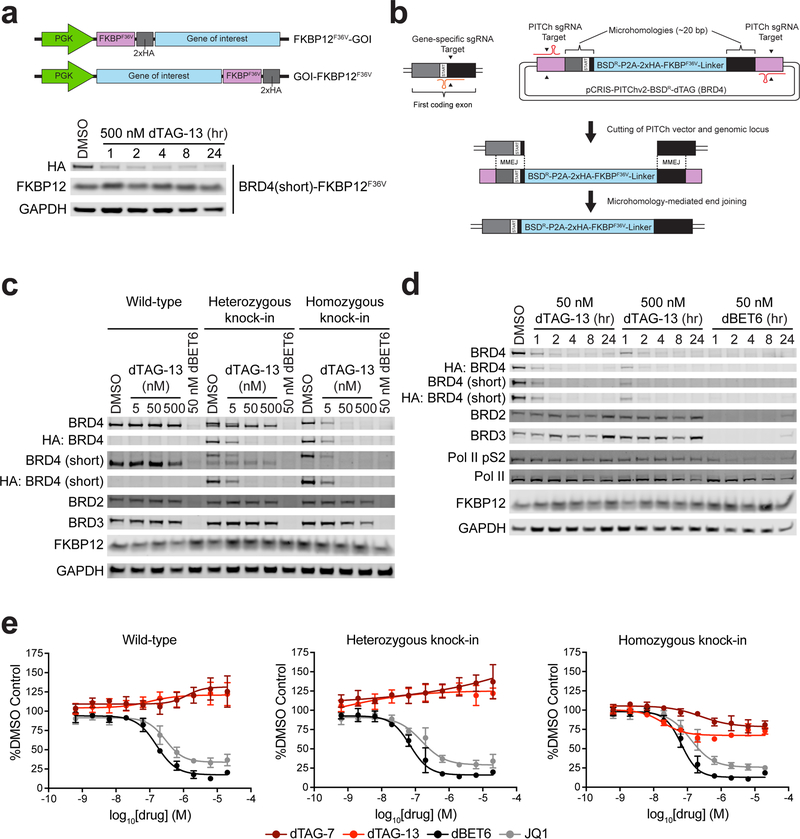
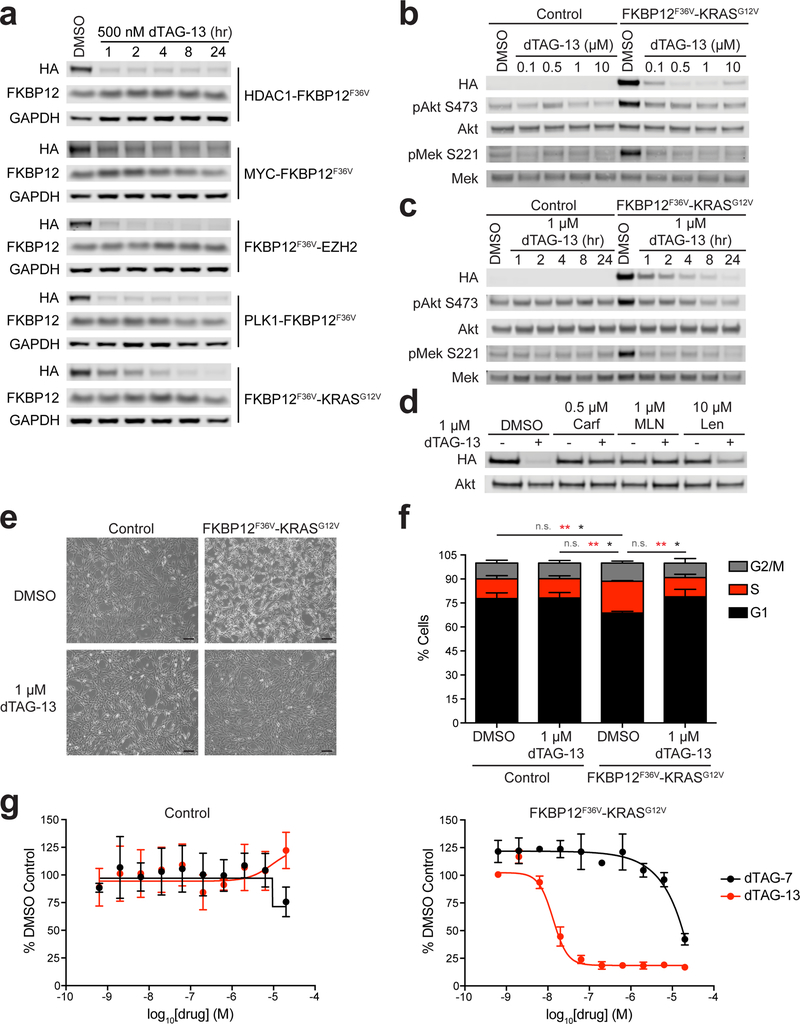
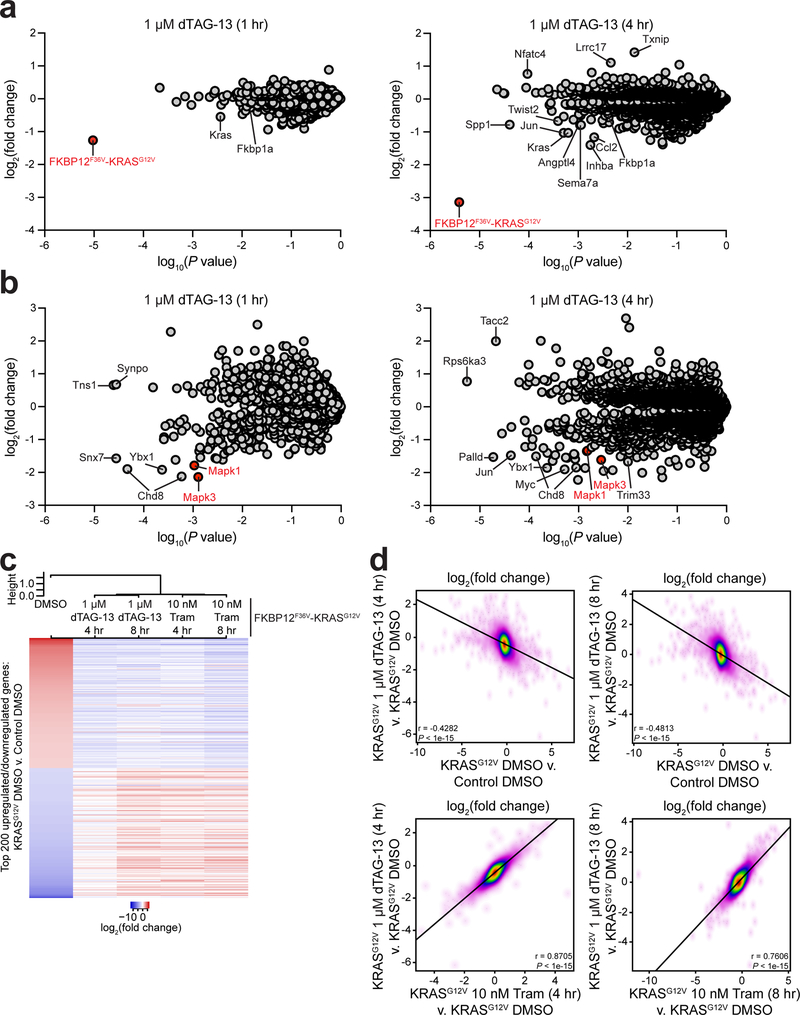
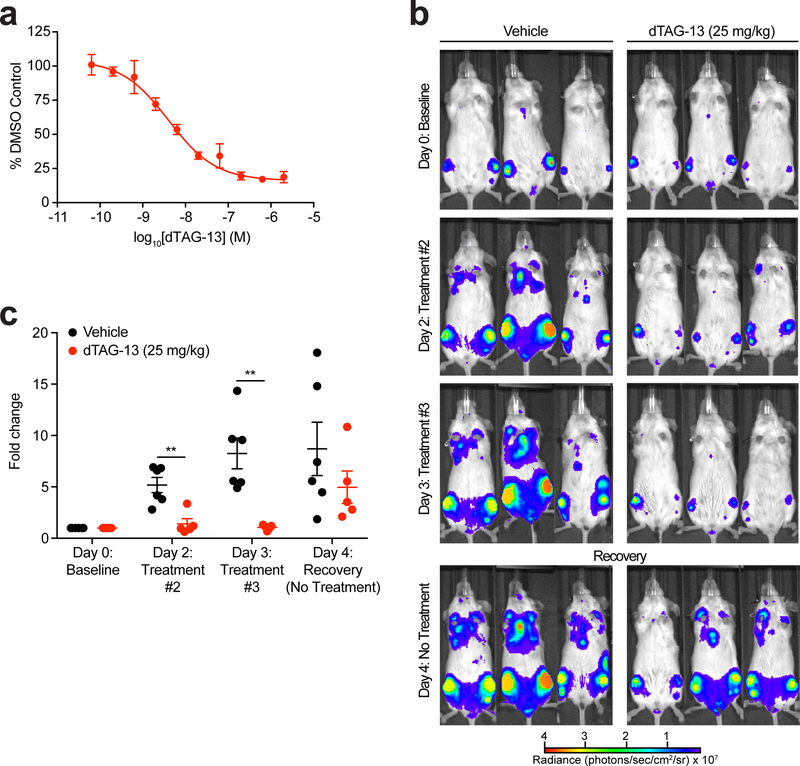
Dissection of complex biological systems requires target-specific control of the function or abundance of proteins. Genetic perturbations are limited by off-target effects, multicomponent complexity, and irreversibility. Most limiting is the requisite delay between modulation to experimental measurement. To enable the immediate and selective control of single protein abundance, we created a chemical biology system that leverages the potency of cell-permeable heterobifunctional degraders. The dTAG system pairs a novel degrader of FKBP12F36V with expression of FKBP12F36V in-frame with a protein of interest. By transgene expression or CRISPR-mediated locus-specific knock-in, we exemplify a generalizable strategy to study the immediate consequence of protein loss. Using dTAG, we observe an unexpected superior antiproliferative effect of pan-BET bromodomain degradation over selective BRD4 degradation, characterize immediate effects of KRASG12V loss on proteomic signaling, and demonstrate rapid degradation in vivo. This technology platform will confer kinetic resolution to biological investigation and provide target validation in the context of drug discovery.


Figures

Figure 1 |
Figure 1 |. Heterobifunctional dTAG molecules engage and dimerize FKBP12F36V and CRBN in biochemical assays.
(a) Schematic depiction of the dTAG strategy. Bumped heterobifunctional dTAG molecules induce dimerization of FKBP12F36V fusion chimeras and the CRBN E3 ligase complex leading to CRBN-mediated degradation. (b) Chemical structures of heterobifunctional dTAG molecules. (c) DMSO normalized displacement of bio-SLF from GST-FKBP12WT by AlphaScreen with dFKBP-1, dTAG-7, or dTAG-48. (d) DMSO normalized displacement of bio-SLF from GST-FKBP12F36V by AlphaScreen with dFKBP-1, dTAG-7, or dTAG-48. (e) DMSO normalized displacement of bio-Thal from HIS-CRBN-DDB1 by AlphaScreen with dFKBP-1, dTAG-7, or dTAG-48. (f) dTAG molecule induced GST-FKBP12F36V and HIS-CRBN-DDB1 complex formation by AlphaScreen with dFKBP-1, dTAG-7, or dTAG-48. Data in c-f are presented as mean ± s.d. of n = 3 independent samples and are representative of n = 3 independent experiments.
Figure 2 |
Figure 2 |. dTAG-7 and dTAG-13 selectively degrade FKBP12F36V in a CRBN-dependent manner in cells.
(a) DMSO normalized ratio of Nluc/Fluc signal of 293FTWT cells expressing FKBP12WT-Nluc or FKBP12F36V-Nluc treated with dFKBP-1, dTAG-7, or dTAG-13 for 24 hours. Data are presented as mean ± s.d. of n = 4 biologically independent samples and are representative of n = 3 independent experiments. (b) Immunoblot analysis of 293FTWT and 293FTCRBN−/− cells expressing FKBP12WT-Nluc or FKBP12F36V-Nluc treated with DMSO, 100 nM dTAG-7, or 100 nM dTAG-13 for four hours. (c) Immunoblot analysis of 293FTWT and 293FTCRBN−/− cells expressing FKBP12F36V-Nluc treated with DMSO or dTAG-13 at the indicated doses for four hours. (d) Immunoblot analysis of 293FTWT cells expressing FKBP12F36V-Nluc treated with DMSO or dTAG-13 for the indicated time-course. (e) Immunoblot analysis of 293FTWT cells expressing FKBP12F36V-Nluc pretreated with DMSO, Carfilzomib (Carf), MLN4924 (MLN), or Lenalidomide (Len) for two hours prior to DMSO or dTAG-13 treatment for four hours. Data in b-e are representative of n = 2 independent experiments. Uncropped immunoblots are displayed in Supplemental Fig. 11.
Figure 3 |
Figure 3 |. Selective pharmacological degradation of endogenously tagged BRD4.
(a) Schematic depiction of lentiviral expression strategy (Top). Immunoblot analysis of MV4;11 cells expressing BRD4 (short isoform)-FKBP12F36V treated with DMSO or dTAG-13 for the indicated time-course (Bottom). (b) Schematic depiction of knock-in strategy. Gene-specific and PITCh-specific sgRNAs expressed from pX330A-nBRD4/PITCh (not visualized, see methods) target the genomic locus and the pCRIS-PITChv2-BSDR-dTAG construct, respectively. This allows for both cutting of the genomic locus and liberation of the FKBP12F36V-containing cassette. MMEJ leads to repair of the double strand break through insertion of the FKBP12F36V-containing cassette, yielding an endogenously tagged product. (c) Immunoblot analysis of 293T wild-type, heterozygous BRD4 knock-in, or homozygous BRD4 knock-in cells treated with DMSO, dTAG-13, or dBET6 for four hours. (d) Immunoblot analysis of 293T homozygous BRD4 knock-in cells treated with DMSO, dTAG-13, or dBET6 for the indicated time-course. Data in a, c-d are representative of n = 2 independent experiments. Uncropped immunoblots are displayed in Supplemental Fig. 11–12. (e) DMSO normalized anti-proliferation of 293T wild-type, heterozygous BRD4 knock-in, or homozygous BRD4 knock-in cells treated with the indicated compounds for 72 hours. Data are presented as mean ± s.d. of n = 4 biologically independent samples and are representative of n = 3 independent experiments.
Figure 4 |
Figure 4 |. Rapid degradation of nuclear and cytoplasmic FKBP12F36V fusion chimeras.
(a) Immunoblot analysis of MV4;11 cells expressing the indicated FKBP12F36V fusions treated with DMSO or dTAG-13 for the indicated time-course. (b) Immunoblot analysis of mock transduced (Control) NIH/3T3 cells or NIH/3T3 cells expressing FKBP12F36V-KRASG12V treated with DMSO or dTAG-13 for 24 hours. (c) Immunoblot analysis of mock transduced (Control) NIH/3T3 cells or NIH/3T3 cells expressing FKBP12F36V-KRASG12V treated with DMSO or dTAG-13 for the indicated time-course. (d) Immunoblot analysis of NIH/3T3 cells expressing FKBP12F36V-KRASG12V pretreated with DMSO, Carfilzomib (Carf), MLN4924 (MLN), or Lenalidomide (Len) for two hours prior to DMSO or dTAG-13 treatment for four hours. (e) Phase contrast images of mock transduced (Control) NIH/3T3 cells or NIH/3T3 cells expressing FKBP12F36V-KRASG12V treated with DMSO or dTAG-13 for 24 hours. Scale bar represents 100 μm. Data in a-e are representative of n = 2 independent experiments. Uncropped immunoblots are displayed in Supplemental Fig. 12–13. (f) Propidium iodide analysis of the percentage of mock transduced (Control) NIH/3T3 cells or NIH/3T3 cells expressing FKBP12F36V-KRASG12V in different phases of the cell cycle treated with DMSO or dTAG-13 for 48 hours. Data are presented as mean ± s.d. of n = 3 independent experiments. P values derived from a two-tailed Student’s t-test are color coded for each phase of the cell cycle. * P < 0.05, ** P < 0.01, not significant (n.s.) (G1, P values for indicated comparisons: P = 0.0140 for Control DMSO versus FKBP12F36V-KRASG12V DMSO, P = 0.0105 for Control 1 μM dTAG-13 versus FKBP12F36V-KRASG12V DMSO, P = 0.0205 for FKBP12F36V-KRASG12V DMSO versus FKBP12F36V-KRASG12V 1 μM dTAG-13; S, P values for indicated comparisons: P = 0.0030 for Control DMSO versus FKBP12F36V-KRASG12V DMSO, P = 0.0020 for Control 1 μM dTAG-13 versus FKBP12F36V-KRASG12V DMSO, P = 0.0028 for FKBP12F36V-KRASG12V DMSO versus FKBP12F36V-KRASG12V 1 μM dTAG-13; G2/M, P values for indicated comparisons were n.s.). (g) DMSO normalized anti-proliferation of mock transduced (Control) NIH/3T3 cells or NIH/3T3 cells expressing FKBP12F36V-KRASG12V treated with the indicated compounds for 72 hours. Data are presented as mean ± s.d. of n = 4 biologically independent samples and are representative of n = 3 independent experiments.
Figure 5 |
Figure 5 |. KRASG12V degradation rapidly reverses the deregulated proteomic and transcriptional signaling program of transformed cells.
(a) Protein abundance after treatment of NIH/3T3 cells expressing FKBP12F36V-KRASG12V with dTAG-13 for one and four hours, compared to DMSO treatment. Volcano plot depicts fold change abundance of 8164 quantified proteins versus P value derived from a two-tailed Student’s t-test. Normalized percent relative abundance of quantified proteins are provided in Supplementary Dataset 1. (b) Phospho-serine/threonine abundance after treatment of NIH/3T3 cells expressing FKBP12F36V-KRASG12V with dTAG-13 for one and four hours, compared to DMSO treatment. Volcano plot depicts fold change abundance of 8316 quantified phosphosites versus P value derived from a two-tailed Student’s t-test. Normalized percent relative abundance of quantified phosphosites are provided in Supplementary Dataset 2. (c) Heatmap of fold change in expression of top 200 upregulated and top 200 downregulated genes upon comparison of NIH/3T3 cells expressing FKBP12F36V-KRASG12V treated with DMSO and mock transduced (Control) NIH/3T3 cells treated with DMSO. Fold change levels of NIH/3T3 cells expressing FKBP12F36V-KRASG12V cells treated with dTAG-13 or Trametinib (Tram) compared to NIH/3T3 cells expressing FKBP12F36V-KRASG12V treated with DMSO are depicted. ERCC spike-in normalized FPKM of genes included in the heatmap are depicted in Supplementary Dataset 4. (d) Scatterplots of fold change in gene expression of NIH/3T3 cells in the indicated comparisons. Pearson correlation coefficient and associated P values are indicated. Data in a-d are from n = 3 biologically independent samples.
Figure 6 |
Figure 6 |. Evaluation of rapid and reversible degradation in vivo.
(a) DMSO normalized ratio of Fluc signal of MV4;11 cells expressing luciferase-FKBP12F36V treated with dTAG-13 for 16 hours. Data are presented as mean ± s.d. of n = 4 biologically independent samples and are representative of n = 3 independent experiments. (b) Images of average radiance of vehicle (n = 6 biologically independent mice) or dTAG-13 (n = 5 biologically independent mice) treated mice. Three representative mice are shown and the same mouse is shown on the same scale at each time-point. (c) Fold change in average radiance of each mouse normalized to baseline signal at Day 0 of vehicle (n = 6 biologically independent mice) or dTAG-13 (n = 5 biologically independent mice) treated mice. P value derived from a two-tailed Welch’s t-test. ** P < 0.01 (P = 0.0025 for Day 2 and P = 0.0048 for Day 3).

References

    1. Winter GE et al. DRUG DEVELOPMENT. Phthalimide conjugation as a strategy for in vivo target protein degradation. Science 348, 1376–1381 (2015). - PMC - PubMed
    1. Lu J et al. Hijacking the E3 Ubiquitin Ligase Cereblon to Efficiently Target BRD4. Chem. Biol 22, 755–763 (2015). - PMC - PubMed
    1. Zengerle M, Chan KH & Ciulli A Selective Small Molecule Induced Degradation of the BET Bromodomain Protein BRD4. ACS Chem. Biol 10, 1770–1777 (2015). - PMC - PubMed
    1. Winter GE et al. BET Bromodomain Proteins Function as Master Transcription Elongation Factors Independent of CDK9 Recruitment. Mol. Cell 67, 5–18 e19 (2017). - PMC - PubMed
    1. Bondeson DP et al. Catalytic in vivo protein knockdown by small-molecule PROTACs. Nat. Chem. Biol 11, 611–617 (2015). - PMC - PubMed

Publication types

MeSH terms