. 2018 May 10;36(14):1396-1404.
doi: 10.1200/JCO.2017.76.8861. Epub 2018 Mar 27.

Molecular Characterization and Mortality From Breast Cancer in Men

Affiliations

Molecular Characterization and Mortality From Breast Cancer in Men

Suleiman Alfred Massarweh et al. J Clin Oncol. .

Abstract

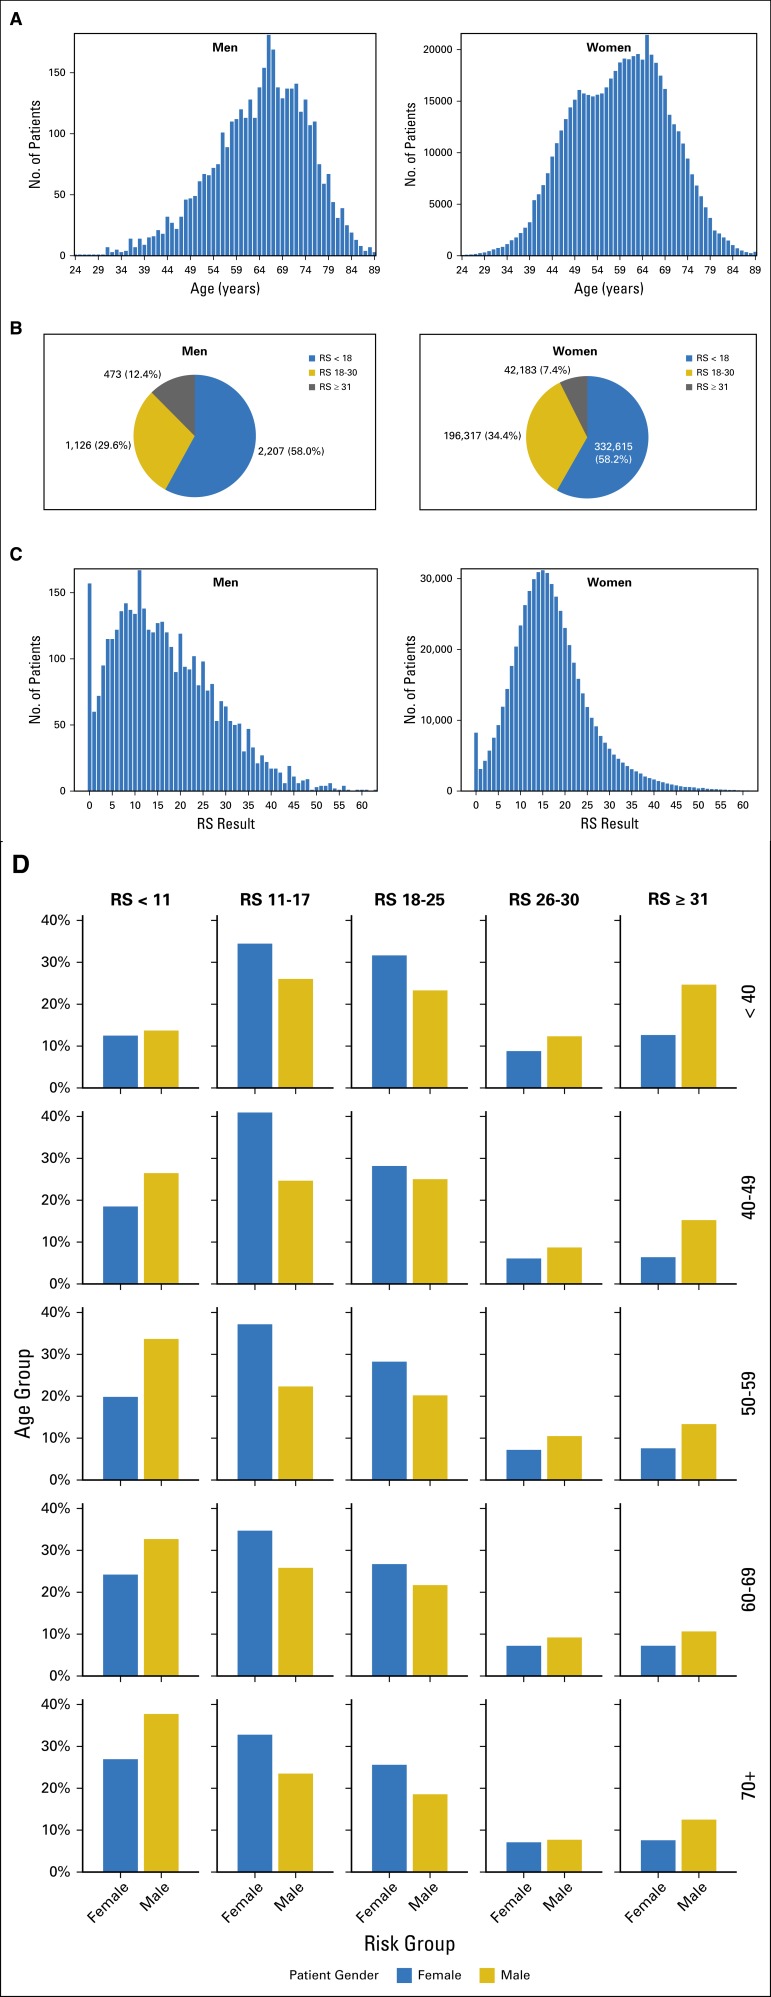
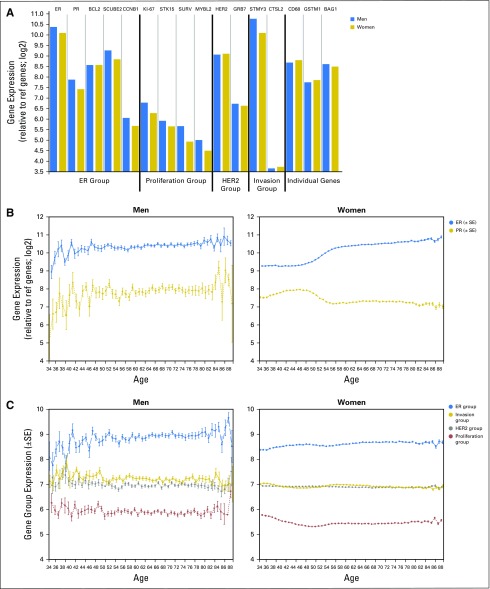
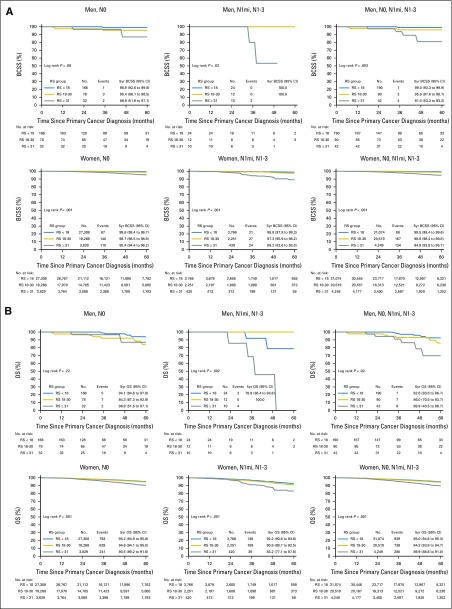
Purpose Limited data exist on the molecular biology, treatment, and outcomes of breast cancer in men, and much of our understanding in this area remains largely an extrapolation from data in women with breast cancer. Materials and Methods We studied men and women with hormone receptor-positive breast cancer and the 21-gene Breast Recurrence Score (RS) results. Differences in clinical characteristics and gene expression were determined, and distribution of RS results was correlated with 5-year breast cancer-specific survival (BCSS) and overall survival. Results There were 3,806 men and 571,115 women. Men were older than women (mean age, 64.2 v 59.1 years; P < .001). RS < 18 predominated in both genders, but RS ≥ 31 was more frequent in men (12.4% v 7.4%; P < .001), as were very low scores (RS < 11; 33.8% v 22.1%; P < .001). Mean gene expression was higher in men for the estrogen receptor (ER), proliferation, and invasion groups. ER was lowest and progesterone receptor was highest in women younger than 50 years of age, with a progressive increase in ER with age. Men younger than 50 years of age had slightly lower ER and progesterone receptor compared with older men. Survival data were available from SEER for 322 men and 55,842 women. Five-year BCSS was 99.0% (95% CI, 99.3% to 99.9%) and 95.9% (95% CI, 87.6% to 98.7%) for men with RS < 18 and RS 18-30, respectively, and for women, it was 99.5% (95% CI, 99.4% to 99.6%) and 98.6% (95% CI, 98.4% to 98.8%), respectively. RS ≥ 31 was associated with an 81.0% 5-year BCSS in men (95% CI, 53.3% to 93.2%) and 94.9% 5-year BCSS (95% CI, 93.9% to 95.7%) in women. Five-year BCSS and overall survival were lower in men than in women. Conclusion This study reveals some distinctive biologic features of breast cancer in men and an important prognostic role for RS testing in both men and women.


Figures

Fig 1.
Fig 1.
Age and Recurrence Score (RS) distribution in men (n = 3,806) and women (n = 571,115). (A) The number of patients plotted on the y-axis against age on the x-axis for men (left side of graph) and women (right side of graph). (B) A pie chart for the breakdown of RS distribution in men (left side) versus women (right side), with RS < 18 in blue, RS 18-30 in gold, and RS ≥ 31 in gray. (C) The number of patients on the y-axis plotted against RS results on the x-axis for men (left side of graph) and women (right side of graph). (D) RS by age group on the y-axis against gender on the x-axis. Age groups plotted are < 40, 40 to 49, 50 to 59, 60 to 69, and ≥ 70 years, with proportion of RS ranges (RS < 11, RS 11-17, RS 18-25, RS 26-30, and RS ≥ 31) shown for each age group. Men are represented in gold and women in blue.
Fig 2.
Fig 2.
Individual gene expression in men (n = 3,806) and women (n = 571,115). (A) Individual gene expression levels plotted for men (blue) and women (gold). The y-axis represents fold change in expression value, and the x-axis represents the different genes and gene groups for men and women as follows from left to right: the estrogen-receptor (ER) group (ER, progesterone receptor [PR], BCL2, SCUBE2, and CCNB1); the proliferation group (Ki-67, STK15, SURV, and MYLB2); the human epidermal growth factor receptor 2 (HER2) group (HER2 and GRB7); the invasion group (stromelysin [STMY3] and CTLS2); and the additional individual genes (CD68, GSTM1, and BAG1). Each group is separated by a vertical black line. (B) Individual ER and PR expression for men (left side of graph) and women (right side of graph). The y-axis represents fold change in expression value (mean ± SE), and x-axis represents age. ER is in blue and PR is in gold. (C) The mean quantitative expression of the different gene groups (axes): proliferation group (red),HER2 group (gray), ER group (blue), and invasion group (gold). The y-axis represents fold change in expression (mean ± SE), and the x-axis represents age.
Fig 3.
Fig 3.
Breast cancer-specific survival (BCSS) and overall survival (OS) by Recurrence Score (RS) group and nodal status in men (n = 322) and women (n = 55,842). (A) BCSS (y-axis) plotted against time in months from cancer diagnosis (x-axis) according to RS and nodal status in men (top panel) versus women (lower panel). Left-side graphs are for N0, middle graphs are for N1mi and N1-3, and right-side graphs are for all nodal groups together (N0, N1mi, and N1-3). (B) Overall survival (y-axis) plotted against RS and nodal status in men (top panel) versus women (lower panel). Left-side graphs are for N0, middle graphs are for N1mi and N1-3, and right-side graphs are for all nodal groups together (N0, N1mi, and N1-3). RS < 18 (blue), RS 18-30 (gold), and RS ≥ 31 (gray). Log rank P values for each survival graph are shown.
Fig A1.
Fig A1.
Genomic Health Laboratory data were merged with SEER registry data, resulting in patients diagnosed between 2004 and 2013, with and without Recurrence Score (RS) testing. Final analytic cohorts are represented in shaded boxes: Genomic Health Laboratory cohort (n = 574,921) and SEER cohort with RS results (n = 56,164). 0-3LN, zero to three positive lymph nodes; HER2, human epidermal growth factor receptor 2; HR, hormone receptor.

References

    1. Siegel RL, Miller KD, Jemal A: Cancer statistics, 2016. CA Cancer J Clin 66:7-30, 2016 - PubMed
    1. Anderson WF, Jatoi I, Tse J, et al. : Male breast cancer: A population-based comparison with female breast cancer. J Clin Oncol 28:232-239, 2010 - PMC - PubMed
    1. Kreiter E, Richardson A, Potter J, et al. : Breast cancer: Trends in international incidence in men and women. Br J Cancer 110:1891-1897, 2014 - PMC - PubMed
    1. Chavez-Macgregor M, Clarke CA, Lichtensztajn D, et al. : Male breast cancer according to tumor subtype and race: A population-based study. Cancer 119:1611-1617, 2013 - PMC - PubMed
    1. Piscuoglio S, Ng CK, Murray MP, et al. : The genomic landscape of male breast cancers. Clin Cancer Res 22:4045-4056, 2016 - PMC - PubMed

MeSH terms