. 2018 May 1;128(5):1737-1751.
doi: 10.1172/JCI93198. Epub 2018 Mar 26.

JAM3 maintains leukemia-initiating cell self-renewal through LRP5/AKT/β-catenin/CCND1 signaling

Affiliations

JAM3 maintains leukemia-initiating cell self-renewal through LRP5/AKT/β-catenin/CCND1 signaling

Yaping Zhang et al. J Clin Invest. .

Abstract

Leukemia-initiating cells (LICs) are responsible for the initiation, development, and relapse of leukemia. The identification of novel therapeutic LIC targets is critical to curing leukemia. In this report, we reveal that junctional adhesion molecule 3 (JAM3) is highly enriched in both mouse and human LICs. Leukemogenesis is almost completely abrogated upon Jam3 deletion during serial transplantations in an MLL-AF9-induced murine acute myeloid leukemia model. In contrast, Jam3 deletion does not affect the functions of mouse hematopoietic stem cells. Moreover, knockdown of JAM3 leads to a dramatic decrease in the proliferation of both human leukemia cell lines and primary LICs. JAM3 directly associates with LRP5 to activate the downstream PDK1/AKT pathway, followed by the downregulation of GSK3β and activation of β-catenin/CCND1 signaling, to maintain the self-renewal ability and cell cycle entry of LICs. Thus, JAM3 may serve as a functional LIC marker and play an important role in the maintenance of LIC stemness through unexpected LRP5/PDK1/AKT/GSK3β/β-catenin/CCND1 signaling pathways but not via its canonical role in cell junctions and migration. JAM3 may be an ideal therapeutic target for the eradication of LICs without influencing normal hematopoiesis.

Keywords: Cancer; Hematology; Leukemias; Stem cells.


Conflict of interest statement

Conflict of interest: The authors have declared that no conflict of interest exists.

Figures

Figure 1
Figure 1. JAM3 is highly enriched in LICs and required for their self-renewal abilities.
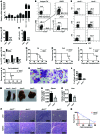
(A) mRNA levels of JAM3 in total BM cells, CMP, GMP, MPP, ST-HSCs, LT-HSCs, YFP+ leukemia cells, YFP+Mac-1+c-Kit+ LICs, and L-GMP cells was measured by quantitative RT-PCR (n = 3). (BD) MLL-AF9+ leukemia cells were evaluated for LIC frequencies and c-Kit expression levels (MFI) in JAM3+ and JAM3 cells (n = 3; ***P < 0.001, Student’s t test). (E) Representative flow cytometric analysis of leukemia cells in the peripheral blood of recipient mice receiving transplants of WT or Jam3-null MLL-AF9+ BM cells upon the first to third transplantation. (F) Quantification data in E (n = 4–5; ***P < 0.001, 2-way ANOVA followed by Bonferroni’s post-test). PB, peripheral blood. (GI) Survival data for recipient mice (lethally irradiated) receiving WT or Jam3-null MLL-AF9+ BM cells upon the first (G), second (H), and third transplantation (I) (n = 4–5; *P < 0.05, **P < 0.01, log-rank test). (J) Survival data for recipient mice (sublethally irradiated) receiving WT or Jam3-null leukemia cells upon the second transplantation (n = 5; ***P < 0.001, log-rank test). (K) Representative images of Giemsa-Wright staining for WT and Jam3-null MLL-AF9+ BM cells upon the second transplantation. (L) Quantification of the frequencies of blast cells in K (n = 3; ***P < 0.001, Student’s t test). (M) Representative images of the sizes of spleens and livers of recipient mice upon the second transplantation. (N and O) Quantification of the weight of spleens and livers in M (n = 4; *P < 0.05, **P < 0.01, Student’s t test). (P) Histological H&E staining of livers and spleens. (Q) Limiting dilution assays comparing the frequencies of LICs in WT and Jam3-null MLL-AF9+ BM cells. Experiments were conducted 3–5 times for validation.
Figure 2
Figure 2. JAM3 promotes the self-renewal of LICs through enhanced cell cycle entry.
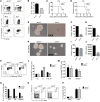
(A) Representative flow cytometric analysis for WT and Jam3-null L-GMP cells of the recipients upon the secondary transplantation. (B) Quantification of frequencies of L-GMP cells in A (n = 3; ***P < 0.001, Student’s t test). (C and D) Survival data for recipient mice receiving WT or Jam3-null L-GMP cells upon the second to third transplantation (n = 5; **P < 0.01, log-rank test). (EG) Representative images of colony formation of WT and Jam3-null YFP+Mac-1+c-Kit+ LICs of the secondary recipients in the first plating (E). The colony numbers (F) and total cell numbers of colonies in E (G) were counted (n = 3; ***P < 0.001, Student’s t test). (HJ) Representative images of colony formation of WT and Jam3-null leukemia cells clonogenically derived from the first plating (H). The colony numbers (I) and total cell numbers of colonies in H (J) were calculated (n = 3; ***P < 0.001, Student’s t test). (K) Cell cycle status was determined in WT and Jam3-null YFP+Mac-1+c-Kit+ LICs of the secondary recipients. (L) Quantitative analysis of the cell cycle distribution in K (n = 4–6; ***P < 0.001, 2-way ANOVA followed by Bonferroni’s post-test). (M) CFSE-labeled WT and Jam3-null leukemia cells of secondary recipients were transplanted and analyzed for the homed CFSE+ cells in the recipients’ BM and spleen (n = 5–6). (N) WT and Jam3-null leukemia cells of secondary recipients were transplanted into the recipient mice by intratibial injection, followed by the examination of leukemia cells 2 weeks later (n = 5; ***P < 0.001, Student’s t test). (O) Representative flow cytometric analysis of apoptosis of WT or Jam3-null YFP+Mac-1+c-Kit+ LICs. (P) Quantification of data in O (n = 4). Experiments were conducted 3–5 times for validation.
Figure 3
Figure 3. JAM3 maintains the CCND1 level to promote the self-renewal of LICs.
(A and B) GO (biological process) and KEGG (pathway) analyses of the microarray data of WT or Jam3-null YFP+Mac-1+c-Kit+ LICs. Candidate changes are highlighted in red. (C) Potential candidates related to self-renewal, cell cycle, and Wnt signaling were examined in WT and Jam3-null LICs by quantitative RT-PCR (n = 3; *P < 0.05, **P < 0.01, ***P < 0.001, Student’s t test). (D) CCND1 levels were compared between WT and Jam3-null YFP+Mac-1+c-Kit+ LICs by immunoblotting. (E) Ccnd1 was ectopically expressed in Jam3-null leukemia cells and injected into recipient mice. Survival was compared among the mice receiving WT cells, Jam3-null cells, and Ccnd1-overexpressing WT or Jam3-null cells (n = 5–6; ***P < 0.001, log-rank test). (F) CCND1 levels were validated in leukemia cells from the rescue experiment in E. (G) The cell cycle distribution in YFP+Mac-1+c-Kit+ LICs from the rescue experiment in E was determined using Ki-67 and Hoechst 33342 staining (n = 3–5; *P < 0.05, **P < 0.01, 2-way ANOVA followed by Bonferroni’s post-test). Experiments were conducted 3–5 times for validation.
Figure 4
Figure 4. JAM3 collaborates with LRP5 to activate β-catenin/CCND1 signaling.
(A) Phospho–β-catenin (S552) and total β-catenin levels were evaluated between WT and Jam3-null YFP+Mac-1+c-Kit+ LICs by immunoblotting. (B) β-Catenin levels were compared between WT and Jam3-null YFP+Mac-1+c-Kit+ LICs by immunofluorescence staining. Scale bars: 5 µm. (C) A constitutively active form of phospho–β-catenin (S37A, β-cateninCN) was subcloned in the pCDH-EF1a-T2A-mCherry vector and ectopically expressed in Jam3-null leukemia cells, which were then injected into recipient mice. Survival was compared among the mice receiving WT cells, Jam3-null cells, and β-cateninCN–overexpressing WT or Jam3-null cells (n = 5–6; *P < 0.05, **P < 0.01, log-rank test). (D) Phospho–β-catenin (S552) and total β-catenin levels were validated in leukemia cells from the rescue experiment in C. (E) The cell cycle distribution in YFP+Mac-1+c-Kit+ LICs from the rescue experiment in C was determined using Ki-67 and Hoechst 33342 staining (n = 3; ***P < 0.001, 2-way ANOVA followed by Bonferroni’s post-test). (F) StrepII-tagged JAM3 and FLAG-tagged LRP5 were overexpressed in 293T cells, and their lysates were coimmunoprecipitated by strepII beads, followed by Western blotting analysis for FLAG (LRP5). (G) A reverse coimmunoprecipitation experiment was performed after LRP5-FLAG pull-down, followed by Western blotting analysis for strepII (JAM3). The empty vector was used as the control. Experiments were conducted 3 times for validation.
Figure 5
Figure 5. LRP5 interacts with PDK1 to activate AKT signaling to inhibit GSK3β.
(A) Protein levels of phospho-PDK1 (S241), PDK1, phospho-AKT (T308), AKT, phospho-GSK3β (S9), and GSK3β were measured in WT and Jam3-null YFP+Mac-1+c-Kit+ LICs by immunoblotting. (B) V5-tagged PDK1 and FLAG-tagged LRP5 were overexpressed in 293T cells, and their lysates were coimmunoprecipitated by V5 antibodies and protein A/G beads, followed by Western blotting analysis for FLAG (LRP5). (C) A reverse coimmunoprecipitation experiment was performed after LRP5-FLAG pull-down, followed by Western blotting analysis for PDK1 (V5). (D) A constitutively active form of phospho-AKT (E17K, AKTCN) was subcloned into pCDH-EF1a-T2A-mCherry vector and ectopically expressed in Jam3-null leukemia cells, followed by injection into recipient mice. Survival was compared among the mice receiving WT cells, Jam3-null cells, and AKTCN-overexpressing WT or Jam3-null cells (n = 5–7; **P < 0.01, ***P < 0.001, log-rank test). (E) Phospho-AKT (T308) and AKT levels were validated in leukemia cells from the rescue experiment in D. (F) The cell cycle distribution in YFP+Mac-1+c-Kit+ LICs from the rescue experiment in D was determined using Ki-67 and Hoechst 33342 staining (n = 3; ***P < 0.001, 2-way ANOVA followed by Bonferroni’s post-test). The empty vector was used as the control. Experiments were conducted 3 times for validation.
Figure 6
Figure 6. JAM3 is required for the proliferation of human leukemia cell lines.
(A) Representative flow cytometric analysis of JAM3 expression on different leukemia cell lines including Kasumi-1 (M2), HL-60 (M3), THP-1 (M5), U937 (M5), and MV4-11 (M5). (Isotype control, gray line). (B) FLAG-tagged JAM3 and shRNAs targeting JAM3 (sh997, sh1188, sh359, and sh731) were cotransfected into 293T cells (1:4 ratio), followed by immunoblotting for JAM3. (C) Representative images of JAM3-knockdown (sh731 and sh1188) THP-1 cells after 6 days in culture. (DG) The numbers of THP-1, U937, Kasumi-1, and HL-60 cells were counted at the indicated days after infection with the JAM3-targeting sh731 or sh1188 or scrambled shRNA (n = 3; *P < 0.05, **P < 0.01, ***P < 0.001, 2-way ANOVA followed by Bonferroni’s post-test). (H) Representative images of colonies formed by the JAM3-knockdown (sh731 and sh1188) THP-1 cells after 9 days of culture in 1640 medium supplemented with 0.9% of methylcellulose and 10% of FBS. (I) Quantification of colony numbers in H (n = 3; **P < 0.01, ***P < 0.001, 1-way ANOVA followed by Bonferroni’s post-test). (J) Representative flow cytometric analysis of the cell cycle distribution in THP-1 cells targeted by sh731, sh1188, or scrambled shRNA, which was determined using BrdU incorporation. (K) Quantitative analysis of the cell cycle distribution results in J (n = 3; *P < 0.05, **P < 0.01, ***P < 0.001, 2-way ANOVA followed by Bonferroni’s post-test). Experiments were conducted 3–5 times for validation.
Figure 7
Figure 7. JAM3 supports the growth of human acute myeloid LICs.
(A) Representative flow cytometric analysis of JAM3 expression on the immunophenotypic LinCD34+CD38CD90CD45RA+ LICs (LMPP cells) and CD34CD38 differentiated human AML cells (AML#7 in Supplemental Table 2). (B) Quantification of the MFIs for JAM3 expression on LMPP cells or CD34CD38 differentiated leukemia cells in A (AML#2, #5, #6, #8 in Supplemental Table 2; n = 5; *P < 0.05, Student’s t test). (C) Quantification of the relative frequency of JAM3+ cells in LMPP or CD34CD38 differentiated leukemia cells in A (n = 5; *P < 0.05, Student’s t test). (DH) Cell numbers of 5 patient AML samples were counted at the indicated days after knockdown of JAM3 by sh1188 or scrambled shRNA (AML#1–AML#5 in Supplemental Table 2; n = 3; **P < 0.01, ***P < 0.001, 2-way ANOVA followed by Bonferroni’s post-test). Experiments were conducted 3–5 times for validation.

References

    1. Hutchinson L. Immunotherapy: CAR-modified T cells targeting CD19-curing the incurable. Nat Rev Clin Oncol. 2014;11(12):683. - PubMed
    1. Kochenderfer JN, et al. Chemotherapy-refractory diffuse large B-cell lymphoma and indolent B-cell malignancies can be effectively treated with autologous T cells expressing an anti-CD19 chimeric antigen receptor. J Clin Oncol. 2015;33(6):540–549. doi: 10.1200/JCO.2014.56.2025. - DOI - PMC - PubMed
    1. Majeti R, et al. CD47 is an adverse prognostic factor and therapeutic antibody target on human acute myeloid leukemia stem cells. Cell. 2009;138(2):286–299. doi: 10.1016/j.cell.2009.05.045. - DOI - PMC - PubMed
    1. Chao MP, et al. Therapeutic antibody targeting of CD47 eliminates human acute lymphoblastic leukemia. Cancer Res. 2011;71(4):1374–1384. doi: 10.1158/0008-5472.CAN-10-2238. - DOI - PMC - PubMed
    1. Zheng J, et al. Inhibitory receptors bind ANGPTLs and support blood stem cells and leukaemia development. Nature. 2012;485(7400):656–660. doi: 10.1038/nature11095. - DOI - PMC - PubMed

Publication types

MeSH terms