. 2018 May 1;128(5):1752-1771.
doi: 10.1172/JCI94584. Epub 2018 Mar 26.

Blocking fatty acid-fueled mROS production within macrophages alleviates acute gouty inflammation

Affiliations

Blocking fatty acid-fueled mROS production within macrophages alleviates acute gouty inflammation

Christopher J Hall et al. J Clin Invest. .

Abstract

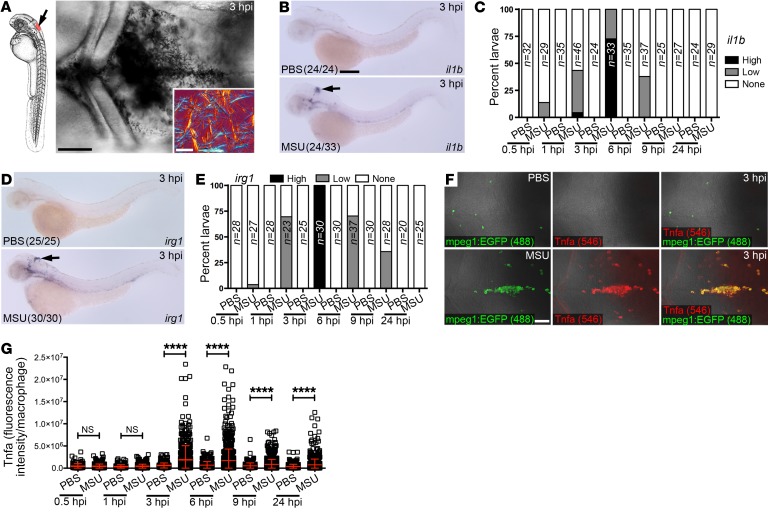
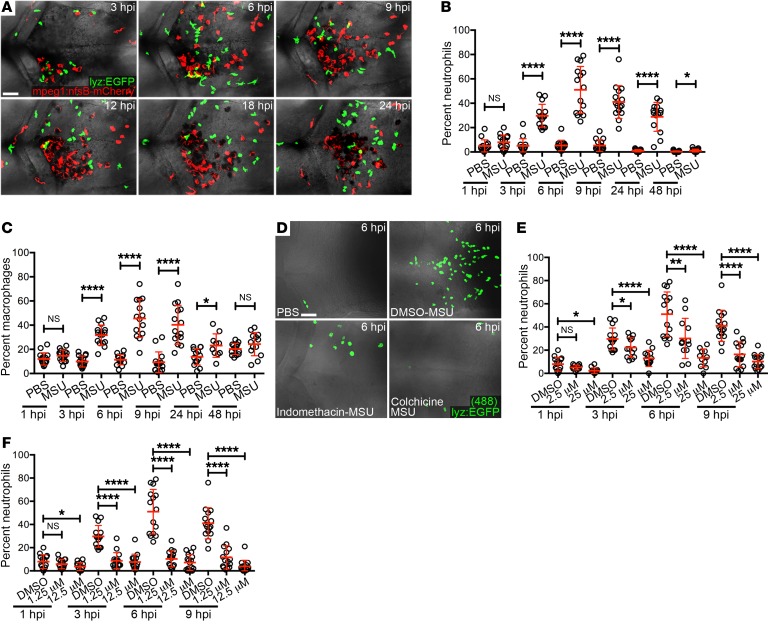
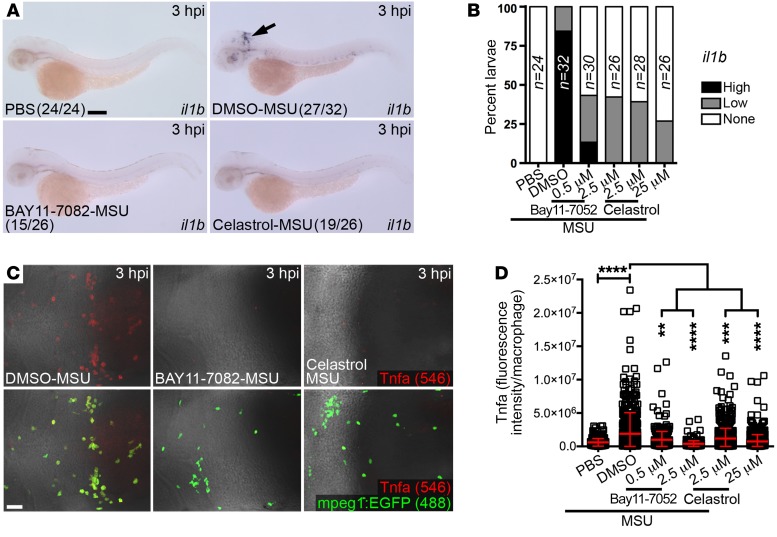
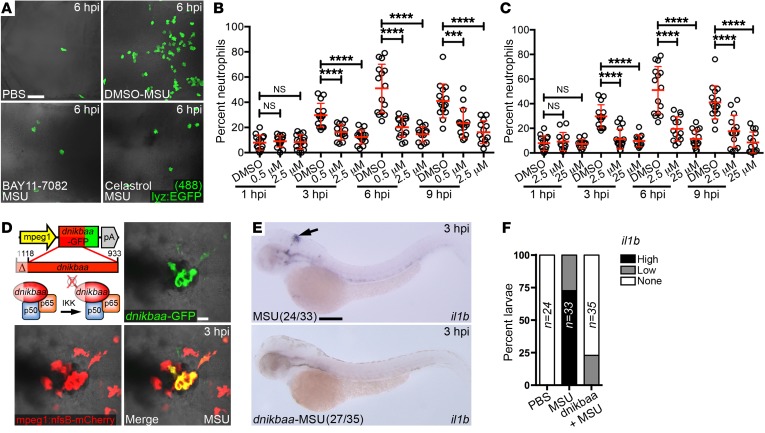
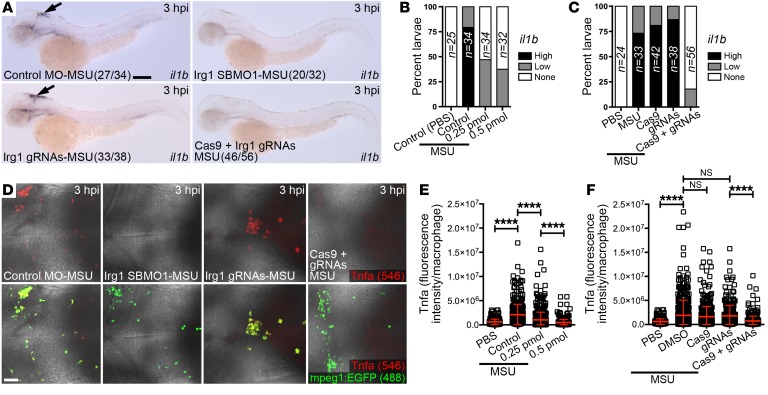
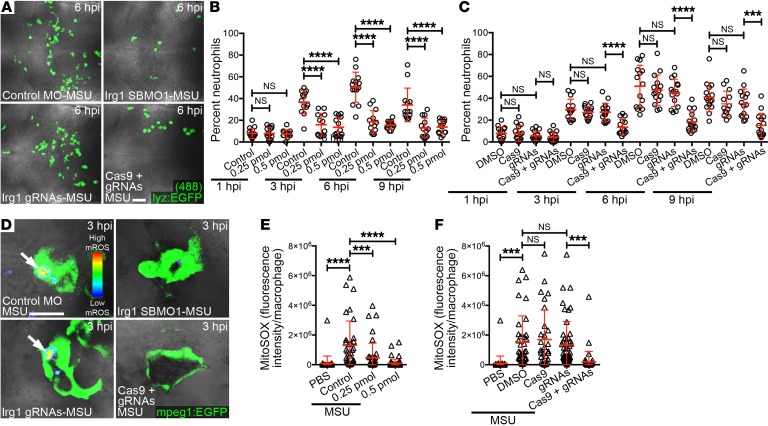
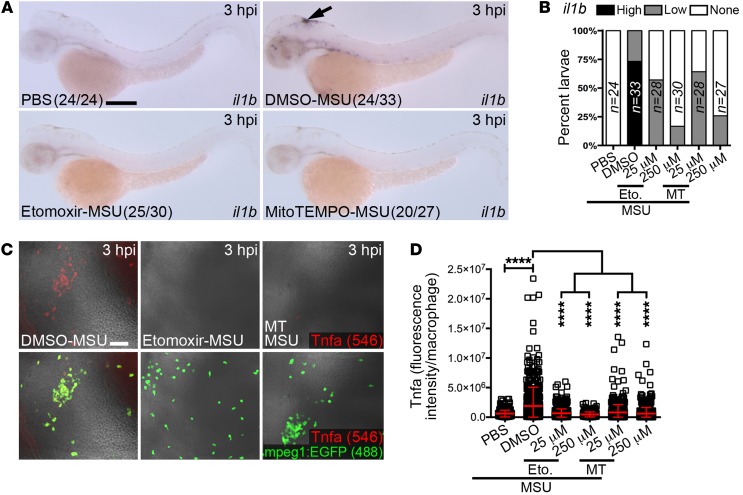
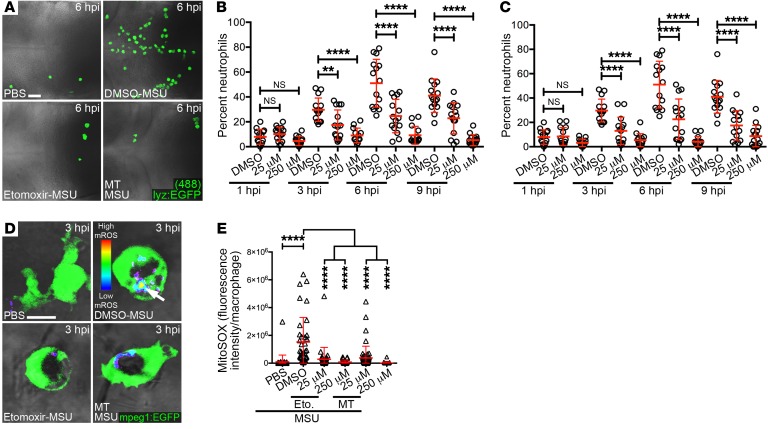
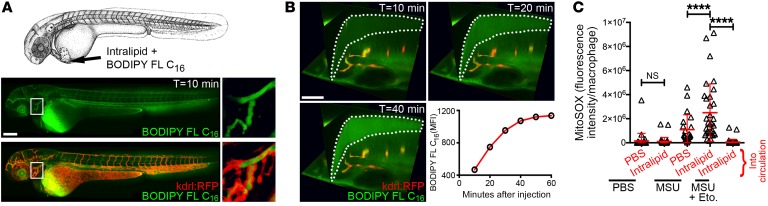
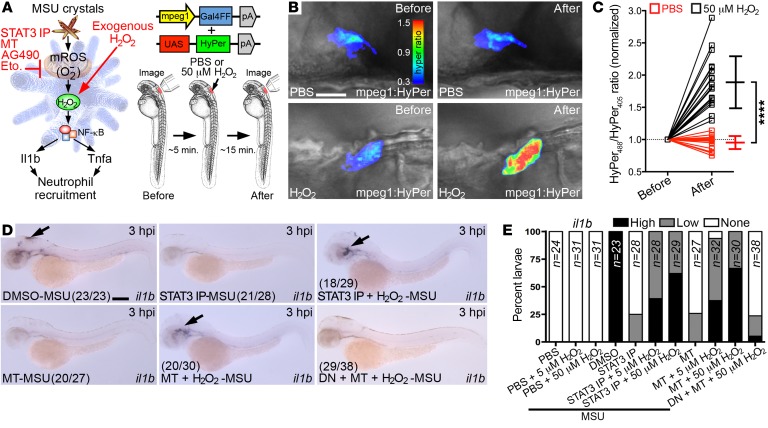
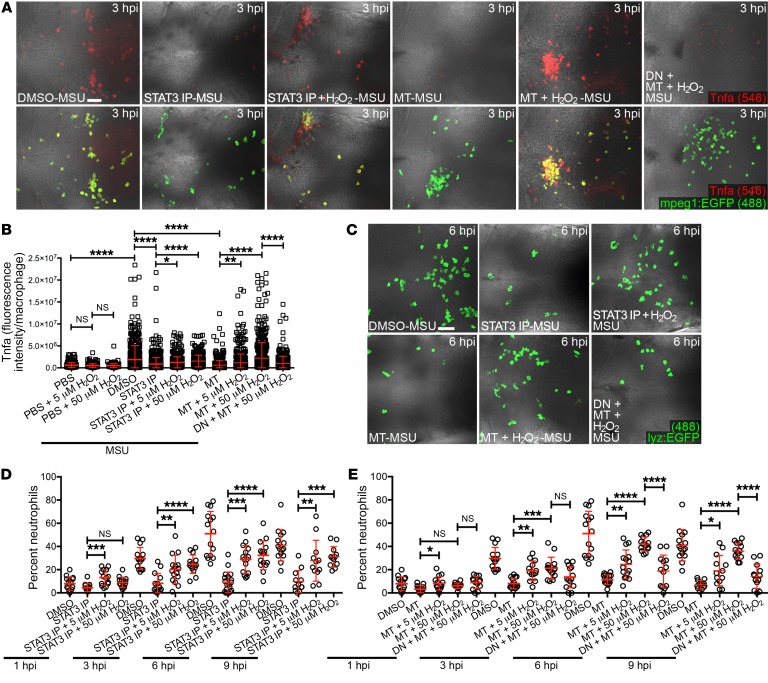
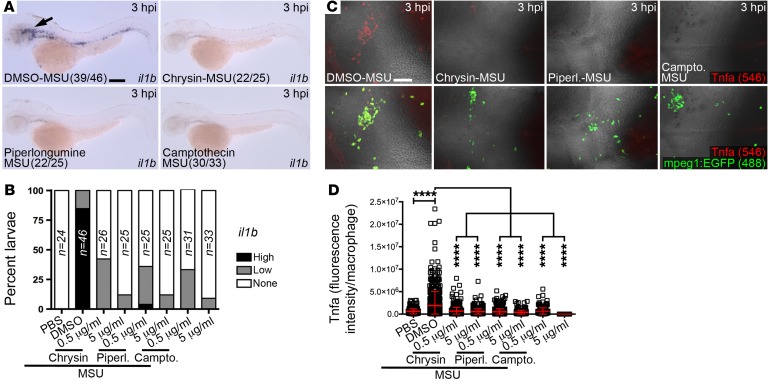
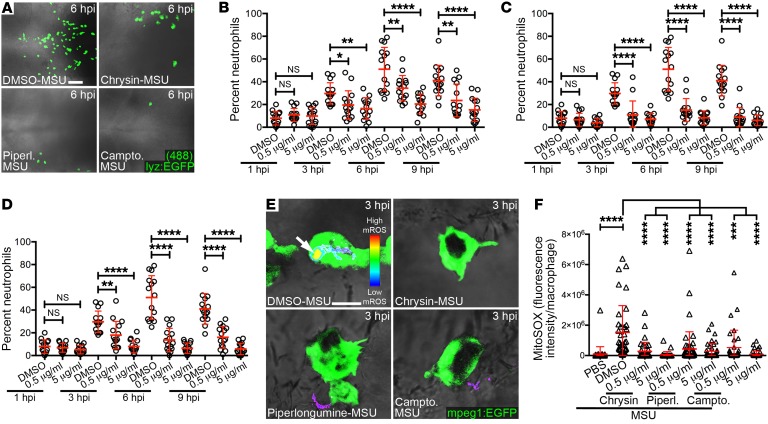
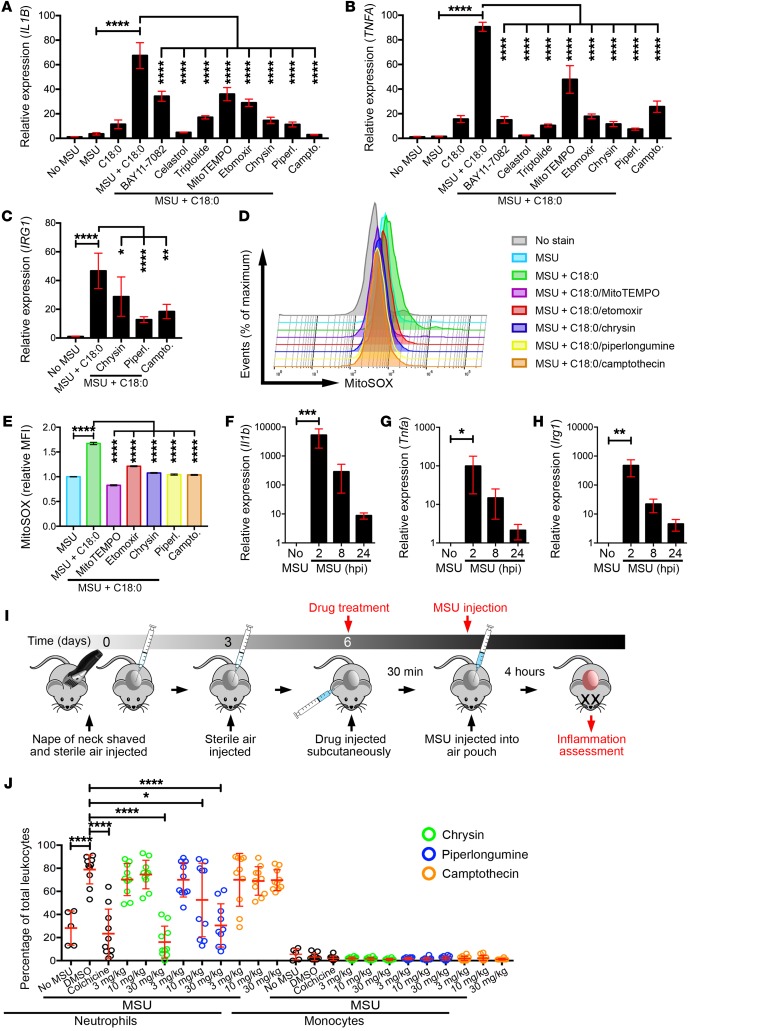
Gout is the most common inflammatory arthritis affecting men. Acute gouty inflammation is triggered by monosodium urate (MSU) crystal deposition in and around joints that activates macrophages into a proinflammatory state, resulting in neutrophil recruitment. A complete understanding of how MSU crystals activate macrophages in vivo has been difficult because of limitations of live imaging this process in traditional animal models. By live imaging the macrophage and neutrophil response to MSU crystals within an intact host (larval zebrafish), we reveal that macrophage activation requires mitochondrial ROS (mROS) generated through fatty acid oxidation. This mitochondrial source of ROS contributes to NF-κB-driven production of IL-1β and TNF-α, which promote neutrophil recruitment. We demonstrate the therapeutic utility of this discovery by showing that this mechanism is conserved in human macrophages and, via pharmacologic blockade, that it contributes to neutrophil recruitment in a mouse model of acute gouty inflammation. To our knowledge, this study is the first to uncover an immunometabolic mechanism of macrophage activation that operates during acute gouty inflammation. Targeting this pathway holds promise in the management of gout and, potentially, other macrophage-driven diseases.

Keywords: Arthritis; Immunology; Inflammation; Innate immunity; Macrophages.


Conflict of interest statement

Conflict of interest: The authors have declared that no conflict of interests exists.

Figures

Figure 1
Figure 1. MSU crystals activate zebrafish macrophages.
(A) Injection site and dorsal hindbrain view following MSU crystal injection (inset shows crystals under polarized light). (B) Expression of il1b within PBS- and MSU crystal–injected larvae. (C) Temporal quantification of il1b expression was categorized as high (B), low (Supplemental Figure 1C), or no expression (None). (D) Expression of irg1 within PBS- and MSU crystal–injected larvae. (E) Temporal quantification of irg1 expression: high (D), low (Supplemental Figure 1C), or no expression. (F) Immunofluorescence of Tnfa within the hindbrain of PBS- and MSU crystal–injected 1% DMSO–treated Tg(mpeg1:EGFP) larvae and temporal quantification in individual macrophages (G). n = 15 larvae/treatment. Arrows mark il1b/irg1 expression in the hindbrain. The numbers in parentheses in B and D indicate the frequency of larvae with the indicated phenotype.Data were pooled from 2 independent experiments and represent the mean ± SD. ****P < 0.0001, by Student’s t test. Scale bars: 50 μm (A and F), 5 μm (A, inset), and 100 μm (B). Magnification value ×6 (D).
Figure 2
Figure 2. MSU crystals stimulate leukocyte recruitment.
(A) Time-lapse imaging of neutrophil and macrophage recruitment to MSU crystals in Tg(lyz:EGFP;mpeg1:nfsB-mCherry) larvae. (B and C) Temporal quantification of neutrophils (B) and macrophages (C) in the hindbrains of PBS- and MSU crystal–injected, 1% DMSO–treated Tg(lyz:EGFP) and Tg(mpeg1:EGFP) larvae, respectively (n = 13–15 larvae/treatment). (D) Immunofluorescence detection of neutrophils in the hindbrains of PBS-injected and DMSO-, indomethacin- and colchicine-treated MSU crystal–injected Tg(lyz:EGFP) larvae. (E and F) Temporal quantification of neutrophils, as detected in D, for indomethacin (E) and colchicine (F) treatments (n = 13–15 larvae/treatment). DMSO-MSU samples are the same as in B. All data were pooled from 2 independent experiments and represent the mean ± SD. *P < 0.05, **P < 0.01, and ****P < 0.0001, by Student’s t test (B and C) and 1-way ANOVA with Dunnett’s post hoc test (E and F). Scale bars: 50 μm (A and D).
Figure 3
Figure 3. Macrophage activation is dependent on NF-κB signaling.
(A) Expression of il1b in PBS-injected and MSU crystal–injected larvae treated with DMSO, BAY11-7082, or celastrol. Arrow indicates il1b expression in hindbrain. The numbers in parentheses indicate the frequency of larvae with the indicated phenotype.(B) Quantification of il1b expression, as detected in A. (C) Immunofluorescence of Tnfa in the hindbrains of MSU crystal–injected DMSO, BAY11-7082–, and celastrol-treated Tg(mpeg1:EGFP) larvae. (D) Quantification of Tnfa, as detected in C (n = 15 larvae/treatment). The DMSO-MSU sample was the same as in Figure 1G (3 hpi). Data were pooled from 2 independent experiments and represent the mean ± SD. **P < 0.01, ***P < 0.001, and ****P < 0.0001, by 1-way ANOVA with Dunnett’s post hoc test. Scale bars: 100 μm (A), 50 μm (C).
Figure 4
Figure 4. Neutrophil recruitment is dependent on NF-κB signaling by macrophages.
(A) Immunofluorescence detection of neutrophils in the hindbrains of PBS-injected and MSU crystal–injected DMSO-, BAY11-7082–, and celastrol-treated Tg(lyz:EGFP) larvae. The DMSO-MSU image is the same as in Supplemental Figure 3B. (B and C) Temporal quantification of neutrophils, as detected in A, for BAY11-7082 (B) and celastrol (C) treatments (n = 13–15 larvae/treatment). The DMSO-MSU samples are the same as in Figure 2, B, E, and F, and Supplemental Figure 3D. (D) Schematic of the macrophage-specific dominant-negative IκBaa (dnikbaa) construct and expression within MSU crystal–injected Tg(mpeg1:nfsB-mCherry) larvae. (E) Expression of il1b in WT and mpeg1:dnikbaa-GFP–injected larvae following MSU crystal injection. The MSU image is the same as in Figure 1B. The numbers in parentheses indicate the frequency of larvae with the indicated phenotype. (F) Quantification of il1b expression as detected in E. The MSU sample is the same as in Figure 1C (3 hpi). The arrow marks il1b expression in hindbrain. Data were pooled from 2 independent experiments and represent the mean ± SD. ***P < 0.001 and ****P < 0.0001, by 1-way ANOVA with Dunnett’s post hoc test. Scale bars: 50 μm (A) and 100 μm (E).
Figure 5
Figure 5. Irg1 contributes to MSU crystal–driven macrophage activation.
(A) Expression of il1b in control MO–, Irg1 SBMO1–, Irg1 gRNA–, and Cas9 plus Irg1 gRNA–injected larvae following MSU crystal injection. The numbers in parentheses indicate the frequency of larvae with the indicated phenotype. (B and C) Quantification of il1b expression, as detected in A, for Irg1 SBMO1–injected (B) and CRISPR-Cas9 F0 irg1 mutants (C). The MSU sample in C is the same as in Figure 1C (3 hpi) and Figure 4F. (D) Immunofluorescence of Tnfa in the hindbrains of control MO–, Irg1 SBMO1–, Irg1 gRNA–, and Cas9 plus Irg1 gRNA–injected Tg(mpeg1:EGFP) larvae following MSU crystal injection. The control MO-MSU image is the same as in Supplemental Figure 3E and Supplemental Figure 4F. (E and F) Quantification of Tnfa, as detected in D, for Irg1 SBMO1–injected (E) and CRISPR-Cas9 F0 irg1 mutants (F). n = 15 larvae/treatment. The control MO-MSU sample in E is the same as in Supplemental Figure 3F and Supplemental Figure 4G. The DMSO-MSU sample in F is the same as in Figure 1G (3 hpi); Figure 3D; and Supplemental Figure 5, D and H. Data were pooled from 2 independent experiments and represent the mean ± SD. ****P < 0.0001, by 1-way ANOVA with Dunnett’s post hoc test. Scale bars: 100 μm (A) and 50 μm (D).
Figure 6
Figure 6. Irg1 contributes to MSU crystal–driven neutrophil recruitment and macrophage-specific mROS production.
(A) Immunofluorescence detection of neutrophils in the hindbrains of control MO–, Irg1 SBMO1–, Irg1 gRNA–, and Cas9 plus Irg1 gRNA–injected Tg(lyz:EGFP) larvae following MSU crystal injection. The control MO-MSU image is the same as in Supplemental Figure 3, B and G, and Supplemental Figure 4H. (B and C) Temporal quantification of neutrophils in the hindbrain, as detected in A, for Irg1 SBMO1–injected (B) and CRISPR-Cas9 F0 irg1 mutants (C). n = 13–15 larvae/treatment. The control MO-MSU samples in B are the same as in Supplemental Figure 3, C, H, I, and Supplemental Figure 4I. The DMSO-MSU samples in C are the same as in Figure 2, B, E, and F; Figure 4, B and C; Supplemental Figure 3D; and Supplemental Figure 5, F and J. (D) Macrophage mROS production (white arrows) in the hindbrains of control MO–, Irg1 SBMO1–, Irg1 gRNA–, and Cas9 plus Irg1 gRNA–injected Tg(mpeg1:EGFP) larvae following MSU crystal injection (MitoSOX signal is displayed as a heatmap, with warmer colors representing higher levels of mROS). (E and F) Quantification of macrophage-specific mROS production, as detected in D, for Irg1 SBMO1-injected (E) and CRISPR-Cas9 F0 irg1 mutants (F). n = 10 larvae/treatment. Data were pooled from 2 independent experiments and represent the mean ± SD. ***P < 0.001 and ****P < 0.0001, by 1-way ANOVA, Dunnett’s post hoc test. Scale bars: 50 μm (A) and 10 μm (D).
Figure 7
Figure 7. FAO and mROS production contributes to MSU crystal–driven macrophage activation.
(A) Expression of il1b in PBS-injected and MSU crystal–injected DMSO-, etomoxir-, and MitoTEMPO-treated larvae. The PBS and DMSO-MSU images are the same as in Figure 1B, Supplemental Figure 1G, and Supplemental Figure 7A, respectively. Arrow indicates il1b expression in the hindbrain. The numbers in parentheses indicate the frequency of larvae with the indicated phenotype. (B) Quantification of il1b expression, as detected in A. The DMSO-MSU sample is the same as in Supplemental Figure 7C. (C) Immunofluorescence of Tnfa in the hindbrains of MSU crystal–injected DMSO-, etomoxir- and MitoTEMPO-treated Tg(mpeg1:EGFP) larvae. The DMSO-MSU image is the same as in Supplemental Figure 5G. (D) Quantification of Tnfa, as detected in C (n = 15 larvae/treatment). The DMSO-MSU sample is the same as in Figure 1G (3 hpi), Figure 3D; Figure 5F; Supplemental Figure 5, D and H; and Supplemental Figure 7E. Data were pooled from 2 independent experiments and represent the mean ± SD. ****P < 0.0001, by 1-way ANOVA with Dunnett’s post hoc test. Scale bars: 100 μm (A), 50 μm (C). Eto., etomoxir; MT, MitoTEMPO.
Figure 8
Figure 8. FAO and mROS production contributes to MSU crystal–driven neutrophil recruitment.
(A) Immunofluorescence detection of neutrophils in the hindbrains of MSU crystal–injected DMSO-, etomoxir-, and MitoTEMPO-treated Tg(lyz:EGFP) larvae. The DMSO-MSU image is the same as in Supplemental Figure 7F. (B and C) Temporal quantification of neutrophils, as detected in A, for etomoxir (B) and MitoTEMPO (C) treatments (n = 13–15 larvae/treatment). The DMSO-MSU samples are the same as in Figure 2, B, E, and F; Figure 4, B and C; Figure 6C; Supplemental Figure 3D; Supplemental Figure 5, F and J; and Supplemental Figure 7G. (D) Macrophage mROS production (white arrow) in the hindbrains of MSU crystal–injected DMSO-, etomoxir-, and MitoTEMPO-treated Tg(mpeg1:EGFP) larvae (MitoSOX signal is displayed as a heatmap, with warmer colors representing higher levels of mROS). The PBS image is the same as in Supplemental Figure 7H. (E) Quantification of macrophage-specific mROS production, as detected in D (n = 10 larvae/treatment). The DMSO-MSU sample is the same as in Figure 6F and Supplemental Figure 7I. Data were pooled from 2 independent experiments and represent the mean ± SD. **P < 0.01 and ****P < 0.0001, by 1-way ANOVA with Dunnett’s post hoc test. Scale bars: 50 μm (A) and 10 μm (D).
Figure 9
Figure 9. Intravenous delivery of intralipid elevated MSU crystal–driven macrophage-specific mROS production through a FAO-dependent mechanism.
(A) Live imaging of a Tg(kdrl:RFP) larva following injection of intralipid, supplemented with BODPIY FL C16, into the sinus venosus (insets show magnified views of the boxed areas). (B) X/Y/Z views of hindbrain of a Tg(kdrl:RFP) larva, as treated in A, showing accumulation of BODPIY FL C16 in the hindbrain ventricle (dashed lines) and temporal quantification of BODPIY FL C16 MFI in the hindbrain. (C) Quantification of macrophage-specific mROS production (MitoSOX signal) in the hindbrains of PBS- or MSU crystal–injected Tg(mpeg1:EGFP) larvae following delivery of PBS or intralipid into the circulation (n = 10 larvae/treatment). Data for C were pooled from 2 independent experiments. All data represent the mean ± SD. ****P < 0.0001, by 1-way ANOVA with Dunnett’s post hoc test. Scale bars: 100 μm (A) and 50 μm (B) .
Figure 10
Figure 10. Exogenous H2O2 can rescue MSU crystal–driven il1b expression following endogenous mROS depletion.
(A) Schematic of H2O2 rescue strategy (following STAT3 IP–, MitoTEMPO-, AG490-, and etomoxir-mediated endogenous mROS depletion) and constructs for live imaging of macrophage H2O2 levels. (B) Ratiometric HyPer imaging (488/405 nm ratio is displayed as a heatmap, with warmer colors representing higher H2O2 levels) of H2O2 in single hindbrain macrophages from mpeg1:Gal4FF/UAS:HyPer-injected larvae before and after injection of PBS or 50 μM H2O2. (C) Quantification of HyPer ratios as detected in B, measured as normalized maximum 488/405 nm ratios within individual macrophages (n = 4 larvae/treatment). (D) Expression of il1b in MSU crystal–injected larvae treated with DMSO, STAT3 IP (125 μM), MitoTEMPO (250 μM) (with and without coinjection of 50 μM H2O2), or dnikbaa (DN) with MitoTEMPO (250 μM) plus H2O2 (50 μM). Arrows mark il1b expression in hindbrain. The numbers in parentheses represent the frequency of larvae with the indicated phenotype. (E) Quantification of il1b expression, as detected in D. Data were pooled from 2 independent experiments and represent the mean ± SD. ****P < 0.0001, by Student’s t test. Scale bars: 10 μm (B) and 100 μm (D).
Figure 11
Figure 11. Exogenous H2O2 can rescue MSU crystal–driven macrophage-specific Tnfa production and neutrophil recruitment following endogenous mROS depletion.
(A) Immunofluorescence of Tnfa in the hindbrains of MSU crystal–injected Tg(mpeg1:EGFP) larvae treated with DMSO, STAT3 IP (125 μM), MitoTEMPO (250 μM) (with and without coinjection of 50 μM H2O2), or dnikbaa with MitoTEMPO (250 μM) plus 50 μM H2O2. The DMSO-MSU image is the same as in Figure 3C, Supplemental Figure 5C, and Supplemental Figure 7D. (B) Quantification of Tnfa, as detected in A (n = 15 larvae/treatment). The DMSO-MSU sample is the same as in Figure 1G (3 hpi); Figure 3D; Figure 5F; Figure 7D; Supplemental Figure 5, D and H; and Supplemental Figure 7E. (C) Immunofluorescence detection of neutrophils in the hindbrains of MSU crystal–injected Tg(lyz:EGFP) larvae treated with DMSO, SAT3 IP (125 μM), MitoTEMPO (250 μM) (with and without coinjected 50 μM H2O2), or dnikbaa with MitoTEMPO (250 μM) plus 50 μM H2O2. The DMSO-MSU image is the same as in Figure 4A; Supplemental Figure 3B; and Supplemental Figure 5E. (D and E) Quantification of neutrophils, as detected in C, for STAT3 IP and H2O2 treatments (D) and MitoTEMPO, H2O2, and dnikbaa treatments (E) (n = 13–15 larvae/treatment). The DMSO-MSU samples are the same as in Figure 2, B, E, and F; Figure 4, B and C; Figure 6C; Figure 8, B and C; Supplemental Figure 3D; Supplemental Figure 5, F and J; Supplemental Figure 7G. Data were pooled from 2 independent experiments. Data represent the mean ± SD. *P < 0.05, **P < 0.01, ***P < 0.001, and ****P < 0.0001, by 1-way ANOVA with Dunnett’s post hoc test. Scale bars: 50 μm (A and C).
Figure 12
Figure 12. Drugs that inhibit irg1 expression suppress MSU crystal–driven macrophage activation.
(A) Expression of il1b in MSU crystal–injected DMSO-, chrysin-, piperlongumine-, and camptothecin-treated larvae. Black arrow marks il1b expression in hindbrain. The numbers in parentheses represent the frequency of larvae with the indicated phenotype. (B) Quantification of il1b expression, as detected in A. (C) Immunofluorescence of Tnfa in the hindbrains of MSU crystal–injected DMSO-, chrysin-, piperlongumine-, and camptothecin-treated Tg(mpeg1:EGFP) larvae. The DMSO-MSU image is the same as in Figure 7C and Supplemental Figure 5G. (D) Quantification of Tnfa, as detected in C (n = 15 larvae/treatment). The DMSO-MSU sample is the same as in Figure 1G (3 hpi); Figure 3D; Figure 5F; Figure 7D; Figure 11B; Supplemental Figure 5, D and H; Supplemental Figure 7E; and Supplemental Figure 9E. Data were pooled from 2 independent experiments and represent the mean ± SD. ****P < 0.0001, by 1-way ANOVA with Dunnett’s post hoc test. Scale bars: 100 μm (A) and 50 μm (C). Campto., camptothecin; Piperl., piperlongumine.
Figure 13
Figure 13. Drugs that inhibit irg1 expression suppress MSU crystal–driven neutrophil recruitment and macrophage-specific mROS production.
(A) Immunofluorescence detection of neutrophils in MSU crystal–injected DMSO-, chrysin-, piperlongumine-, and camptothecin-treated Tg(lyz:EGFP) larvae. The DMSO-MSU image is the same as in Figure 2D and Supplemental Figure 5I. (BD) Quantification of neutrophils, as detected in A, for chrysin (B), piperlongumine (C), and camptothecin (D) treatments (n = 13–15 larvae/treatment). The DMSO-MSU samples are the same as in Figure 2, B, E, and F; Figure 4, B and C; Figure 6C; Figure 8, B and C; Figure 11, D and E; Supplemental Figure 3D; Supplemental Figure 5, F and J; Supplemental Figure 7G; and Supplemental Figure 10, B and C. (E) Macrophage mROS production (white arrow) in the hindbrains of MSU crystal–injected DMSO-, chrysin-, piperlongumine-, and camptothecin-treated Tg(mpeg1:EGFP) larvae (MitoSOX signal is displayed as a heatmap, with warmer colors representing higher levels of mROS). (F) Quantification of macrophage-specific mROS production, as detected in E (n = 10 larvae/treatment). The DMSO-MSU sample is the same as in Figure 6F; Figure 8E; Supplemental Figure 7I; and Supplemental Figure 8, B and C. Data were pooled from 2 independent experiments and represent the mean ± SD. *P < 0.05, **P < 0.01, ***P < 0.001, and ****P < 0.0001, by 1-way ANOVA with Dunnett’s post hoc test. Scale bars: 50 μm (A) and 10 μm (E).
Figure 14
Figure 14. Stearic acid (C18:0) augments MSU crystal–stimulated expression of IL1B and TNFA expression in THP-1 cells through FAO-driven mROS production, and drugs that inhibit Irg1 expression suppress neutrophil recruitment in a murine air pouch model of acute gouty inflammation.
(A and B) Expression of IL1B (A) and TNFA (B) in THP-1 cells stimulated with MSU crystals, C18:0, MSU crystals plus C18:0, and MSU crystal plus C18:0 in the presence of BAY11-7082, celastrol, triptolide, MitoTEMPO, etomoxir, chrysin, piperlongumine, or camptothecin 6 hours after stimulation, relative to the no–MSU crystals control (qPCR, n = 5 biological replicates). (C) Expression of IRG1 in THP-1 cells stimulated with MSU crystals plus C18:0 alone and in the presence of chrysin, piperlongumine, or camptothecin, measured after 6 hours of stimulation, relative to the no–MSU crystals control (qPCR, n = 5 biological replicates). (D) Representative flow cytometric data showing MitoSOX fluorescence in THP-1 cells stimulated with MSU crystals, MSU crystals plus C18:0, and MSU crystals plus C18:0 in the presence of MitoTEMPO, etomoxir, chrysin, piperlongumine, or camptothecin, measured after 6 hours of stimulation (displayed as counts, percentage of maximum). (E) Quantification of MitoSOX signal (MFI), as detected in D, relative to MSU crystal–treated cells (n = 5 biological replicates). (FH) Temporal expression of Il1b (F), Tnfa (G), and Irg1 (H) in peritoneal monocytes isolated from mice following intraperitoneal injection of MSU crystals, relative to the no–MSU crystals control (qPCR, n = 5 mice/treatment). (I) Schematic of murine MSU crystal air pouch model of acute gouty inflammation and drug treatment strategy. (J) Effects of chrysin, piperlongumine, and camptothecin on neutrophil and monocyte numbers (measured as a percentage of leukocytes) in the murine MSU crystal air pouch model (n = 5 mice for the no–MSU crystals control; n = 10 mice for all other treatments). Data represent the mean ± SD. *P < 0.05, **P < 0.01, ***P < 0.001, and ****P < 0.0001, by 1-way ANOVA with Dunnett’s post hoc test (AC, E, and J) and Kruskal-Wallis test (FH).

References

    1. Zhu Y, Pandya BJ, Choi HK. Prevalence of gout and hyperuricemia in the US general population: the National Health and Nutrition Examination Survey 2007–2008. Arthritis Rheum. 2011;63(10):3136–3141. doi: 10.1002/art.30520. - DOI - PubMed
    1. Faires JS, McCarty DJ. Acute arthritis in man and dog after intrasynovial injection of sodium urate crystals. Lancet. 1962;280:682–685. doi: 10.1016/S0140-6736(62)90501-9. - DOI - PubMed
    1. Lindsay K, Gow P, Vanderpyl J, Logo P, Dalbeth N. The experience and impact of living with gout: a study of men with chronic gout using a qualitative grounded theory approach. J Clin Rheumatol. 2011;17(1):1–6. doi: 10.1097/RHU.0b013e318204a8f9. - DOI - PubMed
    1. Dalbeth N, Merriman TR, Stamp LK. Gout. Lancet. 2016;388(10055):2039–2052. doi: 10.1016/S0140-6736(16)00346-9. - DOI - PubMed
    1. Kuncl RW, Duncan G, Watson D, Alderson K, Rogawski MA, Peper M. Colchicine myopathy and neuropathy. N Engl J Med. 1987;316(25):1562–1568. doi: 10.1056/NEJM198706183162502. - DOI - PubMed

Publication types

MeSH terms