. 2018 Mar 27;16(3):e2003904.
doi: 10.1371/journal.pbio.2003904. eCollection 2018 Mar.

Evaluation of e-liquid toxicity using an open-source high-throughput screening assay

Affiliations

Evaluation of e-liquid toxicity using an open-source high-throughput screening assay

M Flori Sassano et al. PLoS Biol. .

Abstract

The e-liquids used in electronic cigarettes (E-cigs) consist of propylene glycol (PG), vegetable glycerin (VG), nicotine, and chemical additives for flavoring. There are currently over 7,700 e-liquid flavors available, and while some have been tested for toxicity in the laboratory, most have not. Here, we developed a 3-phase, 384-well, plate-based, high-throughput screening (HTS) assay to rapidly triage and validate the toxicity of multiple e-liquids. Our data demonstrated that the PG/VG vehicle adversely affected cell viability and that a large number of e-liquids were more toxic than PG/VG. We also performed gas chromatography-mass spectrometry (GC-MS) analysis on all tested e-liquids. Subsequent nonmetric multidimensional scaling (NMDS) analysis revealed that e-liquids are an extremely heterogeneous group. Furthermore, these data indicated that (i) the more chemicals contained in an e-liquid, the more toxic it was likely to be and (ii) the presence of vanillin was associated with higher toxicity values. Further analysis of common constituents by electron ionization revealed that the concentration of cinnamaldehyde and vanillin, but not triacetin, correlated with toxicity. We have also developed a publicly available searchable website (www.eliquidinfo.org). Given the large numbers of available e-liquids, this website will serve as a resource to facilitate dissemination of this information. Our data suggest that an HTS approach to evaluate the toxicity of multiple e-liquids is feasible. Such an approach may serve as a roadmap to enable bodies such as the Food and Drug Administration (FDA) to better regulate e-liquid composition.


Conflict of interest statement

The authors have declared that no competing interests exist. The content is solely the responsibility of the authors and does not necessarily represent the official views of the NIH or the Food and Drug Administration.

Figures
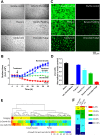
Fig 1
Fig 1. Development of preliminary screens to assess e-liquid toxicity in vitro.
Cells were incubated for 8 h in 384-well plates, e-liquids were added as indicated for 24 h, and bright-field images were automatically obtained every 2 h to determine growth rates. Cell surface area, as an indicator of confluency, was normalized to the media control. All N = 4. (A) Bright-field images of HEK293T cells incubated overnight with vehicle, 10% PG/VG + media, or 1% banana pudding-, candy corn-, chocolate fudge-, or popcorn-flavored e-liquids. (B) Mean representative growth curves obtained from the bright-field images over time. Curves were categorized as follows: normal growth, media control () and popcorn (Δ); reduced growth, candy corn (); no growth, banana pudding (); and toxic, 10% PG/VG () and chocolate fudge (). (C) Images of HEK293T cells stained with calcein-AM after overnight incubation with vehicle, 10% PG/VG + media, 1% banana pudding-, candy corn-, chocolate fudge-, or popcorn-flavored e-liquids. (D) Quantification of calcein-AM fluorescence (i.e., viability) expressed as mean ± SEM. All n = 3. The positive control (10% PG/VG + media) used the same PG/VG ratio as the e-liquids. (E) Heat map depicting Δ growth (%) and live-cell fluorescence (%). Growth control and PG/VG controls are shown for reference. E-liquids are grouped in 3 distinct categories from the clustering: 1 (red), e-liquids that showed low Δ growth and live-cell fluorescence % (0%–40%); 2 (yellow), e-liquids that showed moderate (40%–100%) Δ growth and low live-cell fluorescence % (0%–40%); and 3 (green), e-liquids that showed high Δ growth and live-cell fluorescence % (80%–100%). (F) E-liquids were grouped according to Δ growth and live-cell fluorescence. Numbers represent number of e-liquids in a category. Raw data are available in S1 Data. HEK293T, human embryonic kidney 293 cells; PG, propylene glycol; VG, vegetable glycerin.
Fig 2
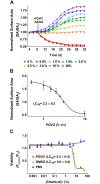
Fig 2. PG/VG alone negatively affects cell viability.
(A) Several concentrations of 55:45 PG/VG (0%–30% range) were added to HEK293T and incubated for 24 h. Cell viability was assessed via surface area using bright-field images (N = 3). (B) PG/VG alters cell growth in a dose-dependent manner. LC50 = 2.2 ± 0.2% (N = 4). (C). Viability was calculated measuring the ratio of fluorescence of calcein-AM/propidium iodide. PBS (nontoxic growth control), DMSO (toxic control), and 55:45 PG/VG were added to cells and incubated overnight. DMSO and PG/VG show similar LC50 values (N = 3, p = 0.68), while PBS was significantly different (p < 0.0001). Raw data are available in S2 Data. DMSO, dimethyl sulfoxide; HEK293T, human embryonic kidney 293 cells; LC50, concentration at which a given agent is lethal to 50% of the cells; PBS, phosphate-buffered saline; PG, propylene glycol; VG, vegetable glycerin.
Fig 3
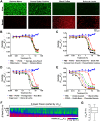
Fig 3. Main screen used to assess e-liquid toxicity.
A total of 148 e-liquids were run as 16-point dose–response curves using the viability assay. (A) Live (calcein-AM) and dead (PI) images for representative e-liquids. (B–E) Representative e-liquid dose–response curves. PBS, negative control. PG/VG, toxic control. N ≥ 3. (F) Heat map of viability ratio per e-liquid, normalized to the average of the baseline. Each column represents an e-liquid flavor with increasing e-liquid (% volume/volume) and sorted by decreasing LC50 values. (G) LC50 distribution of 148 e-liquids tested (reported as % concentration). Raw data are available in S3 Data. LC50, concentration at which a given agent is lethal to 50% of the cells; PBS, phosphate-buffered saline; PG, propylene glycol; PI, propidium iodide; VG, vegetable glycerin.
Fig 4
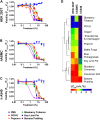
Fig 4. Orthogonal assays to validate human airway cell types.
(A–C) Representative dose–response curves assayed in HEK293T. (A) hASMC; (B) hA549; (C) PBS (negative control), PG/VG (positive control); Blueberry Tobacco, Popcorn, Key Lime Pie, and Banana Pudding show left-shifted but similar toxicity trends. All n = 3. (D) Heat map showing all e-liquid flavors tested in the 3 cell lines above. E-liquids have been clustered by LC50 values. Raw data are available in S4 Data. hA549, human adenocarcinomic alveolar basal epithelial cells; hASMC, human airway smooth muscle cell; HEK293T, human embryonic kidney 293 cells; LC50, concentration at which a given agent is lethal to 50% of the cells; PBS, phosphate-buffered saline; PG, propylene glycol; VG, vegetable glycerin.
Fig 5
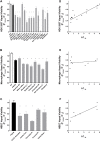
Fig 5. Toxicity of “vaped” versus neat e-liquids.
(A) Mean normalized viability of HEK293T cells following exposure of vaped e-liquids. N ≥ 5 per treatment. (B) Mean normalized viability of primary human alveolar macrophages following exposure of vaped e-liquids. N ≥ 5 per treatment. (C) Mean normalized viability of HBECs following exposure to vaped e-liquids. N ≥ 5 per treatment. (D) Graph showing HEK293T vaped viability versus HEK293T toxicity (LC50) obtained using neat e-liquids. Linear regression R2 = 0.66. (E) Graph showing primary human alveolar macrophage vaped viability versus HEK293T toxicity (LC50). Linear regression R2 = 0.06. (F) HBEC viability using vaped e-liquids versus HEK293T toxicity (LC50). Linear regression R2 = 0.74. * = p < 0.05 different from control. For A, B, and C we performed statistical analysis using one-way ANOVA followed by Dunnett’s Test. B. N. B. Smoothie, Chocolate B., and Coconut Water. Raw data are available in S5 Data. B. N. B. Smoothie, Banana Nut Bread Smoothie; Chocolate B., Chocolate Banana; HBEC, human bronchial epithelial cells; HEK293T, human embryonic kidney 293 cells; LC50, concentration at which a given agent is lethal to 50% of the cells.
Fig 6
Fig 6. Analysis of e-liquids and their constituents by GC-MS and electron ionization.
(A) Annotated chromatogram of “Dulce de Leche” e-liquid analyzed by GC-MS. PG and nicotine peaks appear off-scale to improve visibility of flavorings and additives. (B) Stacked chromatograms of 10 representative e-liquids analyzed by GC-MS. Glycerol and nicotine peaks are also shown, and PG is excluded for improved visibility of low-abundance compounds. (C) Representative electron ionization mass spectra of vanillin. GC-MS, gas chromatography–mass spectrometry; PG, propylene gycol.
Fig 7
Fig 7. The presence/absence of e-liquid constituents and their toxicity have some correlation.
(A) NMDS of e-liquids chemical analysis (presence/absence). NMDS was performed using binary Euclidean distances (stress 0.1367). E-liquids are shown as circles of varying size and color. Dashed circles encompass e-liquids within the same k-mode cluster, showing a significant separation of, in general, high and low LC50 e-liquids. Chemicals within each cluster were compared using a t test, in which resultant p-values were adjusted using Bonferroni correction. Chemicals within e-liquids are represented as triangles; gold coloration denotes those to be significantly (p < 0.0004) present after multiple testing correction and may be associated with lower LC50 values. (B) Graph showing toxicity (LC50) versus the number of chemicals in each e-liquid. Pearson correlation = −0.48; R2 = 0.23. Raw data are available in S6 Data. LC50, concentration at which a given agent is lethal to 50% of the cells; NMDS, nonmetric multidimensional scaling.
Fig 8
Fig 8. Vanillin and cinnamaldehyde concentrations correlate with toxicity in select e-liquids.
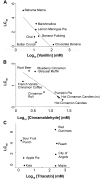
(A) Graph showing toxicity (LC50) versus “vanillin” in select e-liquids. LC50 = −2.70 × log10(vanillin [M]) + 5.06; R2 = 0.62 (linear regression analysis). (B) Graph showing toxicity (LC50) versus “cinnamaldehyde” in select e-liquids. LC50 = −1.12 × log10(cinnamaldehyde[M]) + 1.08; R2 = 0.75 (linear regression analysis). (C) Graph showing toxicity (LC50) versus “triacetin” in select e-liquids. “N.B.” = no linear relationship was detected for triacetin. We used this chemical as an example of nontoxic control. Raw data are available in S7 Data. LC50, concentration at which a given agent is lethal to 50% of the cells; nc, no nicotine.

References

    1. Kim KH, Kabir E, Jahan SA. Review of electronic cigarettes as tobacco cigarette substitutes: Their potential human health impact. J Environ Sci Health C Environ Carcinog Ecotoxicol Rev. 2016;34(4):262–75. doi: 10.1080/10590501.2016.1236604 . - DOI - PubMed
    1. Geiser M, Kreyling WG. Deposition and biokinetics of inhaled nanoparticles. Part Fibre Toxicol. 2010;7:2 doi: 10.1186/1743-8977-7-2 . - DOI - PMC - PubMed
    1. Chen J, Bullen C, Dirks K. A Comparative Health Risk Assessment of Electronic Cigarettes and Conventional Cigarettes. Int J Environ Res Public Health. 2017;14(4). doi: 10.3390/ijerph14040382 . - DOI - PMC - PubMed
    1. McNeill A BL, Calder R, Hitchman SC, Hajek P, McRobbie H. E-cigarettes: an evidence update. Public Health England. 2015.
    1. Bekki K, Uchiyama S, Ohta K, Inaba Y, Nakagome H, Kunugita N. Carbonyl compounds generated from electronic cigarettes. Int J Environ Res Public Health. 2014;11(11):11192–200. doi: 10.3390/ijerph111111192 . - DOI - PMC - PubMed

Publication types