. 2018 Mar 27;14(3):e1007290.
doi: 10.1371/journal.pgen.1007290. eCollection 2018 Mar.

PIKfyve regulates melanosome biogenesis

Affiliations

PIKfyve regulates melanosome biogenesis

Marc C Liggins et al. PLoS Genet. .

Abstract

PIKfyve, VAC14, and FIG4 form a complex that catalyzes the production of PI(3,5)P2, a signaling lipid implicated in process ranging from lysosome maturation to neurodegeneration. While previous studies have identified VAC14 and FIG4 mutations that lead to both neurodegeneration and coat color defects, how PIKfyve regulates melanogenesis is unknown. In this study, we sought to better understand the role of PIKfyve in melanosome biogenesis. Melanocyte-specific PIKfyve knockout mice exhibit greying of the mouse coat and the accumulation of single membrane vesicle structures in melanocytes resembling multivesicular endosomes. PIKfyve inhibition blocks melanosome maturation, the processing of the melanosome protein PMEL, and the trafficking of the melanosome protein TYRP1. Taken together, these studies identify a novel role for PIKfyve in controlling the delivery of proteins from the endosomal compartment to the melanosome, a role that is distinct from the role of PIKfyve in the reformation of lysosomes from endolysosomes.


Conflict of interest statement

The authors have declared that no competing interests exist.

Figures
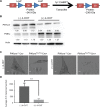
Fig 1
Fig 1. Loss of PIKfyve alters melanosome number.
A) Schematic of Tyrosinase::CreERT2 PIKfyveFlox/Flox knockout mice. In this model, the PIKfyve exon 38 (kinase domain) is flanked by intronic LoxP sites. Cells were treated with 4-hydroxytamoxifen (4-OHT) and mice were administered feed containing tamoxifen (TAM) to remove exon 38 resulting in the inactivation of the PIKfyve kinase. B) Six different batches of primary melanocytes isolated from neonatal Tyrosinase::CreERT2; PIKfyveFlox/Flox were treated with 4-OHT or vehicle control for 48hrs. Protein lysates were collected and immunoblotted with the indicated Abs to measure PIKfyve and Pmel levels. C) Cells from Tyrosinase::CreERT2; PIKfyveFlox/Flox or wild type mice treated with 4-OHT or vehicle were then fixed and imaged using phase contrast microscopy, scale bar = 10μm. D) The number of melanosomes per cell in Tyrosinase::CreERT2; PIKfyveFlox/Flox melanocytes treated with 4-OHT or vehicle was counted and quantified using ImageJ. ***, p < 0.001 using a two-tailed Student’s paired T test.
Fig 2
Fig 2. Melanocyte specific PIKfyve knockout mice exhibit hair greying.
A) Timeline of in vivo experiments. Five Tyrosinase::CreERT2; PIKfyveFlox/Flox and 5 PIKfyveFlox/Flox mice were administered tamoxifen chow for 29 days. A control group of 5 Tyrosinase::CreERT2; PIKfyveFlox/Flox mice were fed a control diet throughout the course of the experiment. All mice were shave depilated at p50 and subsequently fed normal chow beginning at p50 for the subsequent days. Gray bar denotes the duration that mice, with the exception of the control group, were on tamoxifen feed. B) Littermates were photographed at P85, P105, and P365. C) Mouse hair from the genotypes indicated was dissolved in solune-350 and melanin quantitation was performed as described. The relative amount of melanin in the hair was calculated relative to Cre- controls at P85, P105,and P365. Data shown are mean ± S.D. (n = 5 or 3 as indicated by error bars. ***, p < 0.001 using a two-tailed Student’s paired T test.
Fig 3
Fig 3. Melanocyte specific PIKfyve knockout mice exhibit vacuolar accumulation in select mouse hairs.
A) Haematoxylin and eosin stained sections from mice of the indicated genotypes at p60 was examined by light microscopy at 4x and 10x magnification. B) Toluene Blue stained semi-thin sections from mice of the indicated genotypes examined by light microscopy at 100x magnification. Anagen hair follicles from control PIKfyveFlox/FloxCre- mice (left panel) demonstrating normal melanocytes (M) at the epidermal/dermal papilla interface and from PIKfyveFlox/FloxCre+ mice (right panel) demonstrating melanocytes that appear morphologically normal (N), abnormal without containing melanin (Ab) and intermediate with minimal amount of melanin (I). C) Skin from TyrCreERT2 PIKfyveFlox/Flox ROSAmTmG/+ at P100 was embedded in OCT and examined by fluorescent microscopy at 4x magnification. D) Representative images of TyrCreERT2 PIKfyveFlox/Flox ROSAmTmG/+ mice and TyrCreERT2 PIKfyve++ ROSAmTmG/+ mice at P50. Note the early greying phenotype shown here is similar to what is observed in TyrCreERT2 PIKfyveFlox/Flox mice at p50.
Fig 4
Fig 4. Melanocyte specific PIKfyve knockout mice exhibit abnormal melanocyte morphology and trafficking.
A) 4mm biopsies were obtained from PIKfyve knockout mice and processed for electron microscopy. (a) Anagen hair bulbs contained melanocytes in various conditions, i.e. normal (N), abnormal (Ab), and intermediate (I). (b) Approximately 40% appeared morphologically normal resembling follicular melanocytes in C57Bl mice (N). (d) Another 40% exhibited profound vacuolization exhibiting vesicles within vacuoles resembling multivesicular bodies (inset to d) with very few if any melanosomes. (c) Occasionally, approximately 20% melanocytes relatively fewer melanosomes generally of earlier stages than the morphologically normal melanocytes. BARS: a = 10 microns, b, c & d = 3.0 microns, inset to d = 0.75 microns. B) 4mm biopsies were obtained from PIKfyve knockout mice and processed for DOPA histochemistry and electron microscopy. (a) morphologically normal melanocytes exhibited minimal DOPA reaction product in the trans Golgi network and associated 50 nm vesicles (arrows). (b) Intermediate melanocyte exhibited uncharacteristic DOPA reaction product that was clustered in large vacuoles some of which contained filamentous material (arrows). (c) The vacuoles of abnormal melanocytes exhibited very little DOPA reaction product with an occasional deposition around vesicles within the vacuoles (arrow) and attached to the limiting membrane of the vacuole (arrow with asterisk). BARS: a, b & c = 1.0 microns, d = 0.3 microns. C) Ultrastructure of melanocytes cultured from PIKfyve knockout mice recapitulate the aberrant morphology observed in hair bulb melanocytes from PIKfyve knockout mice. a & b) A prominent number of cultured melanocytes exhibited vacuoles with a central core of amorphorus material (arrows) with occasional stage IV melansomes (arrowheads). c & d) A significant number of melanocytes exhibited many stage IV melanosomes (arrowheads) and earlier stage melanosomes with normally arraigned melanofilaments (arrowheads with asterisks) as well as few vacuoles with a central core of amorphorus material (arrows). N = nucleus. Bars: a-d = 5 microns, insets = 2 microns.
Fig 5
Fig 5. PIKfyve inhibition results in decreased melanin accumulation and decreased accumulation of advanced stage melanosomes.
A) MNT-1 cells were treated with PIKfyve inhibitors YM-201636 (YM), apilimod or vehicle control for five days. A spectrophotometric melanin quantitation assay was used to measure the amount of accumulated melanin. (n = 6 as indicated by error bars). B) Equal numbers of MNT-1 cells treated with the indicated doses of YM or Apilimod were pelleted. Photographs of the cell pellets were obtained to document that YM and Apilimod treatment inhibited the accumulation of melanin. Normal human melanocytes (NHM) were treated with 1000 nM YM-201636 or vehicle without (Control) or with DOPA histochemistry (DOPA Tx) and (C,D) observed by electron microscopy Scale bar, C = 5 μm and D = 2 μm. (E) Pie graphs representing quantification of melanosome stages as percentage in NHM treated with 100, 500, or 1000 nM YM-021636 or vehicle. Each experiment was performed three times in triplicate. For all experiments, data shown are mean ± S.D *, p < 0.05; **, p < 0.01; or ***, p < 0.001 using a Student’s paired T test versus vehicle treated control.
Fig 6
Fig 6. PIKfyve inhibition alters trafficking and processing of melanosomal proteins.
A) MNT-1 cells were treated with 1000 nM YM-201636 (YM), 100 nM apilimod (AP), or vehicle (VEH) control for 16 hours. Cells were fixed and stained with anti- MART-1 or anti-TYRP1 antibodies and imaged by confocal microscopy depicted as GFP positive puncta. Scale bar, 10 μm. B) The number of GFP positive puncta in each MNT-1 cell was counted, and at least 20 cells were included for each group. The data are presented as the mean ± S.D. based on three independent experiments, data shown as percent signal relative to vehicle. For all experiments, data shown are mean ± S.D *, p < 0.05; **, p < 0.01; or ***, p < 0.001 using a Student’s paired T test versus vehicle treated control. C) MNT-1 cells were treated with PIKfyve inhibitors YM-201636, apilimod or vehicle control for 72 hours. The relative accumulation of TYR, and unprocessed PMEL (100 kD) and Cathepsin D was measured by immunoblotting. Protein accumulation relative to GAPDH levels was quantified by densitometry. Pre pro cathepsin D and pro cathepsin D was quantified relative to GAPDH level (black) as well as relative to mature Cathepsin D (gray). Representative experiment of three independent experiments is shown.
Fig 7
Fig 7. PIKfyve regulates melanosome maturation.
A) In normal melanocytes, PIKfyve regulates melanosome biogenesis by controlling the delivery of TYR and TYRP1 to the melanosome and inducing PMEL processing. B) Inhibition or loss of PIKfyve blocks PMEL processing and prevents TYR and TYRP1 from being trafficked to stage II melanosomes.

Similar articles

Cited by

References

    1. Costin GE, Hearing VJ. Human skin pigmentation: melanocytes modulate skin color in response to stress. FASEB J. 2007;21(4):976–94. Epub 2007/01/24. doi: 10.1096/fj.06-6649rev [pii] . - DOI - PubMed
    1. Sitaram A, Marks MS. Mechanisms of protein delivery to melanosomes in pigment cells. Physiology (Bethesda). 2012;27(2):85–99. Epub 2012/04/17. doi: 10.1152/physiol.00043.2011 ; PubMed Central PMCID: PMCPMC3345138. - DOI - PMC - PubMed
    1. Raposo G, Marks MS. Melanosomes—dark organelles enlighten endosomal membrane transport. Nat Rev Mol Cell Biol. 2007;8(10):786–97. Epub 2007/09/20. doi: 10.1038/nrm2258 ; PubMed Central PMCID: PMCPMC2786984. - DOI - PMC - PubMed
    1. Wei AH, Li W. Hermansky-Pudlak syndrome: pigmentary and non-pigmentary defects and their pathogenesis. Pigment Cell Melanoma Res. 2013;26(2):176–92. Epub 2012/11/23. doi: 10.1111/pcmr.12051 . - DOI - PubMed
    1. Wasmeier C, Hume AN, Bolasco G, Seabra MC. Melanosomes at a glance. J Cell Sci. 2008;121(Pt 24):3995–9. Epub 2008/12/06. doi: 10.1242/jcs.040667 [pii]. . - DOI - PubMed

Publication types

MeSH terms