Observational Study
. 2018 Mar 27;15(3):e1002543.
doi: 10.1371/journal.pmed.1002543. eCollection 2018 Mar.

Comparative analysis of the association between 35 frailty scores and cardiovascular events, cancer, and total mortality in an elderly general population in England: An observational study

Affiliations
Observational Study

Comparative analysis of the association between 35 frailty scores and cardiovascular events, cancer, and total mortality in an elderly general population in England: An observational study

Gloria A Aguayo et al. PLoS Med. .

Abstract

Background: Frail elderly people experience elevated mortality. However, no consensus exists on the definition of frailty, and many frailty scores have been developed. The main aim of this study was to compare the association between 35 frailty scores and incident cardiovascular disease (CVD), incident cancer, and all-cause mortality. Also, we aimed to assess whether frailty scores added predictive value to basic and adjusted models for these outcomes.

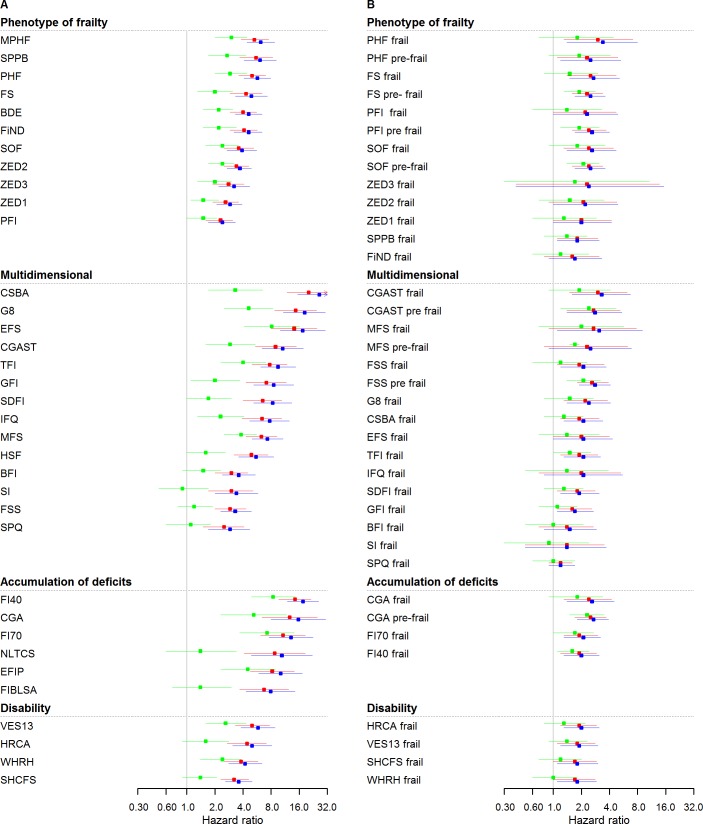
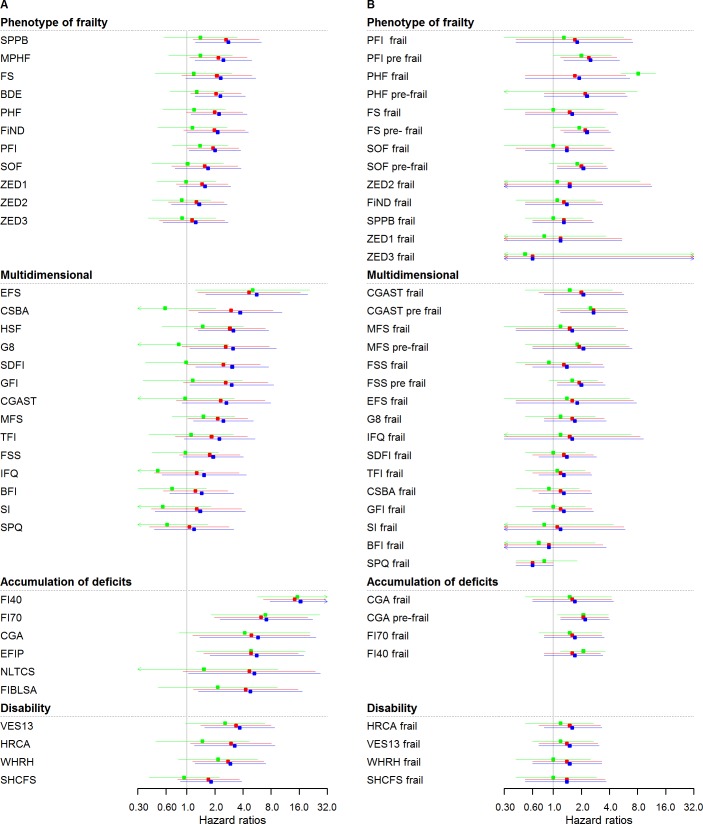
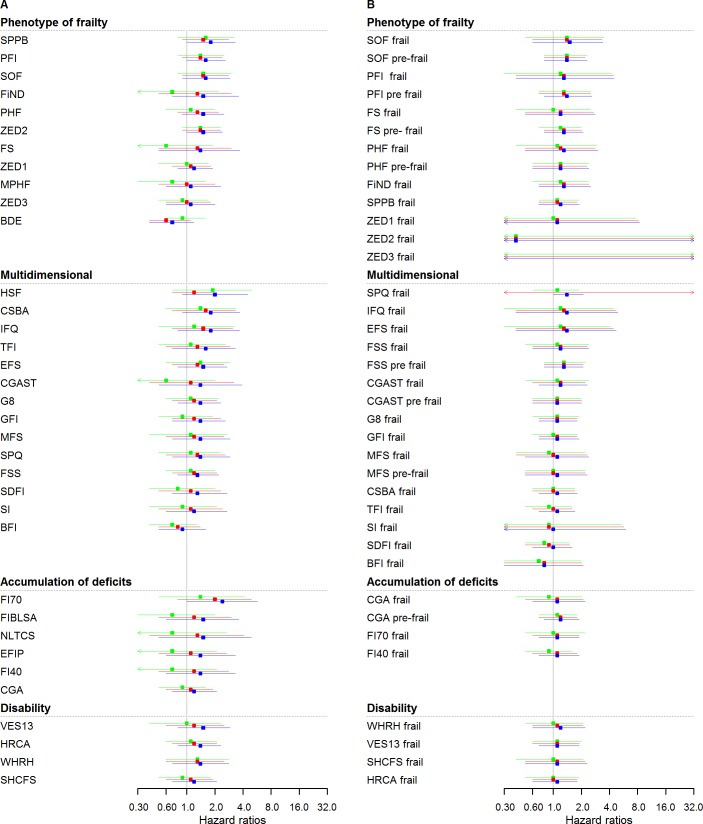
Methods and findings: Through a structured literature search, we identified 35 frailty scores that could be calculated at wave 2 of the English Longitudinal Study of Ageing (ELSA), an observational cohort study. We analysed data from 5,294 participants, 44.9% men, aged 60 years and over. We studied the association between each of the scores and the incidence of CVD, cancer, and all-cause mortality during a 7-year follow-up using Cox proportional hazard models at progressive levels of adjustment. We also examined the added predictive performance of each score on top of basic models using Harrell's C statistic. Using age of the participant as a timescale, in sex-adjusted models, hazard ratios (HRs) (95% confidence intervals) for all-cause mortality ranged from 2.4 (95% CI: 1.7-3.3) to 26.2 (95% CI: 15.4-44.5). In further adjusted models including smoking status and alcohol consumption, HR ranged from 2.3 (95% CI: 1.6-3.1) to 20.2 (95% CI: 11.8-34.5). In fully adjusted models including lifestyle and comorbidity, HR ranged from 0.9 (95% CI: 0.5-1.7) to 8.4 (95% CI: 4.9-14.4). HRs for CVD and cancer incidence in sex-adjusted models ranged from 1.2 (95% CI: 0.5-3.2) to 16.5 (95% CI: 7.8-35.0) and from 0.7 (95% CI: 0.4-1.2) to 2.4 (95% CI: 1.0-5.7), respectively. In sex- and age-adjusted models, all frailty scores showed significant added predictive performance for all-cause mortality, increasing the C statistic by up to 3%. None of the scores significantly improved basic prediction models for CVD or cancer. A source of bias could be the differences in mortality follow-up time compared to CVD/cancer, because the existence of informative censoring cannot be excluded.

Conclusion: There is high variability in the strength of the association between frailty scores and 7-year all-cause mortality, incident CVD, and cancer. With regard to all-cause mortality, some scores give a modest improvement to the predictive ability. Our results show that certain scores clearly outperform others with regard to three important health outcomes in later life. Finally, we think that despite their limitations, the use of frailty scores to identify the elderly population at risk is still a useful measure, and the choice of a frailty score should balance feasibility with performance.


Conflict of interest statement

The authors have declared that no competing interests exist.

Figures

Fig 1
Fig 1. Mortality HRs of frailty scores (n = 5,294): Continuous and cutoff analysis.
(A) Left panel: continuous anaylsis; (B) right panel: categorical analysis. Models were fitted using age as timescale, with time 0 = age at entry of study and time 1 = age at event or censoring date. Model 1 in blue: adjusted by sex. Model 2 in red: Model 1 + smoking status, alcohol, and alcohol consumption. Model 3 in green: Model 2 + physical activity, BMI, diabetes, hypertension, cardiovascular, cancer, anemia, COPD, arthritis, neuropsychiatric problems, depression, cognition, and self-rated health and quality of life. HRs were at 3.5 years (median follow-up for mortality). BDE, Beaver Dam Eye Study Index; BFI, Brief Frailty Index; BMI, body mass index; CGA, Comprehensive Geriatric Assessment; CGAST, Comprehensive Geriatric Assessment Screening Tests; COPD, chronic obstructive pulmonary disease; CSBA, Conselice Study of Brain Aging Score; EFIP, Evaluative Frailty Index for Physical Activity; EFS, Edmonton Frail Scale; FI40, 40-item Frailty Index; FI70, 70-item Frailty Index (SHARE); FIBLSA, Frailty Index Beijing Longitudinal Study of Ageing; FiND, Frail Non-Disabled Questionnaire; FS, Frail Scale; FSS, Frailty Staging System; G8, G-8 Geriatric Screening Tool; GFI, Groningen Frailty Indicator; HR, hazard ratio; HRCA, Hebrew Rehabilitation Center for Aged Vulnerability Index; HSF, Health Status Form; IFQ, Inter-Frail Questionnaire; MFS, Modified Frailty Score; MPHF, Modified Phenotype of Frailty; NLTCS, Long Term Care Survey Frailty Index; PFI, Physical Frailty Index; PHF, Phenotype of Frailty; SDFI, Static/Dynamic Frailty Index; SHCFS, Canadian Study of Health and Aging Clinical Frailty Scale; SI, Screening Instrument; SOF, Study of Osteoporotic Fractures; SPPB, Short Physical Performance Battery; SPQ, Sherbrooke Postal Questionnaire; TFI, Tilburg Frailty Indicator; VES13, Vulnerable Elders Survey; WHRH, WHOAFC and self-reported health; ZED1, ZutPhen Elderly Study (Physical Activity and Low Energy); ZED2, ZutPhen Elderly Study (Physical Activity and Weight Loss); ZED3, ZutPhen Elderly Study (Physical Activity and Low BMI).
Fig 2
Fig 2. Cardiovascular HRs of frailty scores (n = 4,554): Continuous and cutoff analysis.
(A) Left panel: continuous anaylsis; (B) right panel: categorical analysis. Models were fitted using age as timescale, with time 0 = age at entry of study and time 1 = age at event or censoring date. Model 1 in blue: adjusted by sex. Model 2 in red: Model 1 + smoking status, alcohol, and alcohol consumption. Model 3 in green: Model 2 + physical activity, BMI, diabetes, hypertension, cancer, anemia, COPD, arthritis, neuropsychiatric problems, depression, cognition, and self-rated health and quality of life. HRs were at 2.5 years (median follow-up for CVD events). BDE, Beaver Dam Eye Study Index; BFI, Brief Frailty Index; BMI, body mass index; CGA, Comprehensive Geriatric Assessment; CGAST, Comprehensive Geriatric Assessment Screening Tests; COPD, chronic obstructive pulmonary disease; CSBA, Conselice Study of Brain Aging Score; CVD, cardiovascular disease; EFIP, Evaluative Frailty Index for Physical Activity; EFS, Edmonton Frail Scale; FI40, 40-item Frailty Index; FI70, 70-item Frailty Index (SHARE); FIBLSA, Frailty Index Beijing Longitudinal Study of Ageing; FiND, Frail Non-Disabled Questionnaire; FS, Frail Scale; FSS, Frailty Staging System; G8, G-8 Geriatric Screening Tool; GFI, Groningen Frailty Indicator; HR, hazard ratio; HRCA, Hebrew Rehabilitation Center for Aged Vulnerability Index; HSF, Health Status Form; IFQ, Inter-Frail Questionnaire; MFS, Modified Frailty Score; MPHF, Modified Phenotype of Frailty; NLTCS, Long Term Care Survey Frailty Index, PFI, Physical Frailty Index; PHF, Phenotype of Frailty; SDFI, Static/Dynamic Frailty Index; SHCFS, Canadian Study of Health and Aging Clinical Frailty Scale; SI, Screening Instrument; SOF, Study of Osteoporotic Fractures; SPPB, Short Physical Performance Battery; SPQ, Sherbrooke Postal Questionnaire; TFI, Tilburg Frailty Indicator; VES13, Vulnerable Elders Survey; WHRH, WHOAFC and self-reported health; ZED1, ZutPhen Elderly Study (Physical Activity and Low Energy); ZED2, ZutPhen Elderly Study (Physical Activity and Weight Loss); ZED3, ZutPhen Elderly Study (Physical Activity and Low BMI).
Fig 3
Fig 3. Cancer HRs of frailty scores (n = 4,792): Continuous and cutoff analysis.
(A) Left panel: continuous analysis; (B) right panel: categorical analysis. Models were fitted using age as timescale, with time 0 = age at entry of study and time 1 = age at event or censoring date. Model 1 in blue: adjusted by sex. Model 2 in red: Model 1 + smoking status, alcohol, and alcohol consumption. Model 3 in green: Model 2 + physical activity, BMI, diabetes, hypertension, cardiovascular, anaemia, COPD, arthritis, neuropsychiatric problems, depression, cognition, and self-rated health and quality of life. HRs were at 2.5 years (median follow-up for cancer events). BDE, Beaver Dam Eye Study Index; BFI, Brief Frailty Index; BMI, body mass index; CGA, Comprehensive Geriatric Assessment; CGAST, Comprehensive Geriatric Assessment Screening Tests; COPD, chronic obstructive pulmonary disease; CSBA, Conselice Study of Brain Aging Score; CVD, cardiovascular disease; EFIP, Evaluative Frailty Index for Physical Activity; EFS, Edmonton Frail Scale; FI40, 40-item Frailty Index; FI70, 70-item Frailty Index (SHARE); FIBLSA, Frailty Index Beijing Longitudinal Study of Ageing; FiND, Frail Non-Disabled Questionnaire; FS, Frail Scale; FSS, Frailty Staging System; G8, G-8 Geriatric Screening Tool; GFI, Groningen Frailty Indicator; HR, hazard ratio; HRCA, Hebrew Rehabilitation Center for Aged Vulnerability Index; HSF, Health Status Form; IFQ, Inter-Frail Questionnaire; MFS, Modified Frailty Score; MPHF, Modified Phenotype of Frailty; NLTCS, Long Term Care Survey Frailty Index; PFI, Physical Frailty Index; PHF, Phenotype of Frailty; SDFI, Static/Dynamic Frailty Index; SHCFS, Canadian Study of Health and Aging Clinical Frailty Scale; SI, Screening Instrument; SOF, Study of Osteoporotic Fractures; SPPB, Short Physical Performance Battery; SPQ, Sherbrooke Postal Questionnaire; TFI, Tilburg Frailty Indicator; VES13, Vulnerable Elders Survey; WHRH, WHOAFC and self-reported health; ZED1, ZutPhen Elderly Study (Physical Activity and Low Energy); ZED2, ZutPhen Elderly Study (Physical Activity and Weight Loss); ZED3, ZutPhen Elderly Study (Physical Activity and Low BMI).

References

    1. Schuurmans H, Steverink N, Lindenberg S, Frieswijk N, Slaets JP. Old or frail: what tells us more? The Journals of Gerontology Series A: Biological Sciences and Medical Sciences. 2004;59(9):M962–M5. - PubMed
    1. Pel-Littel R, Schuurmans M, Emmelot-Vonk M, Verhaar H. Frailty: defining and measuring of a concept. JNHA-The Journal of Nutrition, Health and Aging. 2009;13(4):390–4. - PubMed
    1. Fried LP, Tangen CM, Walston J, Newman AB, Hirsch C, Gottdiener J, et al. Frailty in older adults evidence for a phenotype. The Journals of Gerontology Series A: Biological Sciences and Medical Sciences. 2001;56(3):M146–M57. - PubMed
    1. Gobbens RJ, Luijkx KG, Wijnen-Sponselee MT, Schols JM. Toward a conceptual definition of frail community dwelling older people. Nursing outlook. 2010;58(2):76–86. Epub 2010/04/07. doi: 10.1016/j.outlook.2009.09.005 . - DOI - PubMed
    1. Mitnitski AB, Mogilner AJ, Rockwood K. Accumulation of deficits as a proxy measure of aging. The Scientific World Journal. 2001;1:323–36. doi: 10.1100/tsw.2001.58 - DOI - PMC - PubMed

Publication types