. 2018 Mar 27;13(3):e0194616.
doi: 10.1371/journal.pone.0194616. eCollection 2018.

Population genomics of Fusarium graminearum reveals signatures of divergent evolution within a major cereal pathogen

Affiliations

Population genomics of Fusarium graminearum reveals signatures of divergent evolution within a major cereal pathogen

Amy C Kelly et al. PLoS One. .

Abstract

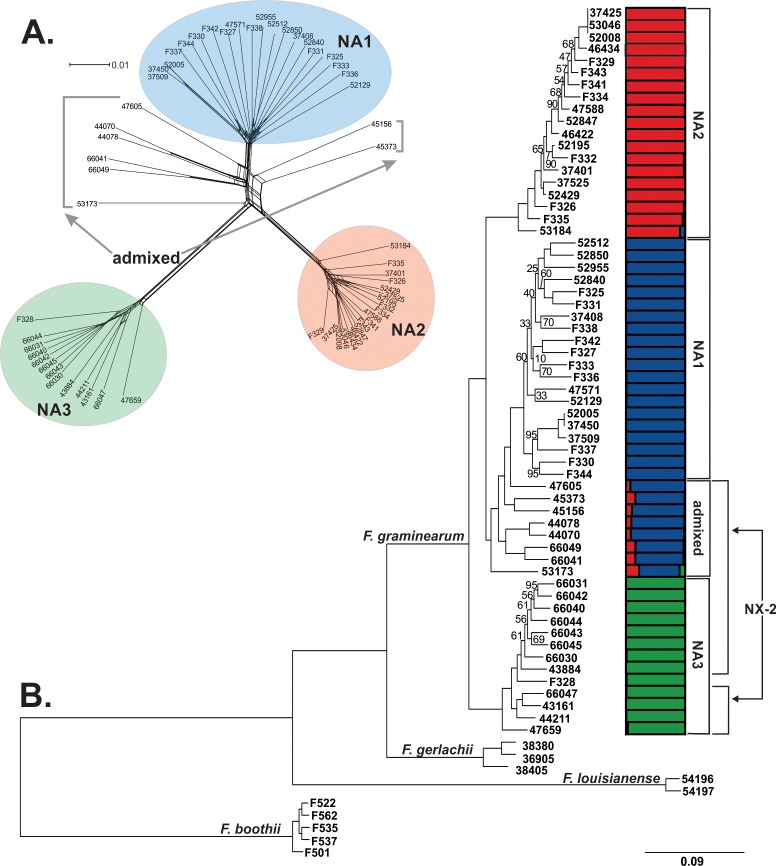
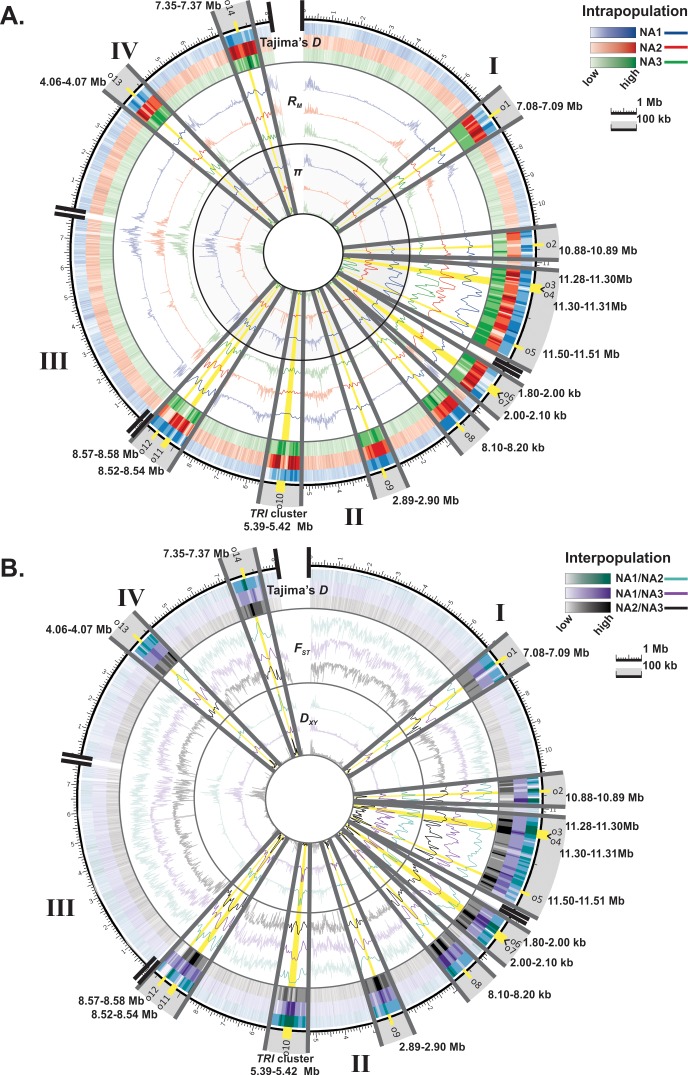
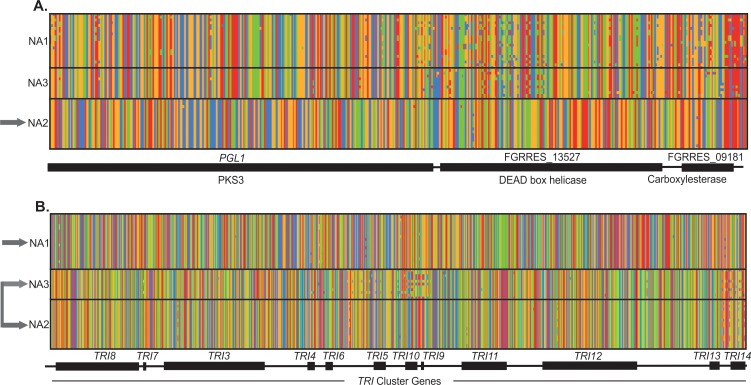
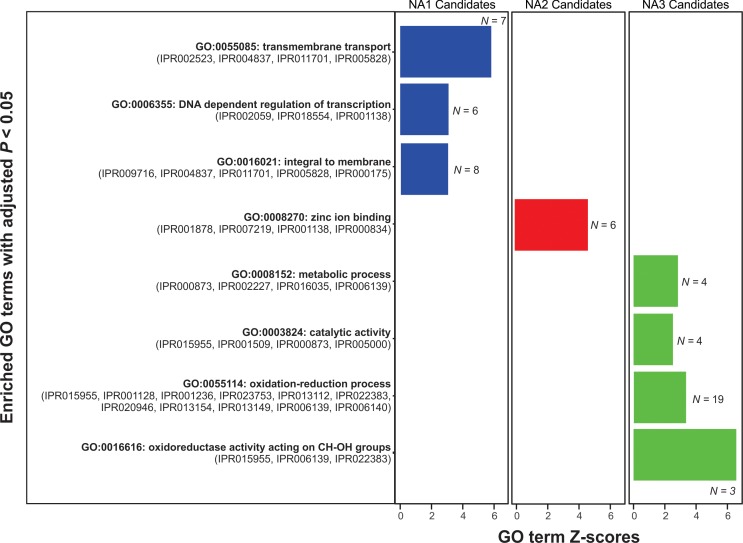
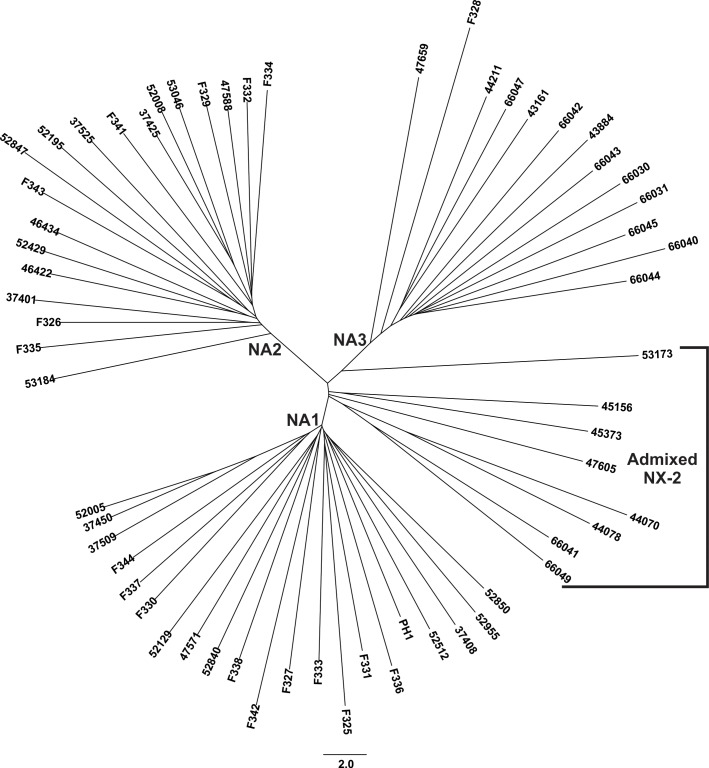
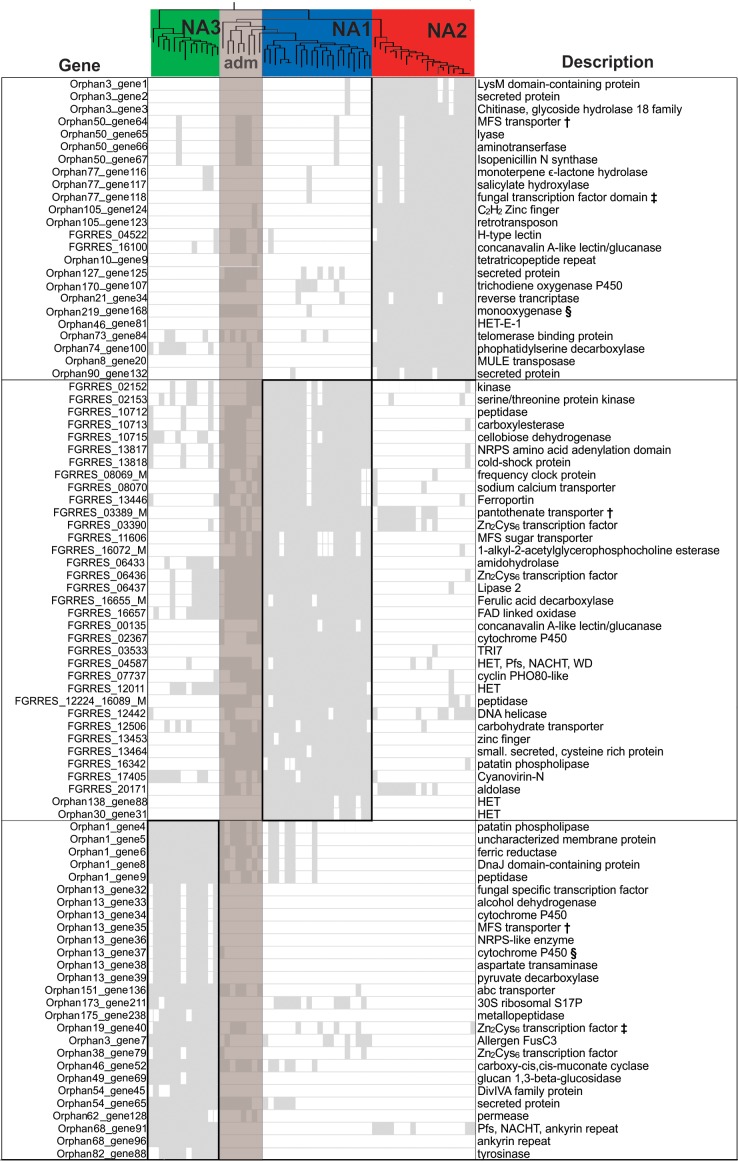
The cereal pathogen Fusarium graminearum is the primary cause of Fusarium head blight (FHB) and a significant threat to food safety and crop production. To elucidate population structure and identify genomic targets of selection within major FHB pathogen populations in North America we sequenced the genomes of 60 diverse F. graminearum isolates. We also assembled the first pan-genome for F. graminearum to clarify population-level differences in gene content potentially contributing to pathogen diversity. Bayesian and phylogenomic analyses revealed genetic structure associated with isolates that produce the novel NX-2 mycotoxin, suggesting a North American population that has remained genetically distinct from other endemic and introduced cereal-infecting populations. Genome scans uncovered distinct signatures of selection within populations, focused in high diversity, frequently recombining regions. These patterns suggested selection for genomic divergence at the trichothecene toxin gene cluster and thirteen additional regions containing genes potentially involved in pathogen specialization. Gene content differences further distinguished populations, in that 121 genes showed population-specific patterns of conservation. Genes that differentiated populations had predicted functions related to pathogenesis, secondary metabolism and antagonistic interactions, though a subset had unique roles in temperature and light sensitivity. Our results indicated that F. graminearum populations are distinguished by dozens of genes with signatures of selection and an array of dispensable accessory genes, suggesting that FHB pathogen populations may be equipped with different traits to exploit the agroecosystem. These findings provide insights into the evolutionary processes and genomic features contributing to population divergence in plant pathogens, and highlight candidate genes for future functional studies of pathogen specialization across evolutionarily and ecologically diverse fungi.


Conflict of interest statement

Competing Interests: The authors have declared that no competing interests exist.

Figures

Fig 1
Fig 1. Evolutionary history and population structure of North American F. graminearum.
A phylogenetic network (A) and maximum likelihood phylogeny (B) was inferred from SNPs identified by reference-based mapping of whole genome sequences to the PH-1 F. graminearum genome (Ensembl, version RR). Taxa comprised 20 NA1/15ADON isolates, 20 NA2/3ADON isolates, 20 NX-2 isolates, and for the maximum likelihood analyses, representatives from three FGSC species were included: F. boothii (N = 5), F. gerlachii (N = 3) and F. louisianense (N = 2). Different colors indicate clustering assignment of each isolate in the three populations inferred from Bayesian analyses: NA2 = red, NA1 = blue and NA3 = green. A. SplitsTree4 [98] was used to construct a network wherein F. graminearum isolates are represented by terminal nodes, and relationships are depicted as branches with parallel edges indicating reticulate events (i.e. recombination, gene transfer). B. In the maximum likelihood phylogeny, all bootstrap values were 100%, except those indicated at branch nodes. The tree was rooted with F. boothii and drawn to scale, with branch lengths measured in the number of substitutions per site. Colored bars indicate Bayesian estimates of ancestry (q) for each isolate in the three populations.
Fig 2
Fig 2. Genomic distribution of outlier regions exhibiting signatures of selection.
Sliding-window values of intrapopulation diversity and recombination (Panel A, Tajima’s D, π and Rm) and interpopulation differentiation (Panel B, Tajima’s D, Dxy, and FST) were calculated in 10 kb windows to identify genomic regions with signatures of selection in NA1 (omitting admixed NX-2 isolates), NA2 or NA3 populations of F. graminearum. The fourteen outliers (o1-o14, yellow highlight) showed significant (P < 0.001) divergence between populations based on pairwise (interpopulation) values of Tajima’s D, Dxy, and FST, coupled with significantly reduced diversity (π) within the divergent population(s). Significance was assessed by comparing observed sliding-window values of each metric against a null genome-wide distribution derived through random permutation.
Fig 3
Fig 3. SNP haplotype alignments show divergence of NA1, NA2 and NA3 F. graminearum at outlier regions.
For each alignment, rows correspond to the polymorphisms found in a single isolate and columns show the SNPs found at each variant site. Gene designations and conserved domains are based on the PH-1 F. graminearum genome [27] (Ensembl, version RR). Panels A-B show examples of the genetic patterns observed at outliers. A. chromosome 4: 7,360,000–7,367,500; a single population (NA2, grey arrow) exhibited reduced within-population diversity and high divergence from the other two populations. B. chromosome 2: 5,390,000–5,420,000, TRI cluster genes; diversity was reduced in all three populations and two highly divergent haplotypes (grey arrows: 15ADON haplotype in NA1 and 3ADON haplotype in NA2/NA3) were segregating among the three populations.
Fig 4
Fig 4. F. graminearum populations are differentiated by divergent gene sets that are enriched for different functions.
Functional enrichment was assessed based on Gene Ontology (GO) terms assigned to domains annotated in candidate genes identified in NA1 (left, blue bars), NA2 (center, red bars) and NA3 (right, green bars). Candidate genes included genes in outlier regions showing signatures of selection and differentially conserved genes in each population. Hypergeometric tests were performed by calculating Z-scores that compared the relative frequency of GO terms assigned to each candidate gene set to GO terms assigned to all functionally annotated F. graminearum genes. Z-scores and the number of domains in each gene set (N) are only shown for GO terms that were significantly overrepresented after a Benjamini–Hochberg adjustment for multiple testing (adjusted P < 0.01) [134]. InterPro domains associated with each GO term are listed in parentheses below the term description in bold type.
Fig 5
Fig 5. Dendrogram of the F. graminearum pan-genome.
Pairwise distances were computed between genomes based on gene presence/absence polymorphism, and the resulting matrix was used to cluster isolates with the neighbor joining method implemented in MEGA 7 [126]. Branch lengths represent the number of genes that differ in presence/absence status between strains, such that genomes with identical gene content would have a distance of 0.
Fig 6
Fig 6. Descriptions of genes that were differentially conserved among populations of F. graminearum.
The matrix indicates the presence (solid grey) and absence (white) of genes that were differentially conserved (E-test P-value < 0.01) in NA1, NA2 or NA3. Each column in the matrix represents a single isolate and each row represents a gene ortholog. Population structure based on Bayesian clustering (indicated by red, blue and green highlight) is shown, along with the maximum likelihood phylogeny inferred from SNPs. Admixed isolates (adm, shaded brown) were not included in calculations but are shown to emphasize their mosaic genomes. Functional descriptions of the domains encoded by each gene are based on annotations of the PH-1 F. graminearum genome [27] (Ensembl, version RR) and HMMER, BLAST, BLAST2GO, CD-Search, InterPro and Signal P analyses. Bold symbols (§, , ) indicate accessory proteins with similar domain content and structure that were found in different genomic contexts in each population. Differentially conserved genes with uncharacterized functions were not depicted in the figure (N = 34).

Similar articles

Cited by

References

    1. Goswami RS, Kistler HC (2004) Heading for disaster: Fusarium graminearum on cereal crops. Molecular Plant Pathology 5: 515–525. doi: 10.1111/j.1364-3703.2004.00252.x - DOI - PubMed
    1. McMullen M, Bergstrom G, De Wolf E, Dill-Macky R, Hershman D, et al. (2012) A unified effort to fight an enemy of wheat and barley: Fusarium head blight. Plant Disease 96: 1712–1728. - PubMed
    1. Desjardins A, Proctor R (2007) Molecular biology of Fusarium mycotoxins. International Journal of Food Microbiology 119: 47–50. doi: 10.1016/j.ijfoodmicro.2007.07.024 - DOI - PubMed
    1. Dubin H, Gilchrist L, Reeves L, McNab A (2002) Fusarium head blight: global status and prospects In: Curtis BR, S; Macpherson HG;, editor. Bread wheat: improvement and production. Rome, Italy: Food and Agriculture Organization of the United Nations.
    1. Nganje WE, Kaitibie S, Wilson WW, Leistritz FL, Bangsund DA (2004) Economic impacts of Fusarium head blight in wheat and barley: 1993–2001. Agribusiness and Applied Economics Report No 538. ND, US: Department of Agribusiness and Applied Economics, North Dakota State University.

Publication types

LinkOut - more resources