

Global nutrition 1990-2015: A shrinking hungry, and expanding fat world
- PMID: 29584768
- PMCID: PMC5870987
- DOI: 10.1371/journal.pone.0194821
Global nutrition 1990-2015: A shrinking hungry, and expanding fat world
Abstract
Objectives: Following its publication in 2008, the Global Nutritional Index (GNI) which captures the triple burden of malnutrition, has been updated to assess the overall nutritional status and nutritional trends of countries, regions and the world, including both under-nutrition and over-nutrition.
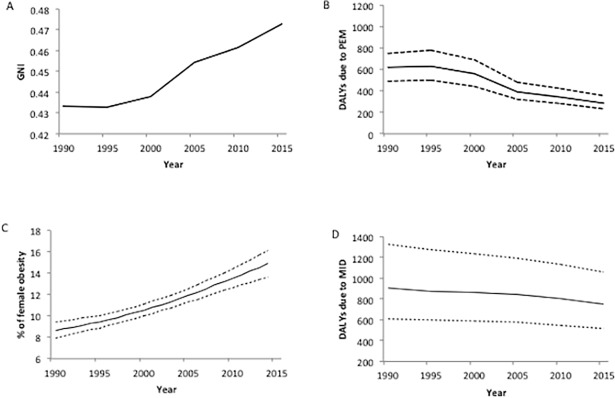
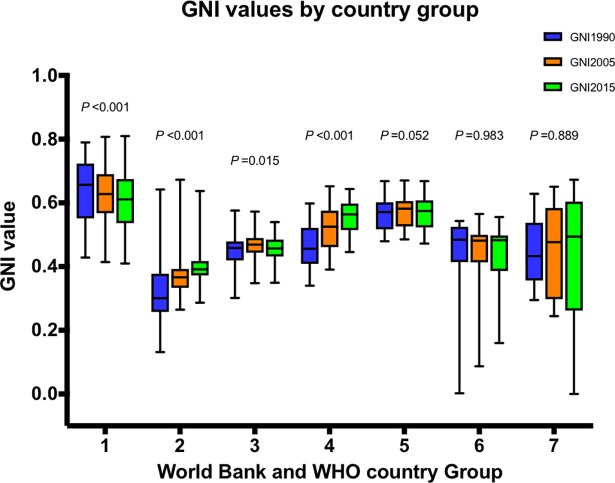
Methods: The GNI was modeled on the Human Development Index, using geometric means of three normalized indicators: protein-energy malnutrition (PEM, measured by Disability-Adjusted Life Years (DALYs) from PEM), micronutrient deficiency (MID, measured by DALYs from MID), and penalizing obesity (percent female obesity). GNI (range 0-1) was calculated from 1990-2015 for 186 countries, in seven World Bank income and WHO region groupings.
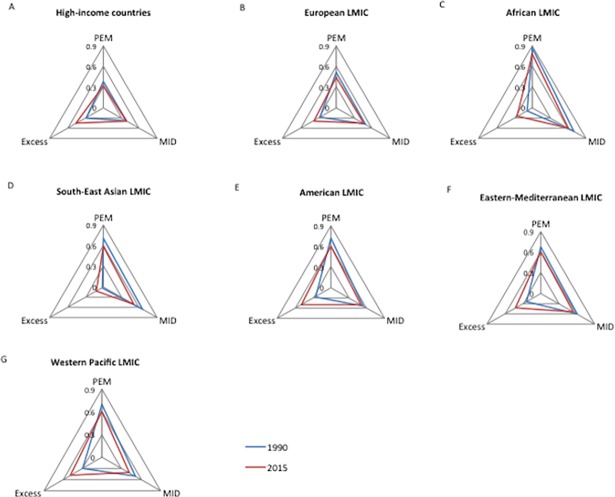
Results: World GNI increased from 0.433 to 0.473 as decreased deficits overcompensated for the rise in obesity. GNI for African low- and middle-income countries (LMIC) (median 0.301 to 0.392) and South-East Asian LMIC (0.456 to 0.564) improved significantly (P<0.001), while for high-income countries (0.657 to 0.611) worsened significantly (P<0.001). GNI for American LMIC (0.459 to 0.457), European LMIC (0.571 to 0.575), Eastern Mediterranean LMIC (0.484 to 0.483) and Western Pacific LMIC (0.433 to 0.494) were unchanged. The disaggregation of the GNI showed that in nearly all the seven country groups there was a significant decrease in both PEM and MID (all P<0.01) (except in HIC where only PEM dropped), and a significant increase in obesity (all P<0.001).
Conclusion: These trends are the result of the reciprocal changes between decreased under-nutrition and increased over-nutrition, which has become a major cause of malnutrition worldwide. We suggest, therefore, that future Sustainable Development Goals should include alongside "zero hunger"-"reduce obesity".
Conflict of interest statement
Figures
References
-
- Miller DD, Welch RM. Food system strategies for preventing micronutrient malnutrition. Food Policy. 2013;42:115–128.
-
- WHO. Obesity and overweight Geneva: World Health Organization, 2016. Available from http://www.who.int/mediacentre/factsheets/fs311/en/(Cited Apr 6 2017).
-
- Rosenbloom JI, Kaluski DN, Berry EM. A global nutritional index. Food Nutr Bull. 2008;29:266–277. doi: 10.1177/156482650802900403 - DOI - PubMed
-
- UNDP. Human Development Index (HDI). New York: United Nations Development Program, 2016. Available from http://hdr.undp.org/en/content/human-development-index-hdi (Cited Aug 12 2017).
MeSH terms
LinkOut - more resources
Full Text Sources
Other Literature Sources
Research Materials
