. 2018 Oct 1;114(12):1642-1655.
doi: 10.1093/cvr/cvy075.

Loss of AZIN2 splice variant facilitates endogenous cardiac regeneration

Affiliations

Loss of AZIN2 splice variant facilitates endogenous cardiac regeneration

Xinzhong Li et al. Cardiovasc Res. .

Erratum in

Abstract

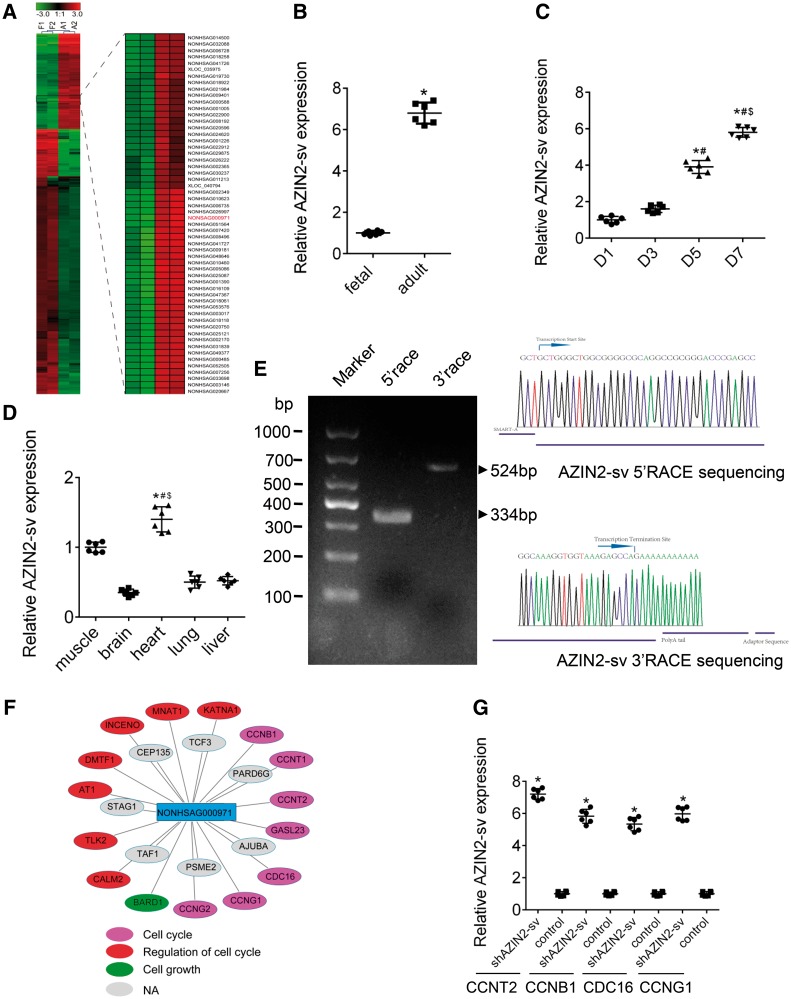
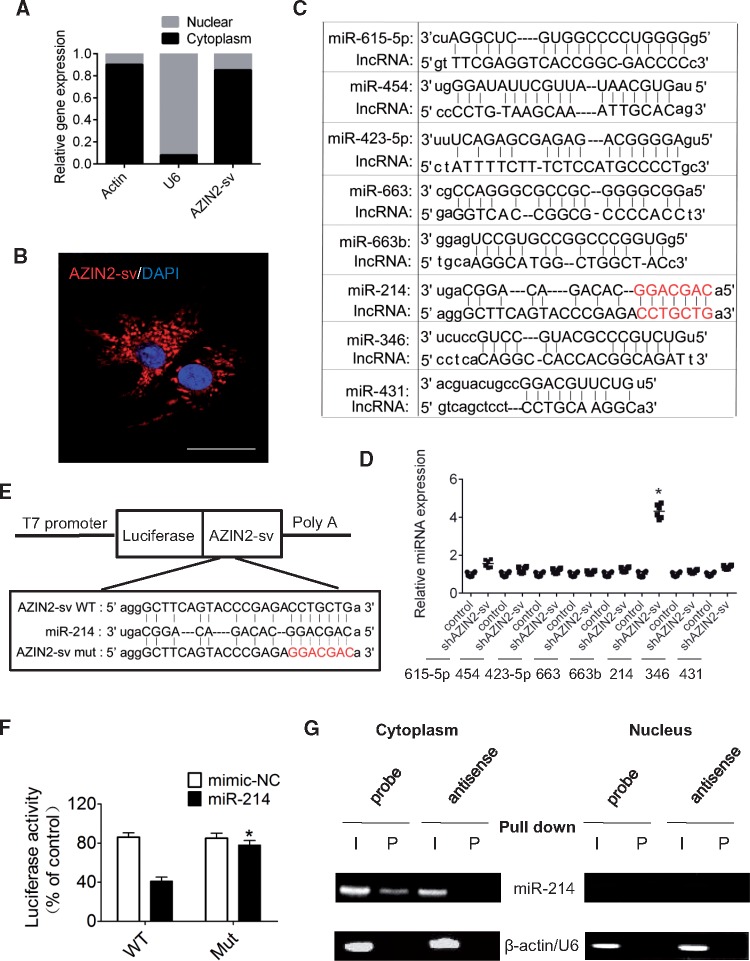
Aims: Long noncoding RNAs (lncRNAs) are critical regulators of cardiovascular lineage commitment and heart wall development, but their roles in regulating endogenous cardiac regeneration are unclear. The present study investigated the role of human-derived lncRNA in regulating endogenous cardiac regeneration as well as the underlying mechanisms.

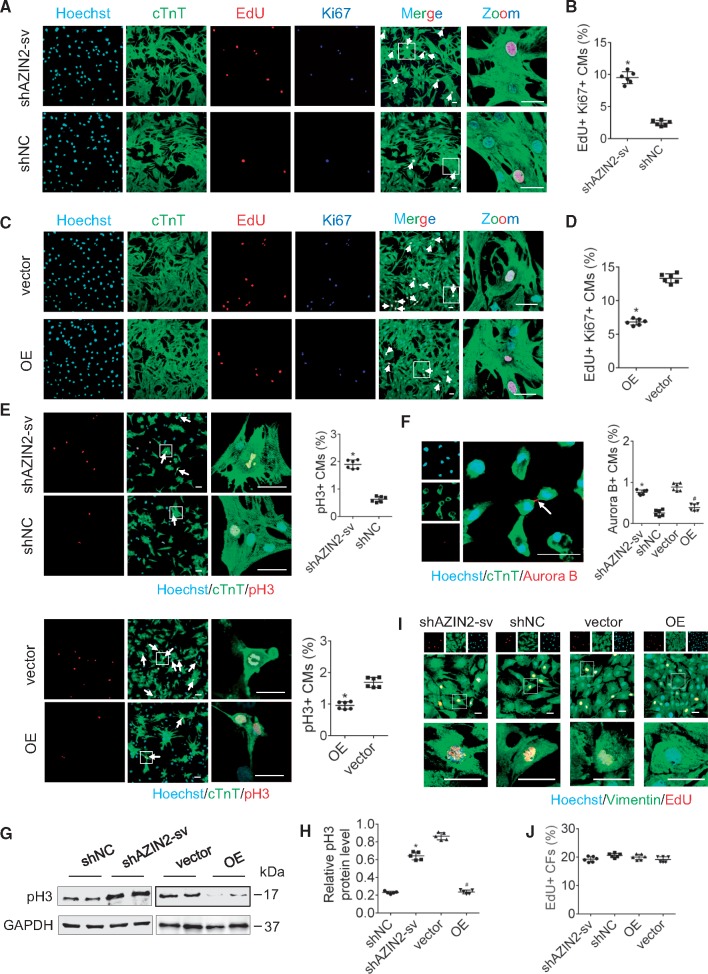
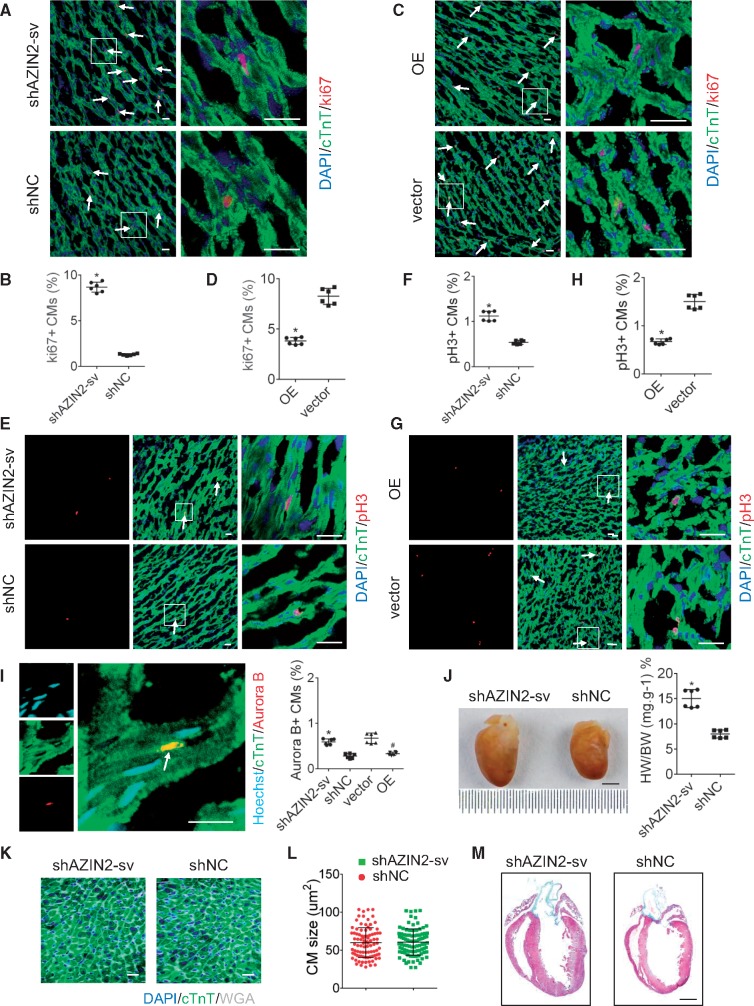
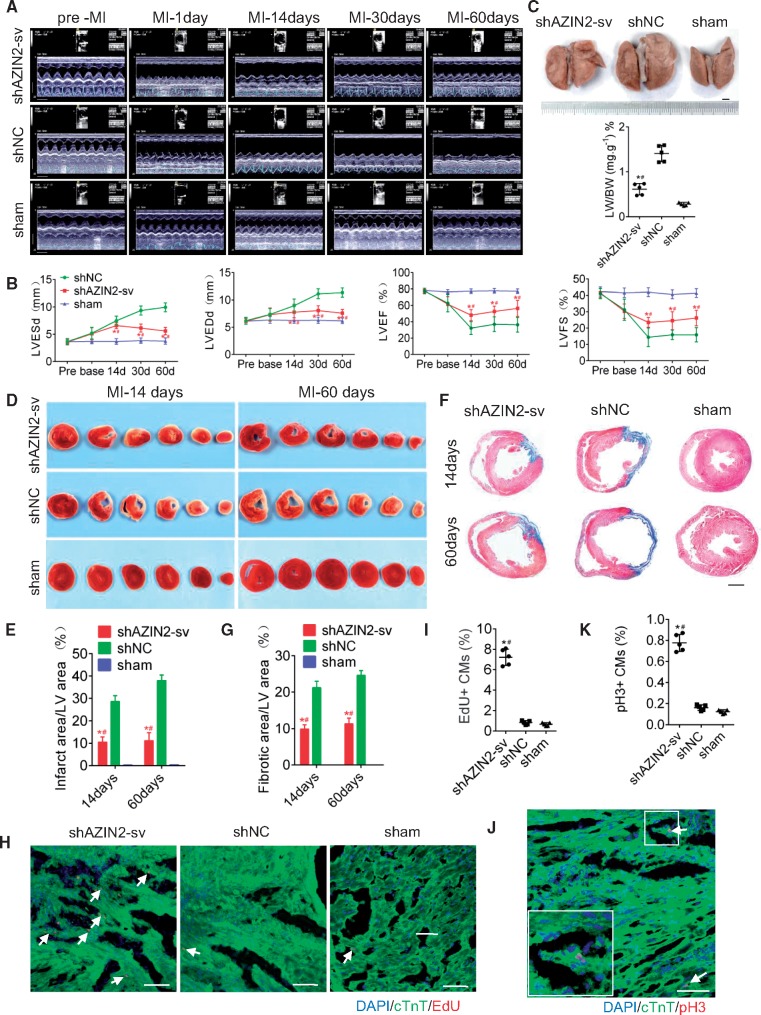
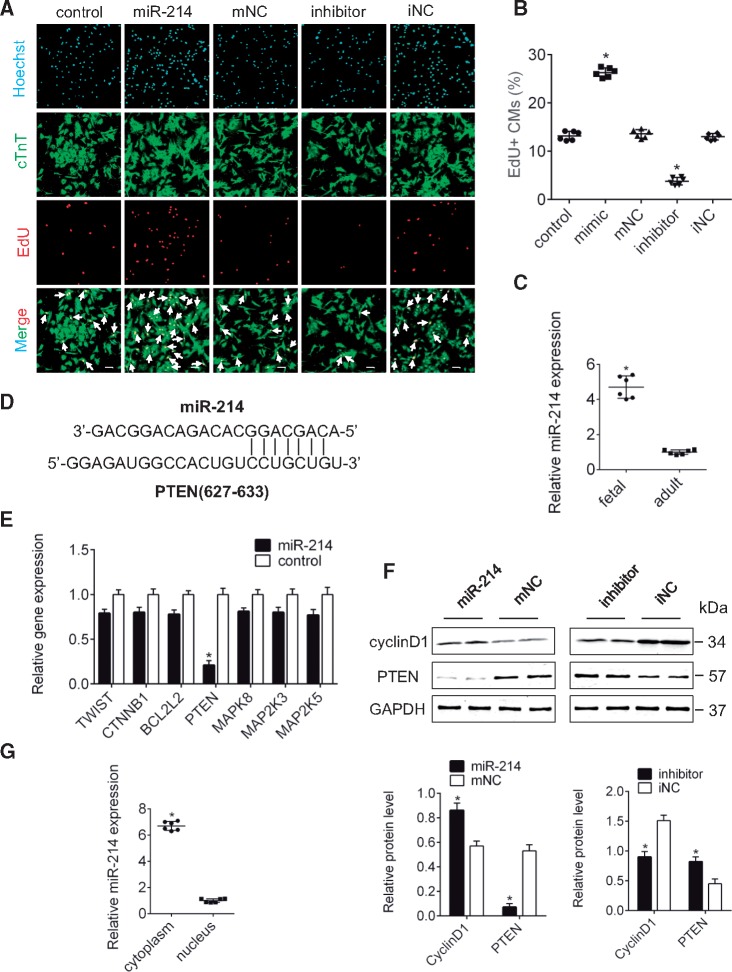
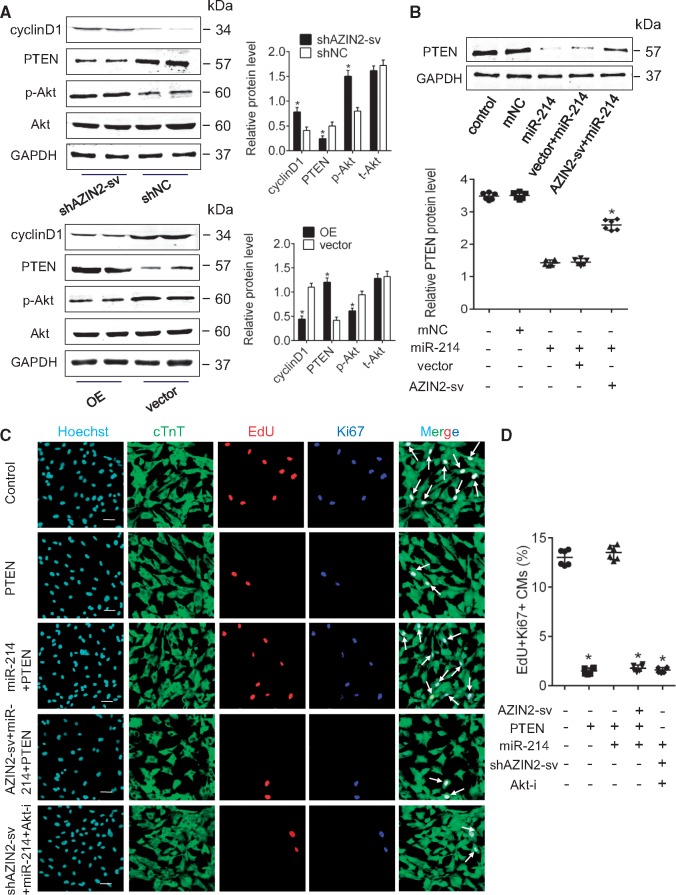
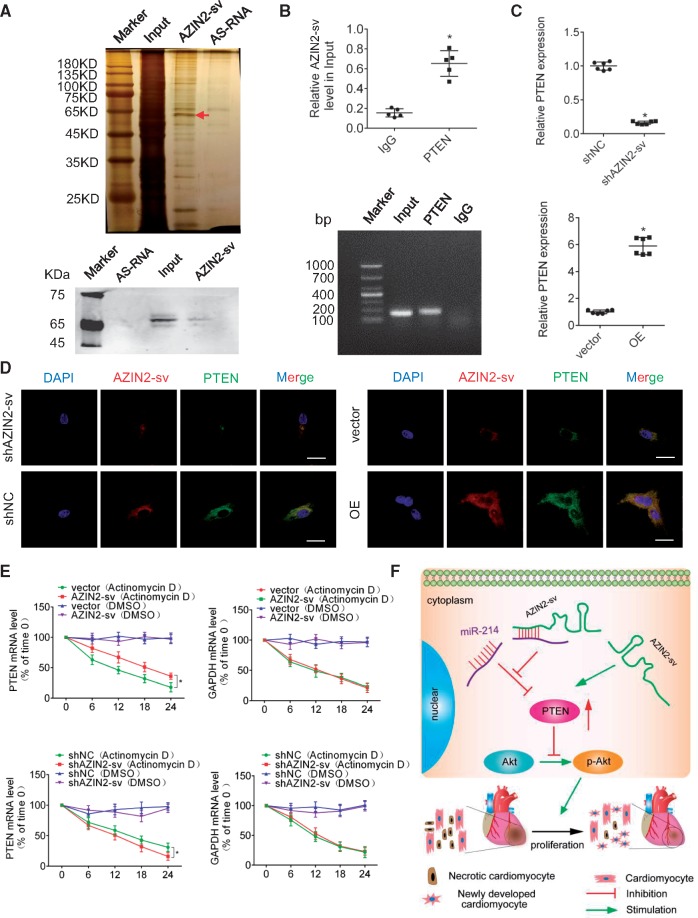
Methods and results: We compared RNA sequencing data from human foetal and adult hearts and identified a novel lncRNA that was upregulated in adult hearts (Genesymbol NONHSAG000971/NONHSAT002258 or ENST00000497710.5), which was a splice variant of the AZIN2 gene (AZIN2-sv). We used quantitative PCR to confirm the increased expression of AZIN2-sv in adult rat hearts. Coexpression network analysis indicated that AZIN2-sv could regulate proliferation. Loss- and gain-of-function approaches demonstrated that AZIN2-sv negatively regulated endogenous cardiomyocyte proliferation in vitro and in vivo. Knockdown of AZIN2-sv attenuated ventricular remodelling and improved cardiac function after myocardial infarction. Phosphatase and tensin homolog (PTEN) was identified as a target of AZIN2-sv, their direct binding increased PTEN stability. Furthermore, AZIN2-sv acted as a microRNA-214 sponge to release PTEN, which blocked activation of the PI3 kinase/Akt pathway to inhibit cardiomyocyte proliferation.

Conclusions: The newly discovered AZIN2-sv suppressed endogenous cardiac regeneration by targeting the PTEN/Akt pathway. Thus, AZIN2-sv may be a novel therapeutic target for preventing and treating heart failure.


Figures

Figure 1
Figure 1
AZIN2-sv is upregulated in adult hearts. (A) Cluster analysis identified upregulated AZIN2-sv in adult hearts. (B) qPCR in foetal and adult rats. *P< 0.05 vs. foetal rat group; n = 6 per group (Student’s t-test). (C) Gene expression of AZIN2-sv from D1 to D7 neonatal rats by qPCR. *P< 0.05 vs. D1 group; #P< 0.05 vs. D3 group; $P< 0.05 vs. D5 group; n = 6 per group (one-way ANOVA analysis with Dunnett C’s multiple comparison test). (D) Expression of AZIN2-sv in different tissues of D7 rats using qPCR. *P< 0.05 vs. brain; #P< 0.05 vs. lung; $P< 0.05 vs. liver; n = 6 per group (one-way ANOVA analysis with Dunnett C’s multiple comparison test). (E) A representative image of PCR products from 5′- and 3′-RACE. The major PCR product is indicated by arrow. (F) Coexpression network analysis of AZIN2-sv. Pink represents cell cycle-related mRNAs; red represents mRNAs regulating the cell cycle; green represents cell growth-related mRNAs; grey represents other unrelated mRNAs. (G) qPCR for several cell cycle-related mRNAs from coexpression analysis. *P< 0.05 vs. control; n = 6 per group (Student’s t-test).
Figure 2
Figure 2
AZIN2-sv reduces CM proliferation in vitro. (A) Immunostaining of D7 CMs for EdU and Ki-67 (bars, 40 μm). White arrows refer to EdU-positive and Ki-67-positive myocytes. (B) Quantification of EdU-positive and Ki-67-positive myocytes. *P< 0.05 vs. shNC; n = 6 per group (Student’s t-test). (C) Immunostaining of D1 CMs for EdU and Ki-67 (bars, 40 μm). White arrows refer to EdU-positive and Ki-67-positive myocytes. (D) Quantification of EdU-positive and Ki-67-positive myocytes. *P< 0.05 vs. vector; n = 6 per group (Student’s t-test). (E) Immunostaining of D7 and D1 CMs for pH3 (bars, 40 μm). White arrows refer to pH3-positive myocytes. *P< 0.05 vs. shNC or vector; n = 6 per group (Student’s t-test). (F) Representative fluorescent staining against Aurora B (bars, 40 μm). White arrows refer to Aurora B-positive myocytes. *P< 0.05 vs. shNC, #P< 0.05 vs. vector; n = 6 per group (Student’s t-test). (G) Protein level of pH3 (western blot) (GAPDH internal reference). (H) Quantification of pH3 protein level. *P< 0.05 vs. shNC, #P< 0.05 vs. vector; n = 5 per group (Student’s t-test). (I) Immunostaining of CFs for EdU (bars, 40 μm). (J) Quantification of EdU-positive CFs; n = 6 per group (one-way ANOVA analysis with Bonferroni’s multiple comparison test).
Figure 3
Figure 3
AZIN2-sv reduces myocardial proliferation in vivo. (A) Immunostaining of myocardial fibres in D7 rats for Ki-67 (bars, 40 μm). White arrows refer to Ki-67-positive myocytes. (B) Quantification of Ki-67-positive myocytes. *P< 0.05 vs. shNC; n = 6 per group (Student’s t-test). (C) Immunostaining of myocardial fibres in D1 rats for Ki-67 (bars, 40 μm). White arrows refer to Ki-67-positive myocytes. (D) Quantification of Ki-67-positive myocytes. *P< 0.05 vs. vector. n = 6 per group (Student’s t-test). (E) Immunostaining of myocardial fibres in D7 rats for pH3 (bars, 40 μm). White arrows refer to pH3-positive myocytes. (F) Quantification of pH3-positive myocytes. *P< 0.05 vs. shNC; n = 6 per group (Student’s t-test). (G) Immunostaining of myocardial fibres in D1 rats for pH3 (bars, 40 μm). White arrows refer to pH3-positive myocytes. (H) Quantification of pH3-positive myocytes. *P< 0.05 vs. vector; n = 6 per group (Student’s t-test). (I) Representative fluorescent staining against Aurora B (bars, 40 μm). White arrows refer to Aurora B-positive myocytes. *P< 0.05 vs. shNC, #P< 0.05 vs. vector; n = 6 per group (Student’s t-test). (J) Rat hearts transfected with shAZIN2-sv and shNC (12 days post-transduction) (bars, 2mm). *P< 0.05 vs. shNC; n = 6 per group (Student’s t-test). (K) WGA staining of left ventricular (LV) heart section (bars, 40 μm). (L) Quantitative analyses represent the counting of fields from six independent samples per group (n = 6) (Student’s t-test). (M) Representative masson trichrome staining of rat hearts 12 days injected with shAZIN2-sv or shNC to reveal muscle fibres (red) and collagen (blue) (bars, 500 μm); n = 6 per group.
Figure 4
Figure 4
Knockdown of AZIN2-sv reduces ventricular remodelling post-MI. (A) Evaluation of cardiac function by echocardiography at pre-MI and 1, 14, 30, and 60 days after MI (time stamps, 33 ms) (x axis); (bars, 5 mm) (y axis). (B) Quantitative analysis of LVEF, LVFS, LVEDd, LVESd. *P< 0.05 vs. shNC, #P< 0.05 vs. sham; n = 5 per group (one-way ANOVA analysis with Bonferroni’s multiple comparison test). (C) Representative images of lung from rats injected with shAZIN2-sv or shNC 6 weeks after MI (bars, 2 mm). *P< 0.05 vs. shNC, #P< 0.05 vs. sham; n = 5 per group (one-way ANOVA analysis with Dunnett C’s multiple comparison test). (D) TTC staining of rat ventricular cross sections at 14 and 60 days after MI. (E) Quantitative analysis of the infarcted area. *P< 0.05 vs. shNC, #P< 0.05 vs. sham; n = 5 per group (one-way ANOVA analysis with Bonferroni’s multiple comparison test). (F) Masson staining of rat mid-ventricular cross sections at 14 and 60 days after MI (bars, 500 μm). (G) Quantitative analysis of the fibrotic area. *P< 0.05 vs. shNC, #P< 0.05 vs. sham; n = 5 per group (one-way ANOVA analysis with Bonferroni’s multiple comparison test). (H) Immunostaining of myocardial fibres for EdU 7 days after MI in the peri-infarct area (bars, 40 μm). White arrows refer to EdU-positive myocytes. (I) Quantification of EdU-positive myocytes. *P< 0.05 vs. shNC, #P< 0.05 vs. sham; n = 5 per group (one-way ANOVA analysis with Dunnett C’s multiple comparison test). (J) Representative fluorescent staining against pH3 in the peri-infarct area (bars, 200 μm). White arrows refer to pH3-positive myocytes. (K) Quantification of pH3-positive myocytes. *P< 0.05 vs. shNC, #P< 0.05 vs. sham; n = 5 per group (one-way ANOVA analysis with Dunnett C’s multiple comparison test).
Figure 5
Figure 5
Interaction of AZIN2-sv and miR-214. (A) Nuclear and cytoplasmic distribution of AZIN2-sv in CMs by qPCR (U6 or actin internal reference). (B) Representative image of RNA FISH to confirm AZIN2-sv location in myocytes (bars, 40 μm). (C) miRNA binding with AZIN2-sv predicted by RNAhybrid. AZIN2-sv contains a site complementary to the seed sequence of miR-214. (D) Expression of miRNAs after knockdown of AZIN2-sv by qPCR. *P< 0.05 vs. control; n = 6 per group (Student’s t-test). (E) Construction of Luc-AZIN2-sv-wt and Luc-AZIN2-sv-mut vector. (F) Luciferase activity of CMs transfected with Luc-AZIN2-sv-wt or Luc-AZIN2-sv-mut. *P< 0.05 vs. WT with miR-214; n = 6 per group (two-way ANOVA analysis with Bonferroni’s multiple comparison test). (G) Co-precipitation between AZIN2-sv and miR-214 by pull-down assay. I, input (10% samples were loaded); P, pellet (100% samples were loaded).
Figure 6
Figure 6
miR-214 regulates PTEN level and of CMs proliferation. (A) Immunostaining for EdU in myocytes transfected with miR-214, inhibitor or control (bars, 40 μm). White arrows refer to EdU-positive myocytes. (B) Quantification of EdU-positive myocytes. *P< 0.05 vs. control; n = 6 per group (one-way ANOVA analysis with Bonferroni’s multiple comparison test). (C) qPCR for miR-214 in foetal and adult rats. *P< 0.05 vs. adult rat; n = 6 per group (Student’s t-test). (D) PTEN contains a site complementary to the seed sequence of miR-214. (E) Expression of target genes after overexpression of miR-214 according to qPCR. *P< 0.05 vs. control; n = 6 per group (Student’s t-test). (F) PTEN and cyclin D1 protein level when miR-214 was inhibited and overexpressed (western blot) (GAPDH internal reference). *P< 0.05 vs. mNC or iNC; n = 6 per group (Student’s t-test). (G) Location of miR-214 in CMs by qPCR. *P< 0.05 vs. nucleus; n = 6 per group (Student’s t-test).
Figure 7
Figure 7
AZIN2-sv regulates CM proliferation via miR-214/PTEN/Akt pathway. (A) The protein levels of cyclin D1, PTEN, Akt, and pAkt when AZIN2-sv was knocked down or overexpressed (western blot) (GAPDH internal reference). *P< 0.05 vs. shNC group or vector group; n = 6 per group (Student’s t-test). (B) PTEN protein level after AZIN2-sv and miR-214 interference (western blot) (GAPDH internal reference). AZIN2-sv offset the inhibitory effect of miR-214 on PTEN expression. *P< 0.05 vs. miR-214 group; n = 6 per group (one-way ANOVA analysis with Bonferroni’s multiple comparison test). (C) Immunostaining of EdU and Ki-67 in myocytes after PTEN, AZIN2-sv, and miR-214 interference (bars, 40 μm). White arrows refer to EdU-positive and Ki-67-positive myocytes. Enhanced miR-214 offset the inhibitory effects of PTEN on CM proliferation, and AZIN2-sv reduced CM proliferation, which was blocked by an Akt inhibitor. (D) Quantification of EdU-positive and Ki-67-positive myocytes. *P< 0.05 vs. control; n = 6 per group (one-way ANOVA analysis with Bonferroni’s multiple comparison test).
Figure 8
Figure 8
AZIN2-sv binds to PTEN and increase its stability. (A) Silver-stained SDS-PAGE gel of proteins immunoprecipitated by AZIN2-sv and its antisense RNA. The arrow indicates the region of the gel excised for mass spectrum determination. PTEN protein was assayed by western blotting. (B) RIP experiments were performed using an antibody against PTEN or negative IgG. The purified RNA was used for qPCR analysis, and enrichment of the lncRNA-AZIN2-sv was normalized to the input. *P< 0.05 vs. IgG; n = 5 per group (Student’s t-test). (C) PTEN mRNA level after reducing or overexpressing AZIN2-sv. *P< 0.05 vs. shNC or vector; n = 6 per group (Student’s t-test). (D) FISH and immunofluorescence showed colocalization of AZIN2-sv and PTEN when AZIN2-sv was knocked down and overexpressed (bars, 40 μm). (E) PTEN and GAPDH mRNA levels measured by qPCR when AZIN2-sv was overexpressed and knocked down. Actinomycin (50 μM) or DMSO (negative control) was used to block new RNA synthesis. *P< 0.05 vs. vector (Actinomycin D) or shNC (Actinomycin D); n = 6 per group (one-way ANOVA analysis with Bonferroni’s multiple comparison test). (F) Illustration of the mechanism underlying AZIN2-sv regulation of CM proliferation through the PTEN/Akt pathway.

Comment in

References

    1. Karra R, Poss KD.. Redirecting cardiac growth mechanisms for therapeutic regeneration. J Clin Invest 2017;127:427–436. - PMC - PubMed
    1. Laflamme MA, Murry CE.. Heart regeneration. Nature 2011;473:326–335. - PMC - PubMed
    1. Afzal MR, Samanta A, Shah ZI, Jeevanantham V, Abdel-Latif A, Zuba-Surma EK, Dawn B.. Adult bone marrow cell therapy for ischemic heart disease: evidence and insights from randomized controlled trials. Circ Res 2015;117:558–575. - PMC - PubMed
    1. Senyo SE, Steinhauser ML, Pizzimenti CL, Yang VK, Cai L, Wang M, Wu TD, Guerquin-Kern JL, Lechene CP, Lee RT.. Mammalian heart renewal by pre-existing cardiomyocytes. Nature 2013;493:433–436. - PMC - PubMed
    1. Bergmann O, Bhardwaj RD, Bernard S, Zdunek S, Barnabé-Heider F, Walsh S, Zupicich J, Alkass K, Buchholz BA, Druid H, Jovinge S, Frisén J.. Evidence for cardiomyocyte renewal in humans. Science (New York, NY) 2009;324:98–102. - PMC - PubMed

Publication types

MeSH terms