. 2018 Mar 26;44(6):679-693.e5.
doi: 10.1016/j.devcel.2018.02.024.

Developmental History Provides a Roadmap for the Emergence of Tumor Plasticity

Affiliations

Developmental History Provides a Roadmap for the Emergence of Tumor Plasticity

Purushothama Rao Tata et al. Dev Cell. .

Abstract

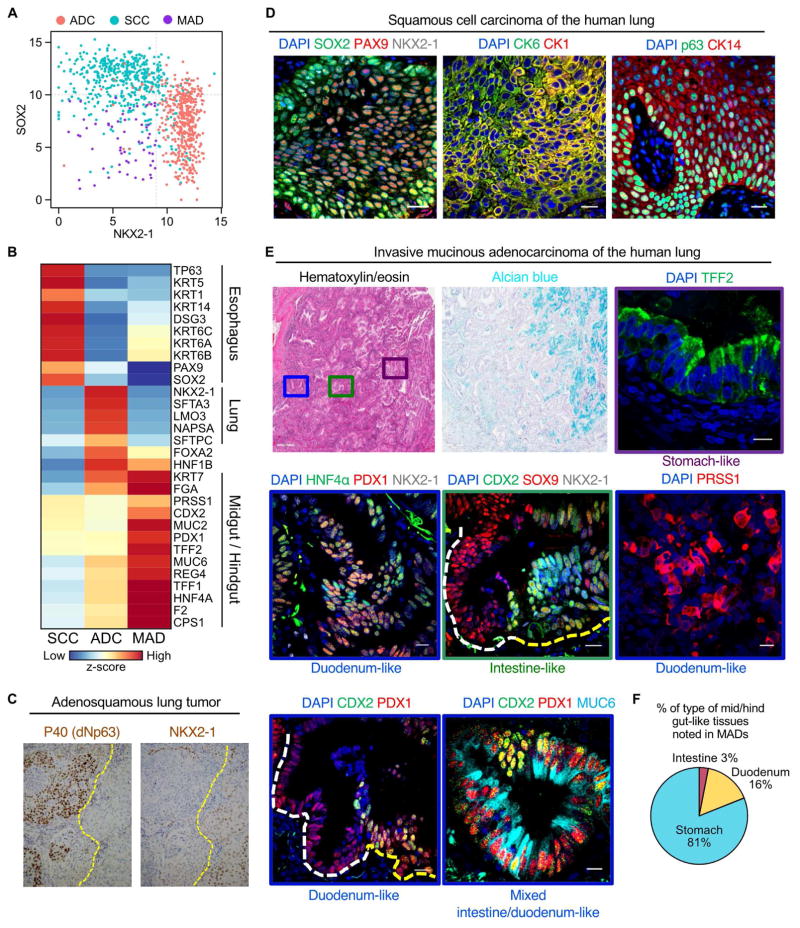
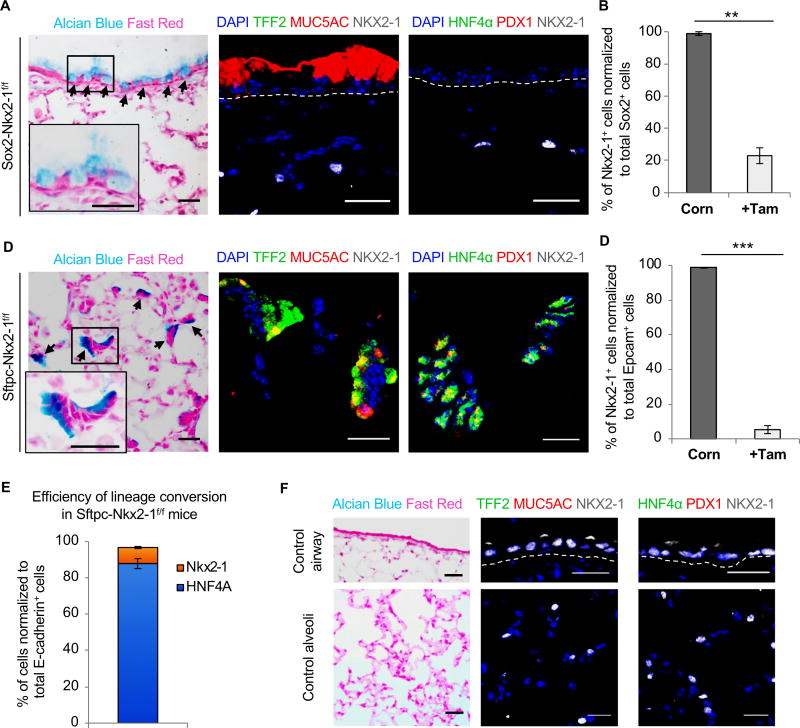
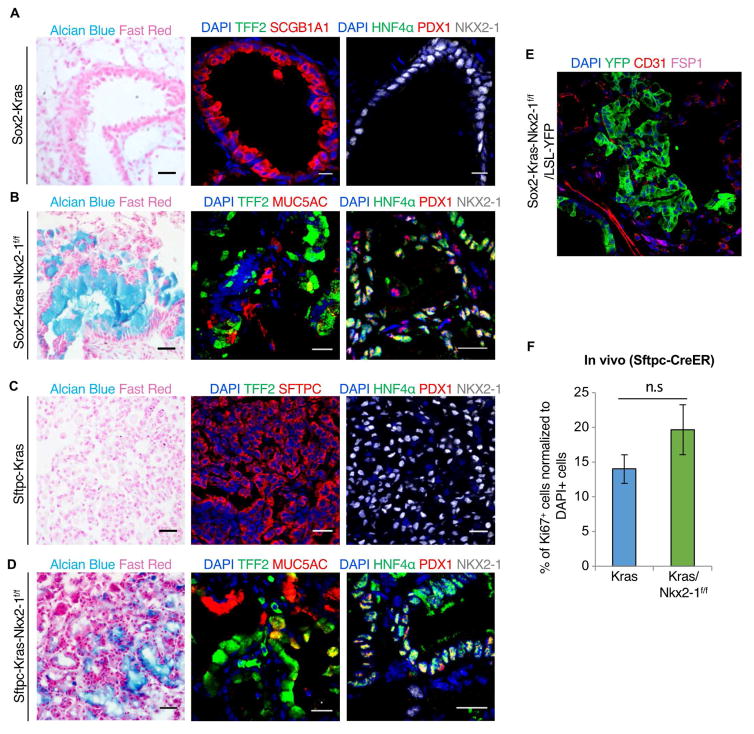
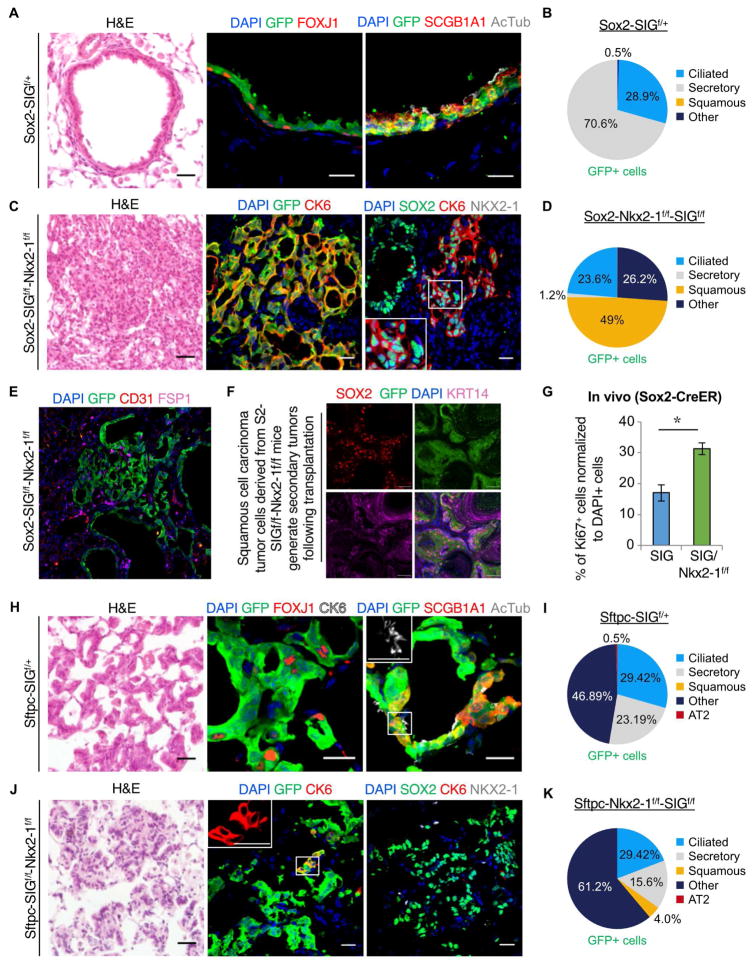
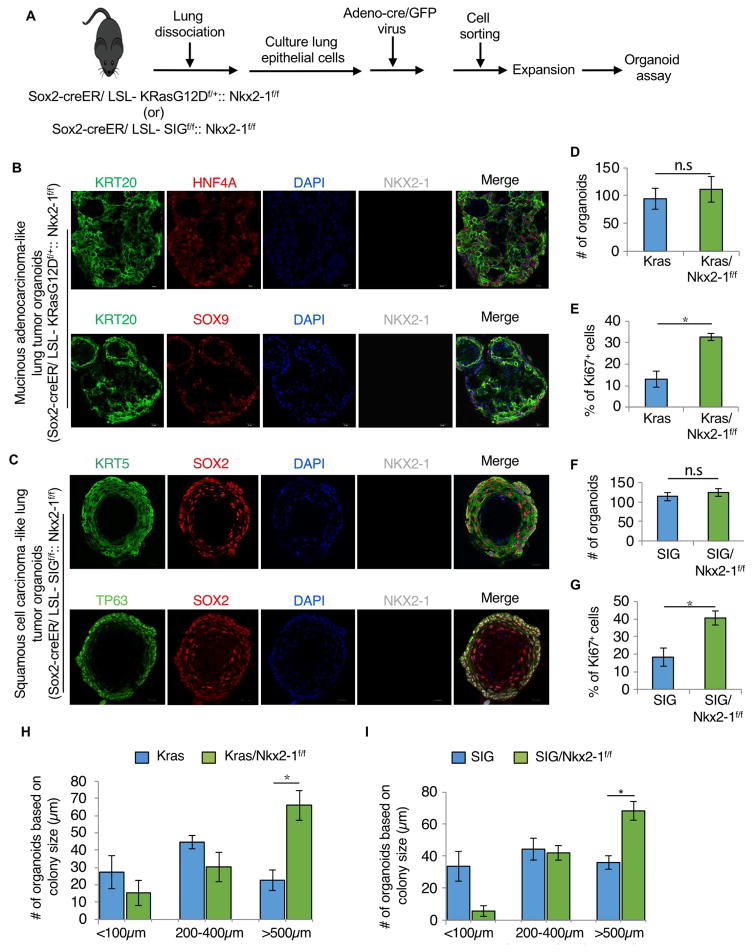
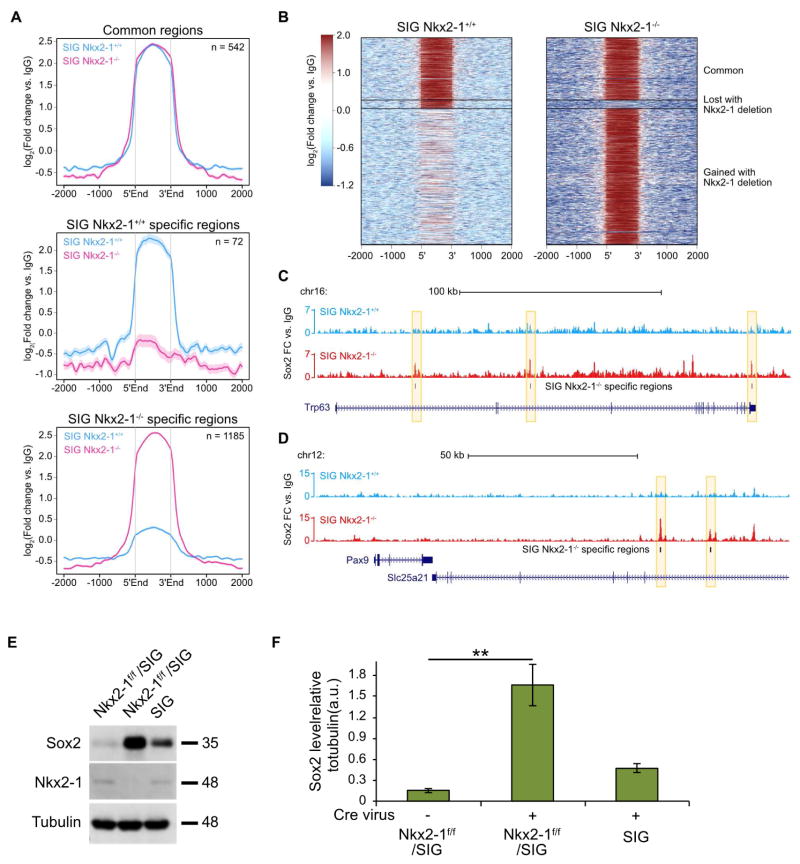
We show that the loss or gain of transcription factor programs that govern embryonic cell-fate specification is associated with a form of tumor plasticity characterized by the acquisition of alternative cell fates normally characteristic of adjacent organs. In human non-small cell lung cancers, downregulation of the lung lineage-specifying TF NKX2-1 is associated with tumors bearing features of various gut tissues. Loss of Nkx2-1 from murine alveolar, but not airway, epithelium results in conversion of lung cells to gastric-like cells. Superimposing oncogenic Kras activation enables further plasticity in both alveolar and airway epithelium, producing tumors that adopt midgut and hindgut fates. Conversely, coupling Nkx2-1 loss with foregut lineage-specifying SOX2 overexpression drives the formation of squamous cancers with features of esophageal differentiation. These findings demonstrate that elements of pathologic tumor plasticity mirror the normal developmental history of organs in that cancer cells acquire cell fates associated with developmentally related neighboring organs.

Keywords: Waddington landscape; developmental history; non-small cell lung cancers; transdifferentiation; tumor heterogeneity; tumor plasticity.


Conflict of interest statement

Declaration of interests:

The authors declare no competing interests.

Figures

Figure 1
Figure 1. Molecular and histologic features of human NSCLCs are reminiscent of embryonic gut endodermal patterning events
A, Classification of non-small cell lung tumors (n = 1019) into three groups by expression of SOX2 and NKX2-1. ADC (adenocarcinoma, n = 474), SCC (squamous cell carcinoma, n = 485), and MAD (mucinous adenocarcinoma, n = 60). B, Heat map of select differentially expressed genes. C, Immunohistochemistry for an SCC marker p40 (left) and an ADC marker NKX2-1 (right) on an adenosquamous lung tumor. Yellow dotted line indicates the boundary between SCC and ADC within a single tumor. D, Immunostaining on sections from human SCC for SOX2 (green), PAX9 (red), and NKX2-1(white) (left), CK6 (green) and CK1 (red) (middle), p63 (green) and CK14 (red) (right). E, Immunostaining on serial sections from human MADs. H&E (top row, left), Alcian blue (top row, center), and TFF2 (green) (top row, right); HNF4α (green), PDX1 (red), and NKX2-1 (white) (middle row, left); CDX2 (green), SOX9 (red), and NKX2-1 (white) (middle row, center); PRSS1 (red) (middle row, right). CDX2 (green) and PDX1 (red) (bottom row, left); CDX2 (green), PDX1 (red), and MUC6 (cyan) (bottom row, center). Dotted lines correspond to boundaries in organ-specific differentiation in contiguous gut epithelia. Color-coded boxes in the top, middle and bottom panels correspond to specified regions on the H&E image. F, Pie chart of the dominant tissue types identified in human MADs (n = 23). Blue, stomach-like; yellow, duodenum-like; red, intestine-like. Nuclei, DAPI. Scale bars, 20 μm. See also Figure S1, 2, and 3.
Figure 2
Figure 2. Alveolar cells, but not airway cells, convert into alternate gut-like cell fates after loss of the lung lineage-specifying transcription factor Nkx2-1
A, Immunostaining on sections from Sox2-Nkx2-1f/f mice (n = 3). Alcian Blue and Fast Red staining (left). Enlargements show the black boxed regions at higher magnification. Immunofluorescence for TFF2 (green), MUC5AC (red), and NKX2-1 (white) (middle), HNF4α (green), PDX1 (red), and NKX2-1 (white) (right). Nuclei, DAPI (blue). Black arrows, areas of mucous differentiation. B, Quantification of Nkx2-1+ cells normalized to total Sox2+ cells in the airways of Sox2-Nkx2-1f/f mice (n = 3). Mice treated with tamoxifen had significantly fewer Nkx2-1+ cells (two-sided t test, **P < 0.01). C, Immunostaining on sections from Sftpc-Nkx2-1f/f mice (n = 4). Alcian Blue and Fast Red staining (left). Insets show the black boxed regions at higher magnification. Immunofluorescence for TFF2 (green), MUC5AC (red), and NKX2-1 (white) (middle), HNF4α (green), PDX1 (red), and NKX2-1 (white) (right). Nuclei, DAPI (blue). Black arrows, areas of mucous differentiation. D, Quantification of Nkx2-1+ cells normalized to total EpCAM+ cells in the alveoli of Sftpc-Nkx2-1f/f mice (n = 3). Mice treated with tamoxifen had significantly fewer Nkx2-1+ cells (two-sided t test, ***P < 0.001). E, Quantification of Nkx2-1+ (orange) and Hnf4a+ (blue) cells in the alveoli of Sftpc-Nkx2-1f/f mice (n = 3), normalized to total E-cadherin+ cells. F, Immunostaining on sections from control airway (top row) (n = 3) and control alveoli (bottom row) (n = 3). Alcian Blue and Fast Red (left), TFF2 (green), MUC5AC (red), and NKX2-1 (white) (middle), HNF4α (green), PDX1 (red), and NKX2-1 (white) (right). Nuclei, DAPI (blue). Scale bars, 20 μm. Quantification data are shown in terms of mean ± s.e.m.
Figure 3
Figure 3. Concurrent loss of Nkx2-1 and oncogene activation leads to acquisition of mid/hindgut-like cell fates in lung mucinous adenocarcinomas
A, Immunostaining on sections from Sox2-Kras mice (n = 3). Alcian Blue and Fast Red staining (left). Immunofluorescence for TFF2 (green) and SCGB1A1 (red) (middle), HNF4α (green), PDX1 (red), and NKX2-1 (white) (right). B, Immunostaining on sections from Sox2-Kras-Nkx2-1f/f mice (n = 4). Alcian Blue and Fast Red staining (left). Immunofluorescence for TFF2 (green) and MUC5AC (red) (middle), HNF4α (green), PDX1 (red), and NKX2-1 (white) (right). C, Immunostaining on sections from Sftpc-Kras mice (n = 6). Alcian Blue and Fast Red staining (left). Immunostaining for TFF2 (green) and SFTPC (red) (middle), HNF4α (green), PDX1 (red), and NKX2-1 (white) (right). D, Immunostaining on sections from Sftpc-Kras-Nkx2-1f/f mice (n = 4). Alcian Blue and Fast Red staining (left). Immunostaining for TFF2 (green) and MUC5AC (red) (middle), HNF4α (green), PDX1 (red), and NKX2-1 (white) (right). Nuclei, DAPI (blue). Scale bars, 20 μm. E, Immunostaining on sections from Sox2-Kras-Nkx2-1+/+/LSL-YFP mice for YFP/GFP (green), CD31 (red), and FSP1 (purple). Nuclei, DAPI (blue). F, Quantification of Ki67+ proliferating cells among total DAPI+ cells in Sftpc-Kras (blue) (n = 3) and Sftpc-Kras-Nkx2-1f/f (green) (n = 3) mice. The proportion of Ki67+ cells was not significantly different between the two genotypes (two-sided t test, P > 0.05). Quantification data are shown in terms of mean ± s.e.m. See also Figure S4.
Figure 4
Figure 4. Loss of Nkx2-1 and gain of Sox2 induces conversion of lung epithelium into esophageal-like squamous epithelium in lung squamous cell carcinoma
A, Staining on sections from Sox2-SIGf/+ mice (n = 4). Hematoxylin and eosin staining (left). Immunofluorescence for GFP (green), FOXJ1 (red) and CK6 (white) (middle), GFP (green), SCGB1A1 (red), and AcTub (white) (right). B, Quantification of GFP+ cells in Sox2-SIGf/+ (n = 3) lungs. Ciliated cells (blue), secretory cells (gray), squamous cells (orange), and all other cells (navy). C, Staining on sections from Sox2-Nkx2-1f/f-SIGf/f mice (n = 8 mice). Hematoxylin and eosin staining (left). Immunostaining for GFP (green) and CK6 (red) (middle), SOX2 (green), CK6 (red), and NKX2-1 (white) (right). D, Quantification of GFP+ cells in Sox2-Nkx2-1f/f-SIGf/f (n = 7; right) lungs. Ciliated cells (blue), secretory cells (gray), squamous cells (orange), and all other cells (navy). E, Immunostaining on sections from Sox2-SIGf/f-Nkx2-1f/f mice for YFP/GFP (green), CD31 (red), and FSP1 (purple). Nuclei, DAPI (blue). F, Tumors derived from subcutaneous grafts were stained for SOX2 (red), GFP (green), and KRT14 (purple). G, Quantification of Ki67+ proliferating cells among total DAPI+ cells. Sox2-Nkx2-1f/f-SIGf/f mice had significantly more Ki67+ cells than Sox2-Nkx2-1f/f mice (two-sided t test, *P < 0.05). H, Immunostaining on sections from Sftpc-SIGf/+ mice (n = 3). Hematoxylin and eosin staining (left). Immunostaining for GFP (green), FOXJ1 (red) and CK6 (white) (middle), GFP (green), SCGB1A1 (red), and AcTub (white) (right). I, Quantification of GFP+ cells in Sftpc-SIGf/+ (n = 3) lungs. Ciliated cells (blue), secretory cells (gray), squamous cells (orange), alveolar type II (AT2) cells (red), and all other cells (navy). J, Immunostaining on sections from Sftpc-Nkx2-1f/f-SIGf/f mice (n = 4). Hematoxylin and eosin staining (left). Immunostaining for GFP (green) and CK6 (red) (middle), SOX2 (green), CK6 (red), and NKX2-1 (white) (right). K, Quantification of GFP+ cells in Sftpc-Nkx2-1f/f-SIGf/f (n = 4) lungs. Ciliated cells (blue), secretory cells (gray), squamous cells (orange), alveolar type II (AT2) cells (red), and all other cells (navy). Insets show the white boxed regions at higher magnification. Nuclei, DAPI (blue). Quantification data are shown in terms of mean ± s.e.m. Scale bars, 20 μm. See also Figure S4.
Figure 5
Figure 5. Concurrent loss of Nkx2-1 and gain of oncogenes results in conversion of lung epithelium into foregut-like or mid/hindgut-like tissues in organoid cultures independent of stromal cells
A, Schematic representation of the isolation and organoid culture of lung epithelial cells from Sox2-creER/SIGf/f::Nkx2-1f/f and Sox2-creER/KrasG12D::Nkx2-1f/f mice. B, Immunostaining for mid/hindgut markers KRT20 (green), HNF4A or SOX9 (red), and lung epithelial marker Nkx2-1 (gray) on organoid sections derived from Sox2-creER/KrasG12D:Nkx2-1f/f. C, Immunostaining for foregut squamous epithelial markers KRT5 or TP63 (green), SOX2 (red), and lung epithelial marker Nkx2-1 (gray) on organoid sections derived from Sox2-creER/SIGf/f:Nkx2-1f/f. D, Colony forming efficiency of Sox2-Kras and Sox2-Kras/Nkx2-1f/f cells was not significantly different. E, Percentage of Ki67+ cells was significantly higher in Sox2-Kras/Nkx2-1f/f cells than in Sox2-Kras cells (two-sided t test, *P < 0.05). F, Colony forming efficiency of Sox2-SIG and Sox2-SIG/Nkx2-1f/f cells was not significantly different. G, Percentage of Ki67+ cells was significantly higher in Sox2-SIG/Nkx2-1f/f cells than in Sox2-SIG cells (two-sided t test, *P < 0.05). H and I, Quantitative analysis of the size of the organoids derived from SIG and SIGf/f-Nkx2-1f/f (H) and Kras and Kras-Nkx2-1f/f mice (I) (two-sided t test, *P < 0.05). Quantification data are shown in terms of mean ± s.e.m. Scale bars 20 μm.
Figure 6
Figure 6. Nkx2-1 deletion enhances SOX2 expression and rewires SOX2 genomic occupancy towards a squamous gene program
A, Average Sox2 ChIP-seq profiles of common regions (n = 542), SIG Nkx2-1+/+ specific regions (n = 72), and SIG Nkx2-1−/− specific regions (n = 1185). SIG Nkx2-1+/+ signal is marked in blue, while the signal for SIG Nkx2-1−/− is denoted in pink. Data are shown in terms of log2 fold change vs. corresponding IgG ChIP controls. B, Heat map of Sox2 ChIP-seq signal in SIG Nkx2-1+/+ (left) and SIG Nkx2-1−/− (right) treatment conditions. The comparison revealed three clusters of Sox2-bound regions: common regions, SIG Nkx2-1+/+ specific regions, and SIG Nkx2-1−/− specific regions. Data are shown in terms of log2 fold change vs. corresponding IgG ChIP controls. C, Normalized Sox2 ChIP-seq signal in SIG Nkx2-1+/+ (top, blue) and SIG Nkx2-1−/− (bottom, red) treatment conditions at the Trp63 locus. Peak calls specific to SIG Nkx2-1−/− are indicated in black bars and highlighted in yellow. Data have been normalized to millions of reads mapped and are shown in terms of fold change vs. corresponding IgG ChIP controls. D, Normalized Sox2 ChIP-seq signal in SIG Nkx2-1+/+ (top, blue) and SIG Nkx2-1−/− (bottom, red) treatment conditions at putative Pax9 3′ enhancers (Slc25a21). Peak calls specific to SIG Nkx2-1−/− are indicated in black bars and highlighted in yellow. Data have been normalized to millions of reads mapped and are shown in terms of fold change vs. corresponding IgG ChIP controls. e, Western blot analysis for SOX2 (35 kDa) (top row), Nkx2-1 (48 kDa) (middle row), and tubulin (48 kDa, loading control) (bottom row) in lung cells from SIG and Nkx2-1f/f-SIGf/f mice, with or without Cre virus. F, Quantification of SOX2 Western blot signal in (E), normalized to tubulin. Sox2 protein levels were significantly higher in Nkx2-1f/f-SIGf/f cells treated with Cre virus as compared to untreated controls (two-sided t test, **P < 0.01). Nuclei, DAPI (blue). Quantification data are shown in terms of mean ± s.e.m. See also Figure S5.

References

    1. Antonini D, Sirico A, Aberdam E, Ambrosio R, Campanile C, Fagoonee S, Altruda F, Aberdam D, Brissette JL, Missero C. A composite enhancer regulates p63 gene expression in epidermal morphogenesis and in keratinocyte differentiation by multiple mechanisms. Nucleic Acids Res. 2015;43:862–874. - PMC - PubMed
    1. Arnold K, Sarkar A, Yram MA, Polo JM, Bronson R, Sengupta S, Seandel M, Geijsen N, Hochedlinger K. Sox2(+) adult stem and progenitor cells are important for tissue regeneration and survival of mice. Cell Stem Cell. 2011;9:317–329. - PMC - PubMed
    1. Bass AJ, Watanabe H, Mermel CH, Yu S, Perner S, Verhaak RG, Kim SY, Wardwell L, Tamayo P, Gat-Viks I, et al. SOX2 is an amplified lineage-survival oncogene in lung and esophageal squamous cell carcinomas. Nat Genet. 2009;41:1238–1242. - PMC - PubMed
    1. Blanpain C. Tracing the cellular origin of cancer. Nat Cell Biol. 2013;15:126–134. - PubMed
    1. Campbell JD, Alexandrov A, Kim J, Wala J, Berger AH, Pedamallu CS, Shukla SA, Guo G, Brooks AN, Murray BA, et al. Distinct patterns of somatic genome alterations in lung adenocarcinomas and squamous cell carcinomas. Nat Genet. 2016;48:607–616. - PMC - PubMed

Publication types

MeSH terms