. 2018 Mar 26;44(6):752-761.e4.
doi: 10.1016/j.devcel.2018.03.001.

Spatial-Temporal Lineage Restrictions of Embryonic p63+ Progenitors Establish Distinct Stem Cell Pools in Adult Airways

Affiliations

Spatial-Temporal Lineage Restrictions of Embryonic p63+ Progenitors Establish Distinct Stem Cell Pools in Adult Airways

Ying Yang et al. Dev Cell. .

Abstract

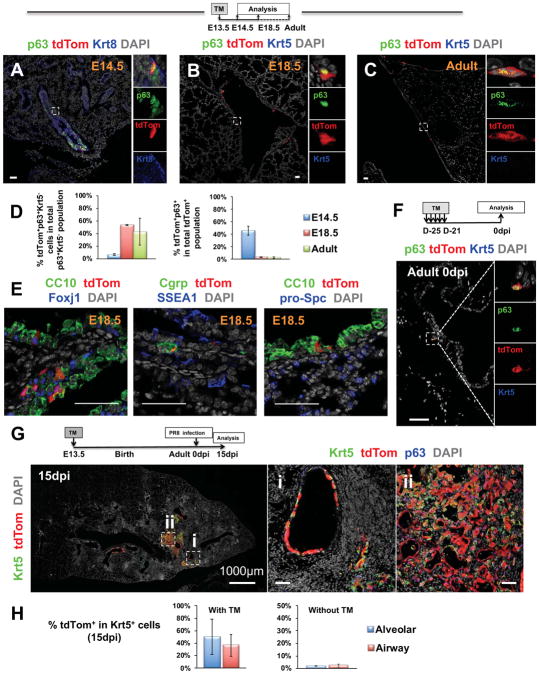
Basal cells (BCs) are p63-expressing multipotent progenitors of skin, tracheoesophageal and urinary tracts. p63 is abundant in developing airways; however, it remains largely unclear how embryonic p63+ cells contribute to the developing and postnatal respiratory tract epithelium, and ultimately how they relate to adult BCs. Using lineage-tracing and functional approaches in vivo, we show that p63+ cells arising from the lung primordium are initially multipotent progenitors of airway and alveolar lineages but later become restricted proximally to generate the tracheal adult stem cell pool. In intrapulmonary airways, these cells are maintained immature to adulthood in bronchi, establishing a rare p63+Krt5- progenitor cell population that responds to H1N1 virus-induced severe injury. Intriguingly, this pool includes a CC10 lineage-labeled p63+Krt5- cell subpopulation required for a full H1N1-response. These data elucidate key aspects in the establishment of regionally distinct adult stem cell pools in the respiratory system, potentially with relevance to other organs.

Keywords: H1N1; airway progenitors; basal cells; influenza A; lineage tracing; p63; stem cell.


Conflict of interest statement

Declaration of Interests

The authors declare no competing interests.

Figures

Figure 1
Figure 1. p63 labels multipotent progenitors of airways and alveoli and later become lineage-restricted to airways
(A) Immunofluorescence (IF) of E9.5 and E10.5 Nkx2.1-GFP embryos; boxed areas enlarged in right panels. GFP+p63+ cells in lung (arrowheads) or tracheal (arrow) primordia. (*) GFP+p63 in lung. (B–C) p63-CreERT2; R26-tdTomato lineage labeling. E18.5 trachea (top panels) and lungs (bottom panels: intrapulmonary airways and alveolar saccules) from embryos exposed to TM at E9.5 (left) or E10.5 (right). tdTom+ double-labeling with cell type-specific differentiation marker: insets depict secretory (CC10), neuroendocrine (Cgrp), alveolar type 1 (Pdpn) and type 2 (pro-Spc) cells. Labeling pattern similar in trachea but dramatically different in lung indicative of lineage restriction. E9.5 tracing: N=11 embryos from 3 litters, all with extensive tdTom labeling in alveolar compartment; E10.5 tracing: N=7 embryos from 2 litters, all with minimal tdTom labeling in alveolar compartment. For TM exposure after E10.5: N>18 from at least 8 litters, none with alveolar labeling. Scale bars: 10μm unless noted. See also Figure S1 and Movies S1–3.
Figure 2
Figure 2. Lineage restriction of p63+ cells establishes the basal stem cell pool of developing trachea with equal contributions to ciliated and secretory lineages
(A–C) Lineage tracing of p63-CreERT2; R26-tdTomato embryos: TM at E17.5, E14.5 or E13.5. Left graphs: % tdTom+p63+ cells in total p63+ population; right graphs: % tdTom+p63 cells in total p63 population at each stage. (D) p63-CreERT2; R26-tdTomato mice exposed to EdU and TM simultaneously at E13.5, E14.5 or E17.5. EdU incorporation and lineage-labeling analysis in tracheal sections after 24hr: p63+ (tdTom+ or tdTom) or p63 cells (representative images and quantification). (E–F) Immunofluorescence (IF) of tracheal sections from p63-CreERT2; R26-tdTomato mice. Contribution of embryonic p63 to luminal tracheal secretory and ciliated cells pre- and postnatally. TM exposure at E13.5 or E14.5 and analysis at E18.5, P0-P21. tdTom double-labeled with differentiation marker; dotted area shown as single channel in lateral panels or insets. Graph: % tdTom+ cells in ciliated and secretory cells at E18.5. All graphs: mean ± SEM from 6–12 fields per sample, N>=3 per stage, except P7 in E14.5 tracing (N=2); details in Table S1. Statistics: one-way ANOVA, *P<0.05; **P<0.01; ***P<0.001; ****P<0.0001; n.s. non-significant. Scale bars: 10μm. See also Figure S2 and Table S1.
Figure 3
Figure 3. p63 KO mutants have preserved luminal lineage balance with altered maturation and organization of the pseudostratified epithelium
(A–E) Tracheal differentiation in E18.5 WT and p63 null (KO) mice. (A) IF, markers of basal (p63, Krt5), luminal (Krt8), secretory (CC10, SSEA1), ciliated (Foxj1, A-tub), airway progenitor (Sox2) cells. Far right panel: maximum projection of confocal z-stack images showing colocalization of A-tub+ cilia and Foxj1+ nuclei; magenta arrows showing Foxj1+ ciliated cells without cilia. (B) qRT-PCR, p63, Foxj1, CC10, Jag2 (Notch ligand), Scgb3a2 (secretory marker), (C) Morphometric analysis of A-tub and SSEA1. (D) E18.5 intrapulmonary airways of WT and p63 KO showing similar expression of Cgrp and Sgb3a2 (neuroendocrine and secretory cell markers). (E) Alcian Blue and A-tub staining of E18.5 WT and KO tracheas: Brown arrows showing A-tub+ cilia; Cyan arrows showing Alcian Blue+ goblet cells. (F) IF showing simplified epithelial structure from the pseudostratified tracheal epithelium in the KOs at E18.5; graph: epithelial cell number per unit basement membrane length (mm). (G) p63-CreERT2 lineage tracing and IF showing Notch3+tdTom+ in tracheal epithelium at E18.5 (TM administration at E13.5); insets: single channels depicted from boxed area. (H) IF E18.5 tracheal sections: Strong Notch3 nuclear staining in suprabasal cells of WT (nuclear Sox2 in all epithelial cells), however in p63 KO Notch3 was diffusely expressed at low levels in cytoplasm and no longer in the nucleus. Graphs: mean ± SEM from 6–12 fields per sample, N>=3, details in Table S1. Statistics: Student’s t-test: *P<0.05; **P<0.01; ****P<0.0001; n.s. non-significant. Scale bars: 10μm. See also Figure S2 and Table S1.
Figure 4
Figure 4. Embryonic intrapulmonary p63+ progenitors are maintained immature throughout adulthood and mediate the H1N1 aberrant alveolar remodeling
(A–E) Lineage tracing of p63+ descendants in intrapulmonary airways at E14.5, E18.5 and adult lung: TM in E13.5 p63-CreERT2; R26-tdTomato mice. IF tdTom double-labeled with p63 (A–C) or markers of airway/alveolar differentiation (E) Left graph: % tdTom+p63+Krt5 cells in total intrapulmonary p63+Krt5 cells; right graph: % tdTom+p63+ cells in total intrapulmonary tdTom+ cells. (F) p63+Krt5tdTom+ cells in adult intrapulmonary bronchi in mice exposed to TM in adulthood (compare to C). (G) Adult lung from mice exposed to TM at E13.5 and infected with H1N1 at 8 weeks. IF at 15dpi: p63+tdTom+Krt5+ cells in intrapulmonary bronchi (i) and as alveolar clusters (ii. pods); boxed areas magnified in right panels. Graphs: % tdTom+Krt5+ cells in the H1N1-induced ectopic Krt5+ cells in the mice with TM treatment at E13.5 (left) or without TM exposure (right). Graphs: mean ± SEM, N>=3 except E18.5 in E13.5 tracing (N=2), details in Table S1. Scale bars: 50μm unless noted. See also Figure S3, Movie S4 and Table S1.
Figure 5
Figure 5. Intrapulmonary p63+Krt5 progenitors include a subpopulation of CC10 lineage-labeled cells responsible for H1N1 induction of pods
(A) CC10-CreERT2 adult mice exposed to H1N1 after 21days of TM exposure. IF: lung sections at 15dpi with CC10 lineage-labeled airways and Krt5+ clusters overlapping partially with lineage-negative Krt5+ clusters (green). (B) IF: tdTom+ “trail” expanding to alveolar compartment. (C) Graphs: % tdTom+Krt5+ cells in the H1N1 induced ectopic Krt5+ cells in the mice with TM treatment in adulthood (left) or without TM exposure (right). (D) p63-CreERT2 adult lung at 15dpi: IF: less pods compared to CC10-CreERT2 suggestive of a more attenuated response to H1N1. (E) Uninjured adult CC10-CreERT2 mice 21 days after Tm: rare CC10 lineage-labeled p63+Krt5 progenitors in intrapulmonary main bronchi (i) near unlabeled p63+Krt5 cells (ii). Graph: % tdTom+p63+Krt5 cells in total intrapulmonary p63+Krt5 cells. Graphs: mean ± SEM, N>=3, details in Table S1. Scale bars: 50μm unless noted. See also Figures S4–5 and Tables S1–2.

Comment in

Similar articles

Cited by

References

    1. Bilodeau M, Shojaie S, Ackerley C, Post M, Rossant J. Identification of a proximal progenitor population from murine fetal lungs with clonogenic and multilineage differentiation potential. Stem Cell Reports. 2014;3:634–649. - PMC - PubMed
    1. Daniely Y, Liao G, Dixon D, Linnoila RI, Lori A, Randell SH, Oren M, Jetten AM. Critical role of p63 in the development of a normal esophageal and tracheobronchial epithelium. Am J Physiol Cell Physiol. 2004;287:C171–C181. - PubMed
    1. Desai TJ, Brownfield DG, Krasnow MA. Alveolar progenitor and stem cells in lung development, renewal and cancer. Nature. 2014;507:190–194. - PMC - PubMed
    1. Fre S, Hannezo E, Sale S, Huyghe M, Lafkas D, Kissel H, Louvi A, Greve J, Louvard D, Artavanis-Tsakonas S. Notch lineages and activity in intestinal stem cells determined by a new set of knock-in mice. PLoS ONE. 2011;6(10):e25785. - PMC - PubMed
    1. Guhar A, Deshpande A, Jain A, Sebastiani, Cardoso WV. Uroplakin 3a+ cells are a distinctive population of epithelial progenitors that contribute to airway maintenance and post-injury repair. Cell Reports. 2017;19:246–254. - PubMed

Publication types

MeSH terms