. 2018 Mar 26;11(4):490.
doi: 10.3390/ma11040490.

Osteogenic Potential of Pre-Osteoblastic Cells on a Chitosan-graft-Polycaprolactone Copolymer

Affiliations

Osteogenic Potential of Pre-Osteoblastic Cells on a Chitosan-graft-Polycaprolactone Copolymer

Anthie Georgopoulou et al. Materials (Basel). .

Abstract

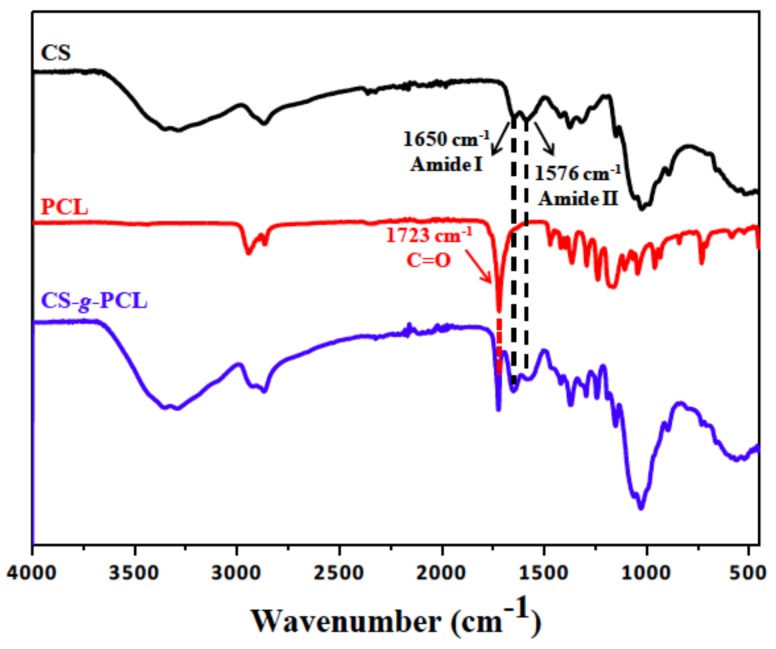
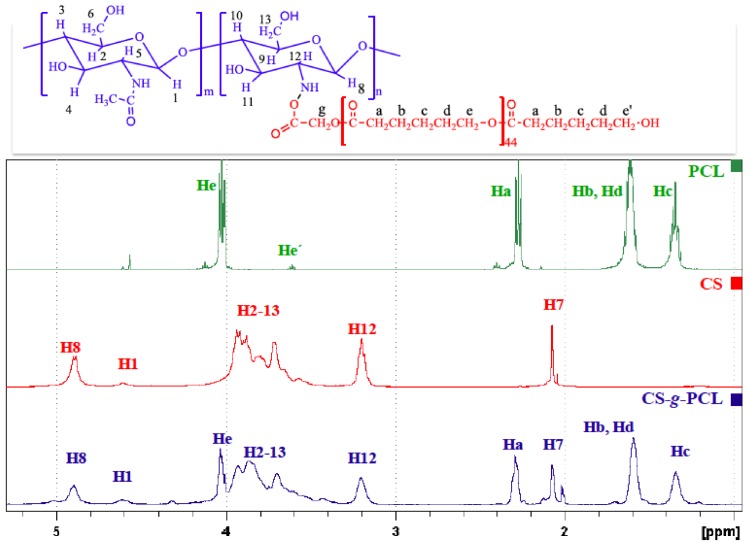
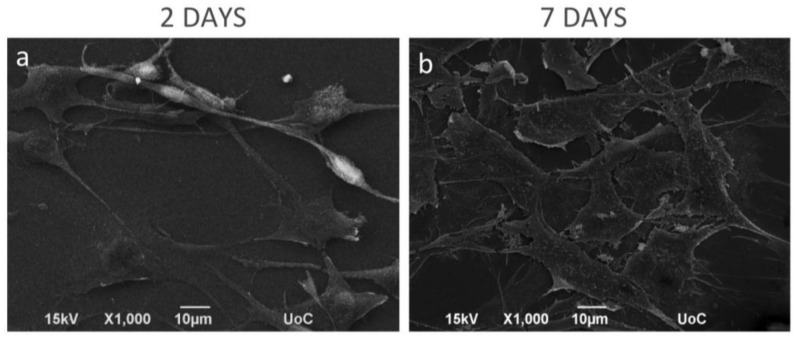
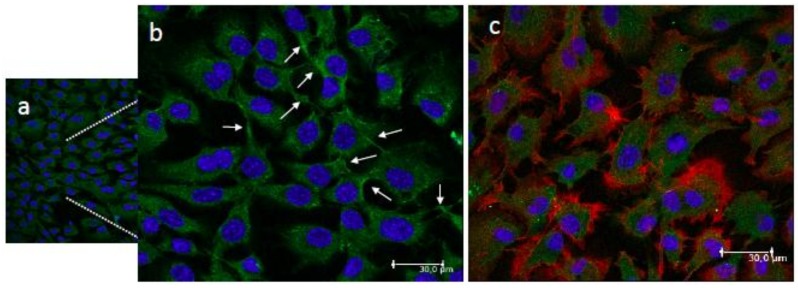
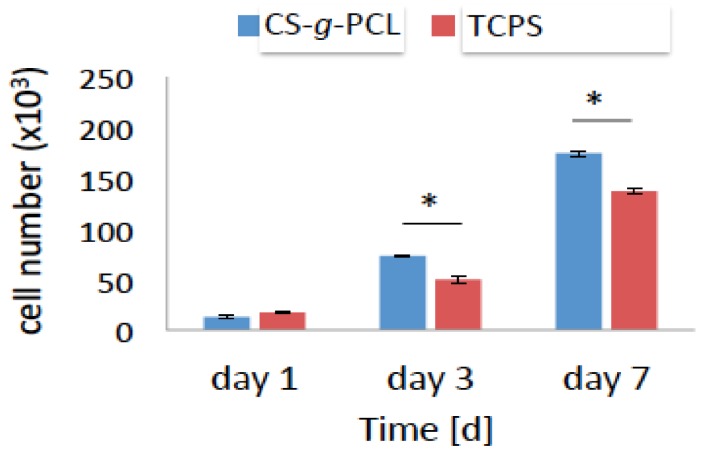
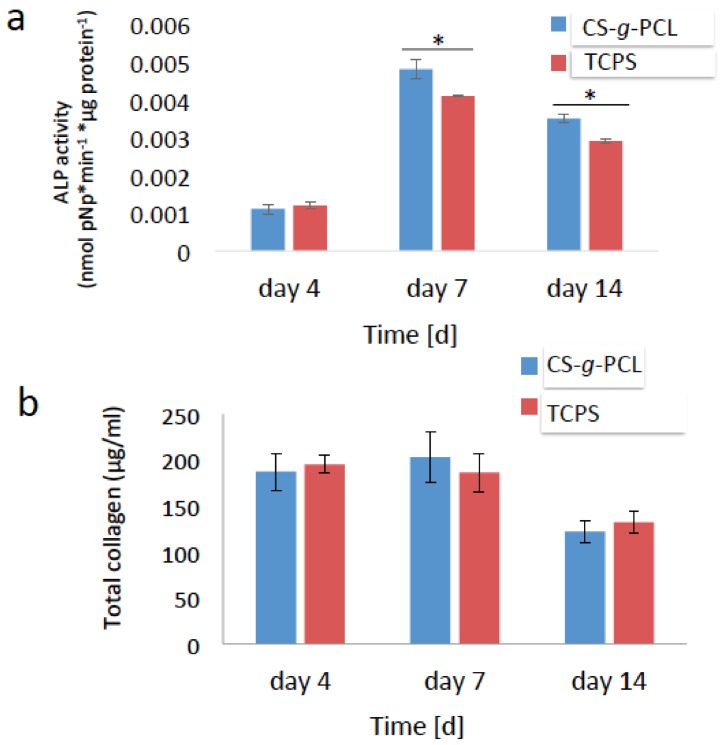
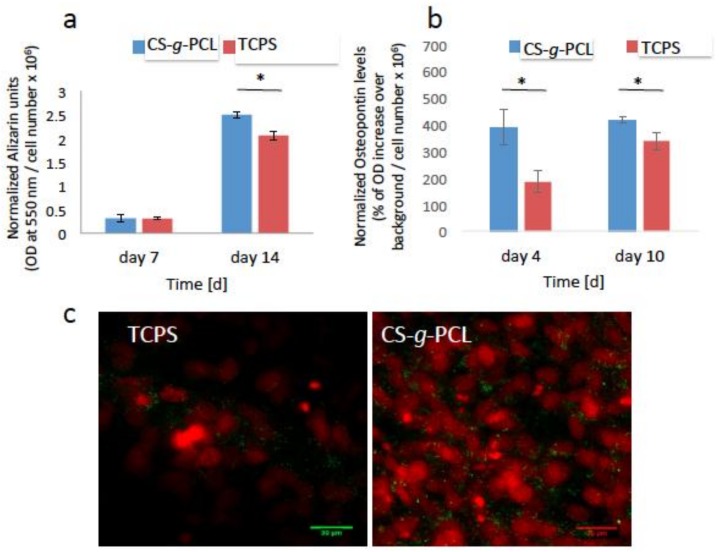
A chitosan-graft-polycaprolactone (CS-g-PCL) copolymer synthesized via a multi-step process was evaluated as a potential biomaterial for the adhesion and growth of MC3T3-E1 pre-osteoblastic cells. A strong adhesion of the MC3T3-E1 cells with a characteristic spindle-shaped morphology was observed from the first days of cell culture onto the copolymer surfaces. The viability and proliferation of the cells on the CS-g-PCL surfaces, after 3 and 7 days in culture, were significantly higher compared to the cells cultured on the tissue culture treated polystyrene (TCPS) control. The osteogenic potential of the pre-osteoblastic cells cultured on CS-g-PCL surfaces was evaluated by determining various osteogenic differentiation markers and was compared to the TCPS control surface. Specifically, alkaline phosphatase activity levels show significantly higher values at both time points compared to TCPS, while secreted collagen into the extracellular matrix was found to be higher on day 7. Calcium biomineralization deposited into the matrix is significantly higher for the CS-g-PCL copolymer after 14 days in culture, while the levels of intracellular osteopontin were significantly higher on the CS-g-PCL surfaces compared to TCPS. The enhanced osteogenic response of the MC3T3-E1 pre-osteoblasts cultured on CS-g-PCL reveals that the copolymer underpins the cell functions towards bone tissue formation and is thus an attractive candidate for use in bone tissue engineering.

Keywords: biomaterial; bone tissue engineering; chitosan; osteogenic potential; polycaprolactone; pre-osteoblastic cells.


Conflict of interest statement

The authors declare no conflict of interest.

Figures

Figure 1
Figure 1
Attenuated Total Reflection-Fourier transform infrared (ATR-FTIR) spectrum of chitosan (CS), polycaprolactone (PCL) and the synthesized graft copolymer CS-g-PCL.
Figure 2
Figure 2
1H NMR CS, PCL and the synthesized graft copolymer CS-g-PCL.
Figure 3
Figure 3
Scanning electron microscopy (SEM) images showing the morphology of MC3T3-E1 pre-osteoblastic cells on the CS-g-PCL surfaces, 2 and 7 days after seeding. SEM images illustrating MC3T3-E1 cell adhesion and growth on the copolymer surface: (a) After 2 days of seeding, a few cells were grown on the material surface, but they retain their elongated-fibroblastic morphology; (b) On day 7, cells have extensively proliferated forming a thick layer on the whole polymer surface. Original magnifications are 1000× and scale bars represent 10 μm.
Figure 4
Figure 4
Confocal fluorescence microscopy images showing the adhesion and morphology of MC3T3-E1 pre-osteoblastic cells on the CS-g-PCL surfaces 3 days after seeding ((a,b); (b) is a magnified area of (a)). Cytoskeletal organization of cells visualized via actin (red), vinculin (green) and nucleus (blue) staining. White arrows show the vinculin focal adhesion points (b). An overlay of the three staining is depicted in image (c). Cells strongly attach on the material surface and form cell-cell interactions, covering the whole surface area. Original magnifications are 20× in (a) and 40× in (b) and (c) with scale bars representing 30 μm.
Figure 5
Figure 5
Viability and proliferation assay showing the number of the MC3T3-E1 pre-osteoblastic cells cultured on the CS-g-PCL surface and on tissue culture treated polystyrene (TCPS) after 1, 3, 7 days in culture. Optical density values of viability are normalized to the cell number using a calibration curve. The number of cells cultured on the CS-g-PCL surfaces was similar to those on TCPS 1 day after seeding but after 3 and 7 days it was significantly higher for the cells cultured on the CS-g-PCL copolymer surface.
Figure 6
Figure 6
Early markers of osteogenesis: (a) Alkaline phosphatase (ALP) activity of the MC3T3-E1 cells cultured on the CS-g-PCL surface and TCPS for 4, 7 and 14 days. The ΑLP activity of the cells cultured on the CS-g-PCL was significantly increased compared to TCPS after 7 and 14 days; (b) Levels of collagen in the supernatants of the MC3T3-E1 cells cultured on the CS-g-PCL surface and on TCPS for 4, 7 and 14 days. The graft copolymer enhanced the production of collagen on day 7 compared to the control TCPS. Error bars represent the average of triplicates ± SEM of two independent experiments (n = 6).
Figure 7
Figure 7
Late markers of osteogenesis normalized by the cell number: (a) Calcium biomineralization by Alizarin Red S staining of the MC3T3-E1 cells cultured for 7 and 14 days on CS-g-PCL and TCPS. The matrix mineralization of the copolymer substrate was significantly increased compared to TCPS after 14 days of culture; (b) Measurement of the endogenous levels of osteopontin of the pre-osteoblastic cells cultured on the two material surfaces for 4 and 10 days. Osteopontin levels were significantly higher on the CS-g-PCL surfaces compared to TCPS after 4 and 10 days in culture; (c) Confocal microscopy images demonstrate the endogenous expression of osteopontin on the two material surfaces 10 days after seeding. Osteopontin is depicted in green around the red cell nuclei. The expression is higher for cells cultured on the CS-g-PCL surface compared to TCPS 10 days after seeding. Original magnifications are 40× and scale bars represent 30 μm. Error bars represent the average of triplicates ± SEM of two independent experiments (n = 6).

Similar articles

Cited by

References

    1. Marolt D., Knezevic M., Novakovic G.V. Bone tissue engineering with human stem cells. Stem Cell Res. Ther. 2010;1:10. doi: 10.1186/scrt10. - DOI - PMC - PubMed
    1. Drosse I., Volkmer E., Capanna R., de Biase P., Mutschler W., Schieker M. Tissue engineering for bone defect healing: An update on a multi-component approach. Injury. 2008;39(Suppl. 2):S9–S20. doi: 10.1016/S0020-1383(08)70011-1. - DOI - PubMed
    1. Amini A.R., Laurencin C.T., Nukavarapu S.P. Bone tissue engineering: Recent advances and challenges. Crit. Rev. Biomed. Eng. 2012;40:363–408. doi: 10.1615/CritRevBiomedEng.v40.i5.10. - DOI - PMC - PubMed
    1. Stevens M.M. Biomaterials for bone tissue engineering. Mater. Today. 2008;11:18–25. doi: 10.1016/S1369-7021(08)70086-5. - DOI
    1. He Y., Wang W., Tang X., Liu X. Osteogenic induction of bone marrow mesenchymal cells on electrospun polycaprolactone/chitosan nanofibrous membrane. Dent. Mater. J. 2017;36:325–332. doi: 10.4012/dmj.2016-203. - DOI - PubMed

LinkOut - more resources