

Knocking down Insulin Receptor in Pancreatic Beta Cell lines with Lentiviral-Small Hairpin RNA Reduces Glucose-Stimulated Insulin Secretion via Decreasing the Gene Expression of Insulin, GLUT2 and Pdx1
- PMID: 29587416
- PMCID: PMC5979368
- DOI: 10.3390/ijms19040985
Knocking down Insulin Receptor in Pancreatic Beta Cell lines with Lentiviral-Small Hairpin RNA Reduces Glucose-Stimulated Insulin Secretion via Decreasing the Gene Expression of Insulin, GLUT2 and Pdx1
Abstract
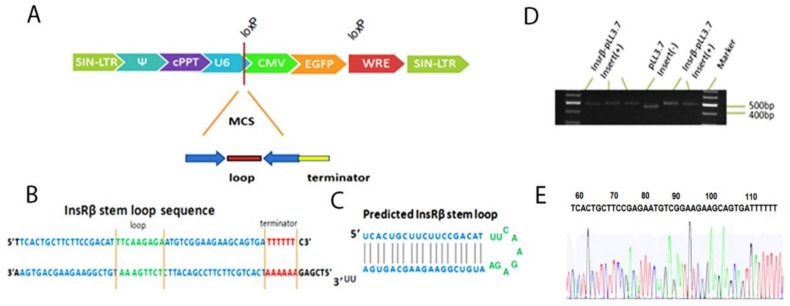
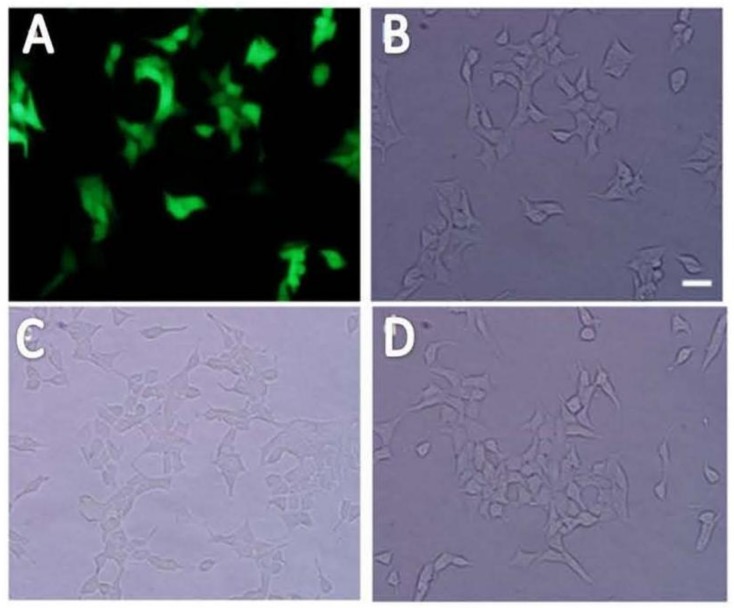
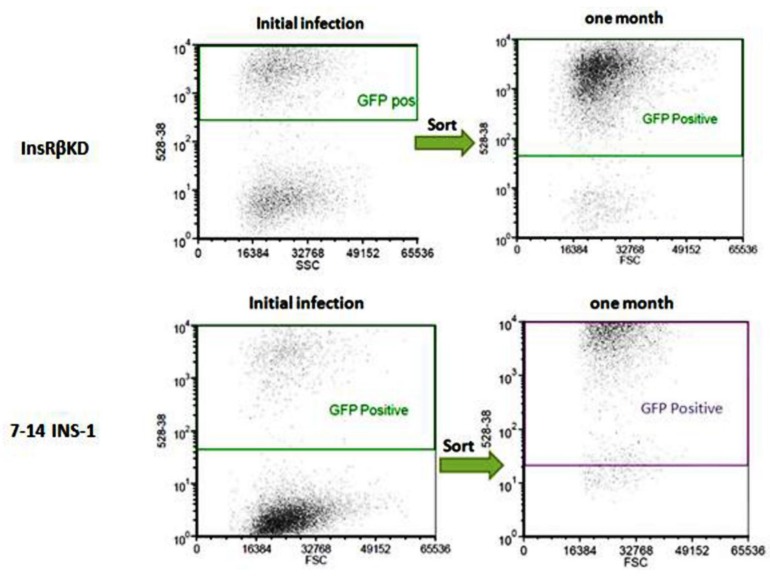
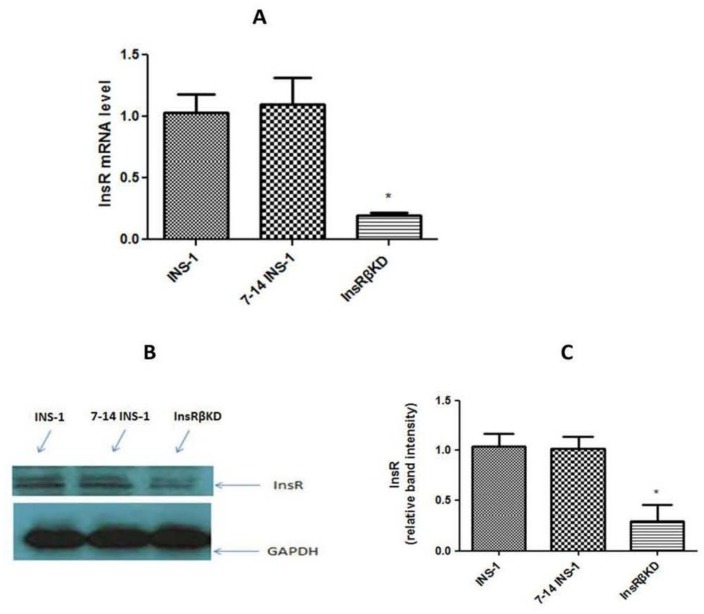
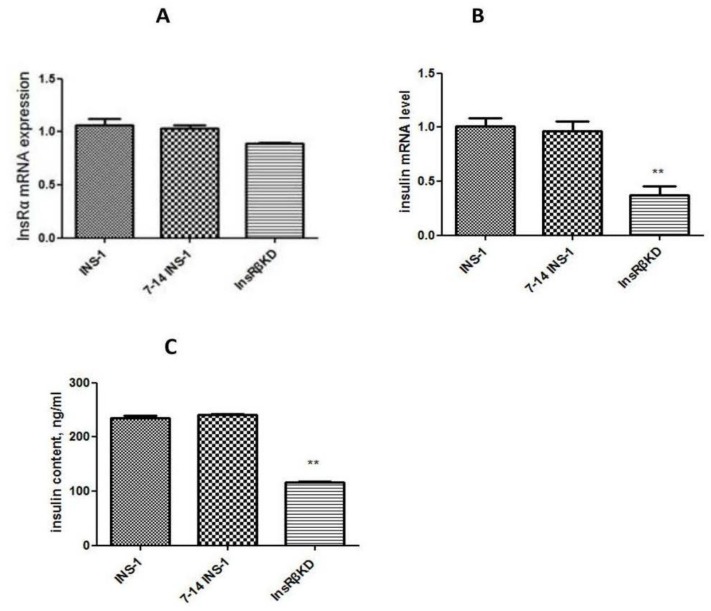
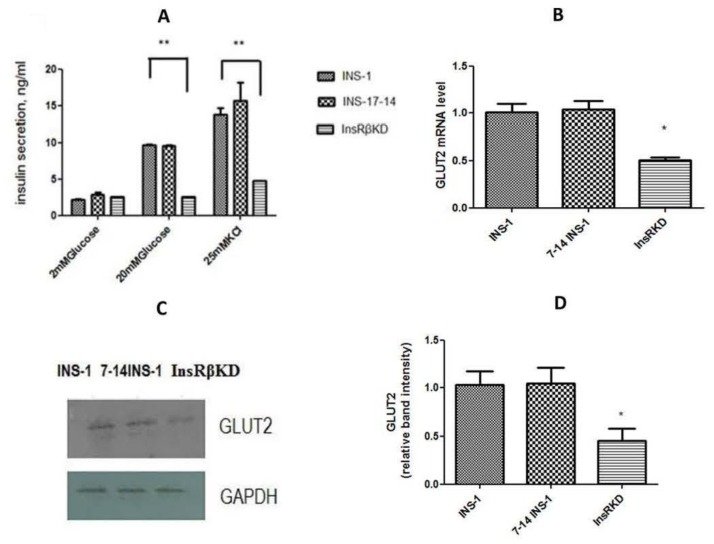
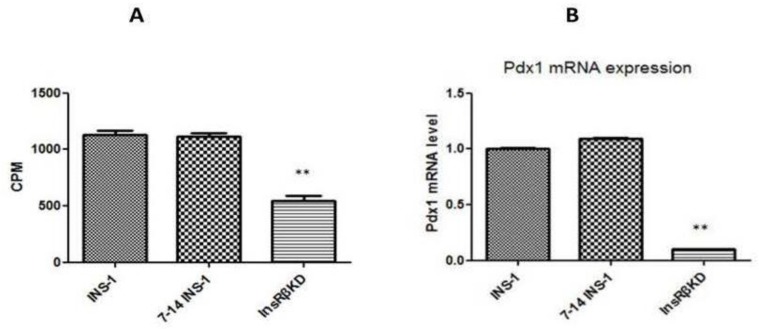
Type 2 diabetes (T2D) is a metabolic disorder characterized by beta cell dysfunction and insulin resistance in fat, muscle and liver cells. Recent studies have shown that the development of insulin resistance in pancreatic beta cell lines may contribute to beta cell dysfunction in T2D. However, there still is a lack of detailed investigations regarding the mechanisms by which insulin deficiency may contribute in diabetes. In this study, we firstly established a stable insulin receptor knockdown cell line in pancreatic beta cells INS-1 (InsRβKD cells) using anti InsRβ small hairpin RNA (InsRβ-shRNA) encoded by lentiviral vectors. The resultant InsRβKD cells demonstrated a significantly reduced expression of InsRβ as determined by real-time PCR and Western blotting analyses. Upon removing glucose from the medium, these cells exhibited a significant decrease in insulin gene expression and protein secretion in response to 20 mM glucose stimulation. In accordance with this insulin reduction, the glucose uptake efficiency as indicated by a ³[H]-2-deoxy-d-glucose assay also decreased. Furthermore, InsRβKD cells showed a dramatic decrease in glucose transporter 2 (GLUT2, encoded by SLC2A2) and pancreatic duodenal homeobox (Pdx1) mRNA expression compared to the controls. These data collectively suggest that pancreatic beta cell insulin resistance contributes to the development of beta cell dysfunction by impairing pancreatic beta cell glucose sensation through the Pdx1- GLUT2 pathway. InsRβKD cells provide a good model to further investigate the mechanism of β-cell dysfunction in T2D.
Keywords: RNA interference; Type 2 diabetes; glucose uptake; insulin receptor; insulin resistance; insulin secretion; pancreatic beta cell dysfunction; pancreatic beta cells; shRNA.
Conflict of interest statement
The authors declare no conflict of interest.
Figures
Similar articles
-
Suppression of free fatty acid receptor 1 expression in pancreatic β-cells in obese type 2 diabetic db/db mice: a potential role of pancreatic and duodenal homeobox factor 1.Endocr J. 2019 Jan 28;66(1):43-50. doi: 10.1507/endocrj.EJ18-0203. Epub 2018 Oct 17. Endocr J. 2019. PMID: 30333365
-
Adult rat liver cells transdifferentiated with lentiviral IPF1 vectors reverse diabetes in mice: an ex vivo gene therapy approach.Diabetologia. 2007 Jan;50(1):121-30. doi: 10.1007/s00125-006-0509-8. Epub 2006 Nov 28. Diabetologia. 2007. PMID: 17131142
-
Insulin secretion impairment in Sirt6 knockout pancreatic β cells is mediated by suppression of the FoxO1-Pdx1-Glut2 pathway.Sci Rep. 2016 Jul 26;6:30321. doi: 10.1038/srep30321. Sci Rep. 2016. PMID: 27457971 Free PMC article.
-
PDX1, Neurogenin-3, and MAFA: critical transcription regulators for beta cell development and regeneration.Stem Cell Res Ther. 2017 Nov 2;8(1):240. doi: 10.1186/s13287-017-0694-z. Stem Cell Res Ther. 2017. PMID: 29096722 Free PMC article. Review.
-
Metabolic and functional specialisations of the pancreatic beta cell: gene disallowance, mitochondrial metabolism and intercellular connectivity.Diabetologia. 2020 Oct;63(10):1990-1998. doi: 10.1007/s00125-020-05205-5. Epub 2020 Sep 7. Diabetologia. 2020. PMID: 32894309 Free PMC article. Review.
Cited by
-
Beta-cell specific Insr deletion promotes insulin hypersecretion and improves glucose tolerance prior to global insulin resistance.Nat Commun. 2022 Feb 8;13(1):735. doi: 10.1038/s41467-022-28039-8. Nat Commun. 2022. PMID: 35136059 Free PMC article.
-
Reduced Retinoic Acid Receptor Beta (Rarβ) Affects Pancreatic β-Cell Physiology.Biology (Basel). 2022 Jul 19;11(7):1072. doi: 10.3390/biology11071072. Biology (Basel). 2022. PMID: 36101450 Free PMC article.
-
GDF15 plays a critical role in insulin secretion in INS-1 cells and human pancreatic islets.Exp Biol Med (Maywood). 2023 Feb;248(4):339-349. doi: 10.1177/15353702221146552. Epub 2023 Feb 5. Exp Biol Med (Maywood). 2023. PMID: 36740767 Free PMC article.
-
Mechanistic Investigation of GHS-R Mediated Glucose-Stimulated Insulin Secretion in Pancreatic Islets.Biomolecules. 2022 Mar 6;12(3):407. doi: 10.3390/biom12030407. Biomolecules. 2022. PMID: 35327599 Free PMC article.
-
Expression Silencing of Mitogen-Activated Protein Kinase 8 Interacting Protein-1 Conferred Its Role in Pancreatic β-Cell Physiology and Insulin Secretion.Metabolites. 2023 Feb 20;13(2):307. doi: 10.3390/metabo13020307. Metabolites. 2023. PMID: 36837926 Free PMC article.
References
-
- World Health Organization . Fact Sheet No. 312. WHO; Geneva, Switzerland: 2012.
MeSH terms
Substances
LinkOut - more resources
Full Text Sources
Other Literature Sources
Medical
Research Materials
