. 2018 Mar 26;9(4):180.
doi: 10.3390/genes9040180.

Non-Pleiotropic Coupling of Daily and Seasonal Temporal Isolation in the European Corn Borer

Affiliations

Non-Pleiotropic Coupling of Daily and Seasonal Temporal Isolation in the European Corn Borer

Rebecca C Levy et al. Genes (Basel). .

Abstract

Speciation often involves the coupling of multiple isolating barriers to produce reproductive isolation, but how coupling is generated among different premating barriers is unknown. We measure the degree of coupling between the daily mating time and seasonal mating time between strains of European corn borer (Ostrinia nubilalis) and evaluate the hypothesis that the coupling of different forms of allochrony is due to a shared genetic architecture, involving genes with pleiotropic effects on both timing phenotypes. We measure differences in gene expression at peak mating times and compare these genes to previously identified candidates that are associated with changes in seasonal mating time between the corn borer strains. We find that the E strain, which mates earlier in the season, also mates 2.7 h earlier in the night than the Z strain. Earlier daily mating is correlated with the differences in expression of the circadian clock genes cycle, slimb, and vrille. However, different circadian clock genes associate with daily and seasonal timing, suggesting that the coupling of timing traits is maintained by natural selection rather than pleiotropy. Juvenile hormone gene expression was associated with both types of timing, suggesting that circadian genes activate common downstream modules that may impose constraint on future evolution of these traits.

Keywords: allochronic isolation; circadian clock; gene expression; sexual behavior; speciation.


Conflict of interest statement

The authors declare no conflict of interest.

Figures

Figure 1
Figure 1
Simplified pathway of the core Lepidopteran circadian clock. Arrows represent activation. Vertical lines represent inhibition. Gray lines indicate dimer formation. During the day, light activates the blue light photoreceptor CRYPTOCHROME1 (CRY1). CRY1 activation leads to SHAGGY (SGG) tagging TIMELESS (TIM) for degradation by JETLAG (JET). The PERIOD (PER) monomer is tagged for degradation by SLIMB when not bound to TIM. DOUBLETIME (DBT) regulates PER activity through phosphorylation. The PER/TIM heterodimer forms a complex with CRYPTOCHROME2 (CRY2) and enters the nucleus, where PER and CRY2 inhibit the activity of the CLOCK/CYCLE heterodimer. CLK/CYC binds to E-box enhancers to activate transcription. A second feedback loop is comprised of VRILLE (VRI) and PDP1, which bind to the V/P box of the clk promoter cyclically. VRI acts as repressor of clk transcription but PDP1 activates clk transcription. Modified from [29].
Figure 2
Figure 2
Schematic of specific contrasts tested in differential expression analysis. Within strain, comparisons were made between each pair of time points (photophase vs. 1.3 h of scotophase, photophase vs. 4 h of scotophase, and 1.3 vs. 4 h of scotophase). Between-strain, comparisons were made at each time point (BE vs. UZ). Numbers shown are total numbers of differentially expressed transcripts in each contrast.
Figure 3
Figure 3
Mating frequencies of the European corn borer E and Z pheromone strains during scotophase. Shown are the number of females mating for the first time during each hour of scotophase, for (a) historical field populations with unknown seasonal timing [45] from Aurora, NY (E) and London, Ontario (Z), and (b) contemporary colony populations: bivoltine E (Geneva, NY, first mating flight in May), univoltine Z (Bouckville, NY, first mating flight in July). Dashed vertical lines represent median mating times in contemporary populations (E = 1.3, Z = 4.0), and mean mating times for historical populations (E = 6.8, Z = 5.1). Contemporary populations show a significant difference in mean mating time between strains (p = 0.0038). When mating times are grouped into 1-h intervals, both of the strains showed significant differences between historical and contemporary mean mating times (E: historical = 7.33, contemporary = 2.81, p < 0.0001; Z: historical = 5.58, contemporary = 4.28, p = 0.014).
Figure 4
Figure 4
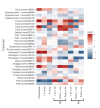
Heatmap of relative expression of genes in the circadian pathway and related photoreceptors in each contrast. Values are log FC. Photophase, 1.3 h, and 4 h contrasts are between strain with red indicating upregulation in BE (early daily and seasonal mating), and blue indicating upregulation in UZ (late daily and seasonal mating). For within strain/between time point contrasts the red color indicates upregulation at the first time point, and blue color indicates upregulation at the second time point. Log FC were capped to a minimum of −2 and a maximum of 2 for visualization purposes. Asterisks indicate genes that are significantly differentially expressed (q-value < 0.05) for a given contrast.
Figure 5
Figure 5
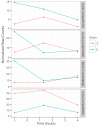
Trajectory of circadian transcript expression levels through time for transcripts that were significantly differentially expressed between strains. Each line represents a single component, with normalized counts at each time point averaged across libraries. Data collection time points were 1 h before scotophase, 1.3 h into scotophase, and 4 h into scotophase. Red indicates values for UZ, blue indicates BE.
Figure 6
Figure 6
Pairwise correlations among 22 transcripts for circadian genes. Only significant (p < 0.05) correlations shown. Blue indicates positive correlations, red indicates negative. Transcripts listed by gene symbol and comp number.

Similar articles

Cited by

References

    1. Coyne J.A., Orr H.A. Speciation. Volume 37 Sinauer Associates; Sunderland, MA, USA: 2004.
    1. Sobel J.M., Chen G.F., Watt L.R., Schemske D.W. The Biology of Speciation. Evolution. 2010;64:295–315. doi: 10.1111/j.1558-5646.2009.00877.x. - DOI - PubMed
    1. Butlin R.K., Smadja C.M. Coupling, Reinforcement, and Speciation. Am. Nat. 2017;191:155–172. doi: 10.1086/695136. - DOI - PubMed
    1. Dopman E.B., Robbins P.S., Seaman A. Components of reproductive isolation between North American pheromone strains of the European corn borer. Evolution. 2010;64:881–902. doi: 10.1111/j.1558-5646.2009.00883.x. - DOI - PMC - PubMed
    1. Ortiz-Barrientos D., Grealy A., Nosil P. The Genetics and Ecology of Reinforcement. Ann. N. Y. Acad. Sci. 2009;1168:156–182. doi: 10.1111/j.1749-6632.2009.04919.x. - DOI - PubMed

LinkOut - more resources