

Change in muscle volume after steroid therapy in patients with myositis assessed using cross-sectional computed tomography
- PMID: 29587702
- PMCID: PMC5872524
- DOI: 10.1186/s12891-018-2008-8
Change in muscle volume after steroid therapy in patients with myositis assessed using cross-sectional computed tomography
Abstract
Background: Steroid therapy, a key therapy for inflammatory, allergic, and immunological disorders, is often associated with steroid myopathy as one of the side effects. Steroid therapy is considered the first-line therapy for myositis; however, there have been no reports strictly comparing the muscle mass in patients with myositis before and after steroid therapy. Thus, it is currently unclear whether steroid therapy for such patients affects muscle volume in addition to muscle strength. We aimed to determine the change in muscle mass after steroid therapy via cross-sectional computed tomography (CT) in patients with myositis.
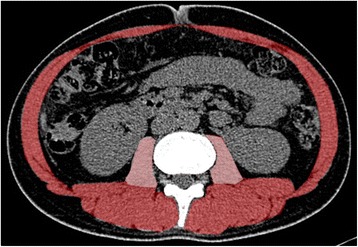
Methods: Data from seven patients with myositis and eight controls, who were all treated with high doses of steroids, were assessed before and after steroid therapy. Clinical factors in patients with myositis included serum muscle enzyme levels and muscular strength. The cross-sectional area of skeletal muscle and the low muscle attenuation rate at the level of the caudal end of the third lumbar vertebra were obtained using CT and measured using an image analysis program for all patients. Data were subjected to statistical analysis using several well-established statistical tests. The Wilcoxon signed-rank test was used for comparing paired data for each patient. The Mann-Whitney U test was used to compare sets of data sampled from two groups. The Spearman's rank correlation coefficient was used for determining the correlations between two variables. Statistical significance was set at p < 0.05.
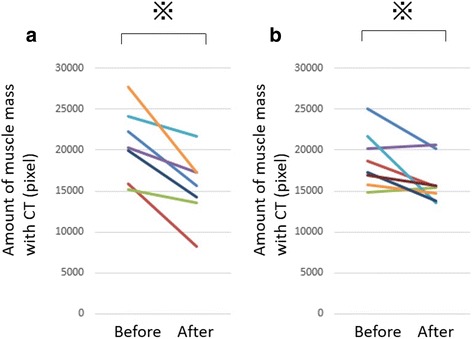
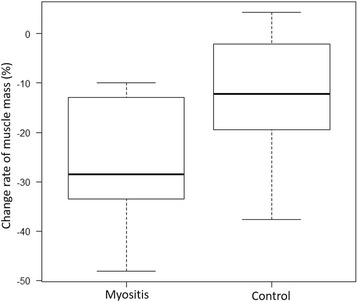
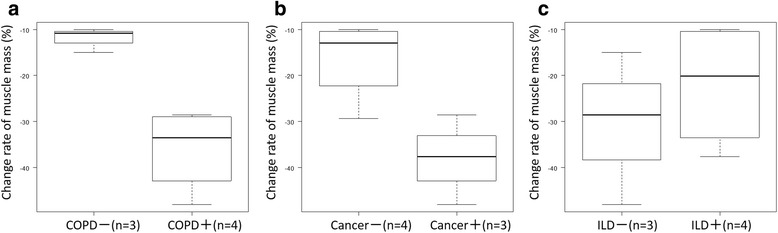
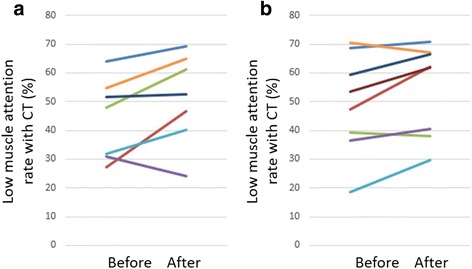
Results: Muscular strength and serum muscle enzyme levels improved following steroid therapy in patients with myositis. In both groups, the cross-sectional areas of skeletal muscles decreased (myositis group: p = 0.0156; control group: p = 0.0391) and the low muscle attenuation rate tended to increase (myositis group: p = 0.0781; control group: p = 0.0547). In the myositis group, patients with chronic obstructive pulmonary disease showed a tendency toward muscle volume loss (p = 0.0571).
Conclusion: In patients with myositis treated with steroid therapy, muscle mass decreased after steroid therapy suggesting that the improvement in muscle strength was due to factors other than a change in muscle volume. Our study suggests the importance of therapies that not only improve muscle mass but also improve the quality of muscle strength.
Keywords: Computed tomography; Cross section; Muscle mass; Myositis; Steroid.
Conflict of interest statement
Ethics approval and consent to participate
This retrospective study was approved by the Ethics Committee at Yamaguchi University Graduate School of Medicine in Ube, Japan. The need for informed consent was waived because of the study’s retrospective design.
Consent for publication
Not applicable.
Competing interests
The authors declare that they have no competing interests.
Publisher’s Note
Springer Nature remains neutral with regard to jurisdictional claims in published maps and institutional affiliations.
Figures
References
MeSH terms
Substances
LinkOut - more resources
Full Text Sources
Other Literature Sources
Medical
