. 2018 Mar 28;10(1):19.
doi: 10.1186/s13073-018-0527-4.

Elevated polygenic burden for autism is associated with differential DNA methylation at birth

Collaborators, Affiliations

Elevated polygenic burden for autism is associated with differential DNA methylation at birth

Eilis Hannon et al. Genome Med. .

Abstract

Background: Autism spectrum disorder (ASD) is a severe neurodevelopmental disorder characterized by deficits in social communication and restricted, repetitive behaviors, interests, or activities. The etiology of ASD involves both inherited and environmental risk factors, with epigenetic processes hypothesized as one mechanism by which both genetic and non-genetic variation influence gene regulation and pathogenesis. The aim of this study was to identify DNA methylation biomarkers of ASD detectable at birth.

Methods: We quantified neonatal methylomic variation in 1263 infants-of whom ~ 50% went on to subsequently develop ASD-using DNA isolated from archived blood spots taken shortly after birth. We used matched genotype data from the same individuals to examine the molecular consequences of ASD-associated genetic risk variants, identifying methylomic variation associated with elevated polygenic burden for ASD. In addition, we performed DNA methylation quantitative trait loci (mQTL) mapping to prioritize target genes from ASD GWAS findings.

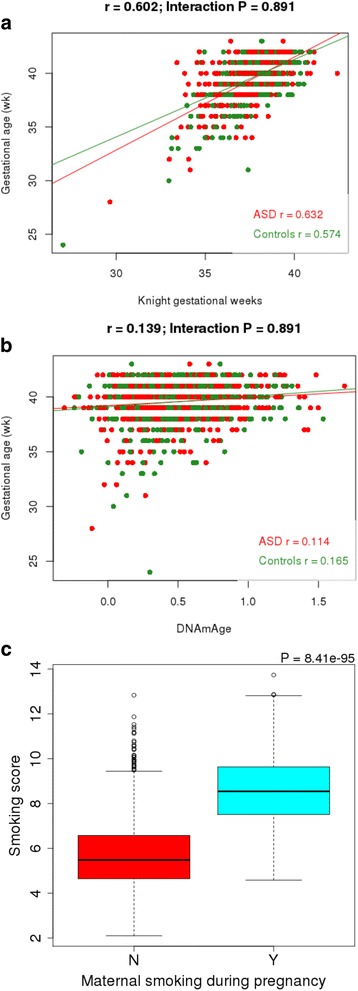
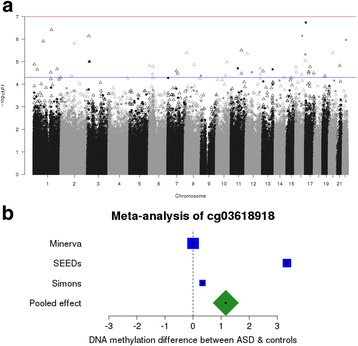
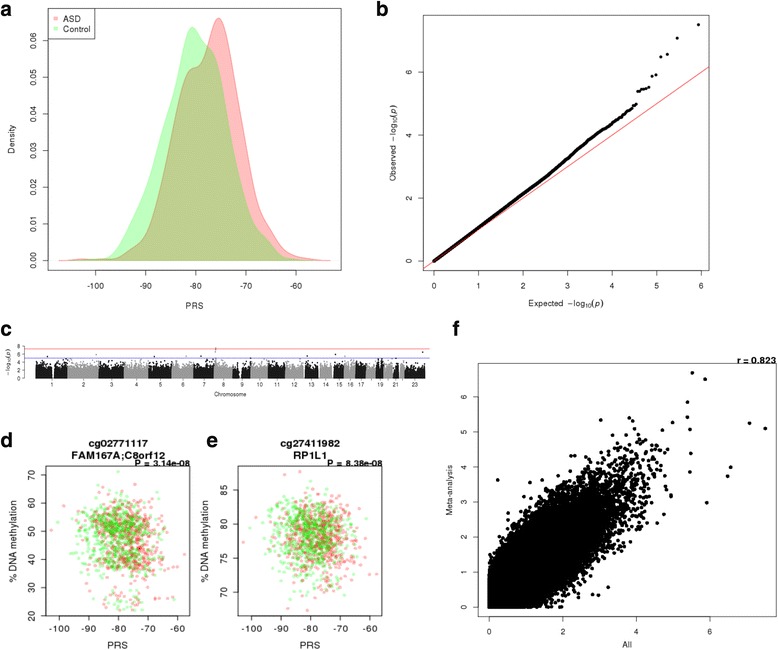
Results: We identified robust epigenetic signatures of gestational age and prenatal tobacco exposure, confirming the utility of DNA methylation data generated from neonatal blood spots. Although we did not identify specific loci showing robust differences in neonatal DNA methylation associated with later ASD, there was a significant association between increased polygenic burden for autism and methylomic variation at specific loci. Each unit of elevated ASD polygenic risk score was associated with a mean increase in DNA methylation of - 0.14% at two CpG sites located proximal to a robust GWAS signal for ASD on chromosome 8.

Conclusions: This study is the largest analysis of DNA methylation in ASD undertaken and the first to integrate genetic and epigenetic variation at birth. We demonstrate the utility of using a polygenic risk score to identify molecular variation associated with disease, and of using mQTL to refine the functional and regulatory variation associated with ASD risk variants.

Keywords: Autism; Birth; DNA methylation; DNA methylation quantitative trait loci (mQTL); Epigenome-wide association study (EWAS); Genetics; Genome-wide association study (GWAS); Neonatal; Polygenic risk score; Prenatal smoking.


Conflict of interest statement

Ethics approval and consent to participate

The MINERvA study has been approved by the Regional Scientific Ethics Committee in Denmark, the Danish Data Protection Agency and the NBS-Biobank Steering Committee. iPSYCH is a register-based cohort study solely using data from national health registries. The study was approved by the Scientific Ethics Committees of the Central Denmark Region (www.komite.rm.dk; J.nr. 1–10–72-287-12) and executed according to guidelines from the Danish Data Protection Agency (www.datatilsynet.dk; J.nr.: 2012–41-0110). Passive consent was obtained, in accordance with Danish Law nr. 593 of June 14, 2011, para 10, on the scientific ethics administration of projects within health research. Permission to use the dried blood spot samples stored in the Danish Neonatal Screening Biobank (DNSB) was granted by the steering committee of DNSB (SEP 2012/BNP). Research was conducted in accordance with the principles of the Declaration of Helsinki.

Consent for publication

Not applicable.

Competing interests

TW has acted as advisor and lecturer to H. Lundbeck A/S. The remaining authors declare that they have no competing interests.

Publisher’s Note

Springer Nature remains neutral with regard to jurisdictional claims in published maps and institutional affiliations.

Figures

Fig. 1
Fig. 1
DNA methylation data from neonatal blood spots can be used to accurately predict age and maternal smoking status. a Scatterplot of gestational age predicted from DNA methylation data (using an algorithm generated by Knight et al. [35]) against actual gestational age. Autism cases are in red and controls are in green. b Scatterplot of chronological age predicted from DNA methylation data (using the online Epigenetic Clock software [36]) against actual gestational age. Autism cases are in red and controls are in green. c Boxplot of a smoking score derived from DNA methylation data [23] stratified by maternal smoking status during pregnancy
Fig. 2
Fig. 2
A cross-cohort meta-analysis finds little evidence of autism-associated methylomic variation in neonatal and childhood blood samples. a Manhattan plot of P values from the autism EWAS meta-analysis (total n = 2917). P values were calculated using Fisher’s method for combining P values; solid circles indicate sites where the direction of effect was consistent across all contributing cohorts, empty triangles indicate where there were different directions of effect in at least two studies. The red horizontal line indicates experiment-wide significance (P < 1 × 10⁻⁷). The blue horizontal line indicates a more relaxed "discovery" threshold (P < 1 × 10−5). b Forest plot of cg03618918, the most significant DNA methylation sites associated with ASD in the meta-analysis. The effect is the mean difference in DNA methylation between autism cases and controls. The sizes of the boxes are proportional to the sample size of that cohort
Fig. 3
Fig. 3
Polygenic burden for autism is associated with significant variation in DNA methylation at birth. a Density plot of polygenic risk score (PRS; pT = 0.01) split by ASD case control status. b Q-Q plots of the ASD PRS (pT = 0.01) EWAS analysis in neonatal blood DNA. c Manhattan plot of the ASD PRS (pT = 0.01) EWAS analysis in neonatal blood DNA. The red horizontal line indicates experiment-wide significance (P < 1 × 10⁻⁷); blue horizontal line indicates a “discovery” significance threshold (P < 5 × 10⁻⁵). Scatterplots of experiment-wide significant CpG sites where DNA methylation (y-axis) at d cg02771117 and e cg27411982 is correlated with ASD PRS (x-axis). Red points indicate ASD cases, green points indicate controls. f Scatterplots of –log10 P value from the EWAS of ASD PRS comparing the results from an analysis performed in all individuals (x-axis) against the results from an analysis performed separately for cases and controls and then combined with a meta-analysis (y-axis)
Fig. 4
Fig. 4
DNA methylation quantitative trait loci (mQTL) mapping can localize putative causal loci associated with ASD. Presented here is a genomic region (chr8:10268916–10,918,152) identified in a recent GWAS analysis of ASD [13]. At the top of the figure is a schematic detailing the genes located in this region which are identified by their Entrez ID number. All genetic variants identified in the ASD GWAS (P < 1 × 10⁻⁴) are represented by vertical solid lines where the color reflects the strength of the association ranging from gray (less significant P values) to black (more significant P values). A red vertical line indicates the most significant genetic variant in this region. All DNA methylation sites tested for neonatal blood mQTL in the MINERvA dataset are indicated by red vertical lines and genetic variants by blue vertical lines. Significant neonatal blood mQTLs (P < 1 × 10⁻¹³) are indicated by black diagonal lines between the respective genetic variant and DNA methylation site. Genomic locations are based on hg19. Additional examples of mQTLs in genomic regions showing genome-wide significant association with ASD are given in Additional file 1: Figure S22

References

    1. American Psychiatric Association. Diagnostic and statistical manual of mental disorders. 4th ed. Washington, DC: The American Psychiatric Association; 2000.
    1. Baron-Cohen S, Scott FJ, Allison C, Williams J, Bolton P, Matthews FE, Brayne C. Prevalence of autism-spectrum conditions: UK school-based population study. Br J Psychiatry. 2009;194:500–509. doi: 10.1192/bjp.bp.108.059345. - DOI - PubMed
    1. Investigators ADDMNSYP, CfDCa P. Prevalence of autism spectrum disorders--Autism and Developmental Disabilities Monitoring Network, 14 sites, United States, 2008. MMWR Surveill Summ. 2012;61:1–19. - PubMed
    1. Christensen DL, Baio J, Van Naarden BK, Bilder D, Charles J, Constantino JN, Daniels J, Durkin MS, Fitzgerald RT, Kurzius-Spencer M, et al. Prevalence and characteristics of autism spectrum disorder among children aged 8 years--Autism and Developmental Disabilities Monitoring Network, 11 Sites, United States, 2012. MMWR Surveill Summ. 2016;65:1–23. doi: 10.15585/mmwr.ss6503a1. - DOI - PMC - PubMed
    1. Robinson EB, St Pourcain B, Anttila V, Kosmicki JA, Bulik-Sullivan B, Grove J, Maller J, Samocha KE, Sanders SJ, Ripke S, et al. Genetic risk for autism spectrum disorders and neuropsychiatric variation in the general population. Nat Genet. 2016;48:552–555. doi: 10.1038/ng.3529. - DOI - PMC - PubMed

Publication types