. 2018 Apr;57(4):252-262.e4.
doi: 10.1016/j.jaac.2018.01.014. Epub 2018 Feb 8.

Data-Driven Subtyping of Executive Function-Related Behavioral Problems in Children

Collaborators, Affiliations

Data-Driven Subtyping of Executive Function-Related Behavioral Problems in Children

Joe Bathelt et al. J Am Acad Child Adolesc Psychiatry. 2018 Apr.

Abstract

Objective: Executive functions (EF) are cognitive skills that are important for regulating behavior and for achieving goals. Executive function deficits are common in children who struggle in school and are associated with multiple neurodevelopmental disorders. However, there is also considerable heterogeneity across children, even within diagnostic categories. This study took a data-driven approach to identify distinct clusters of children with common profiles of EF-related difficulties, and then identified patterns of brain organization that distinguish these data-driven groups.

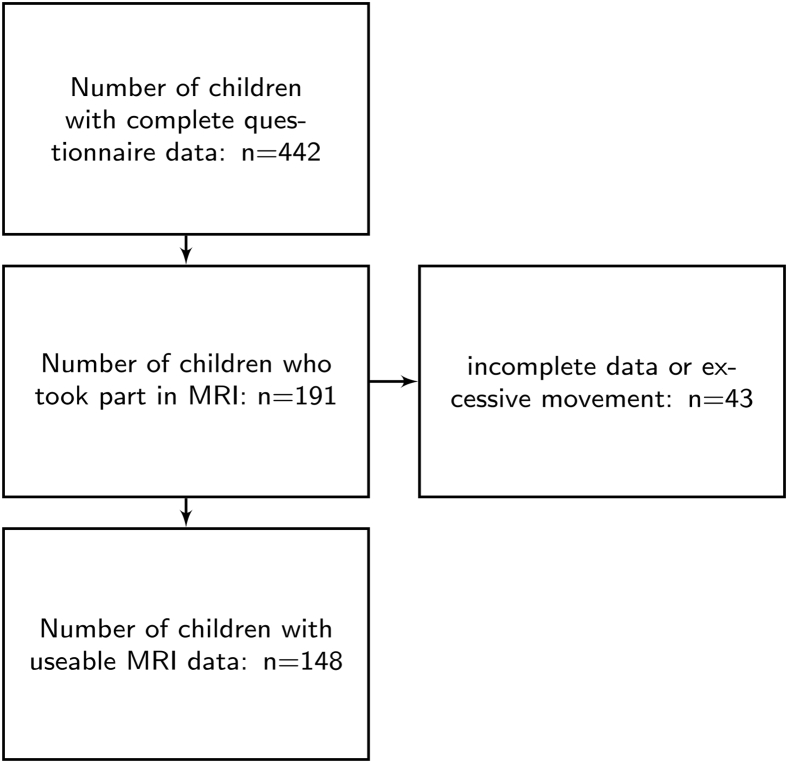
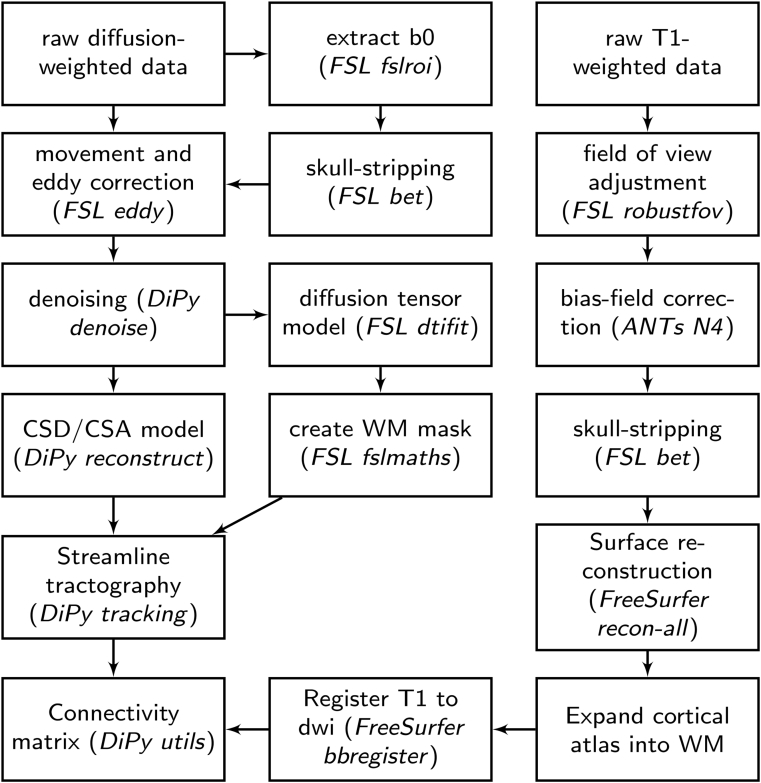
Method: The sample consisted of 442 children identified by health and educational professionals as having difficulties in attention, learning, and/or memory. We applied community clustering, a data-driven clustering algorithm, to group children by similarities on a commonly used rating scale of EF-associated behavioral difficulties, the Conners 3 questionnaire. We then investigated whether the groups identified by the algorithm could be distinguished on white matter connectivity using a structural connectomics approach combined with partial least squares analysis.

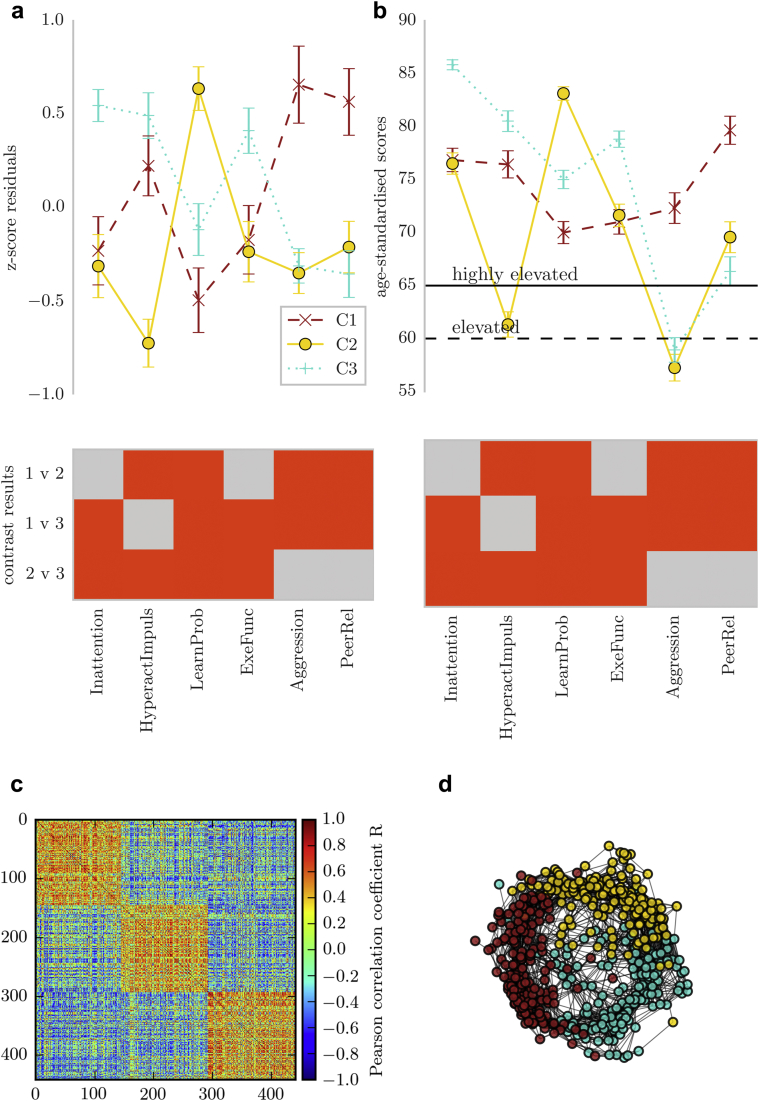
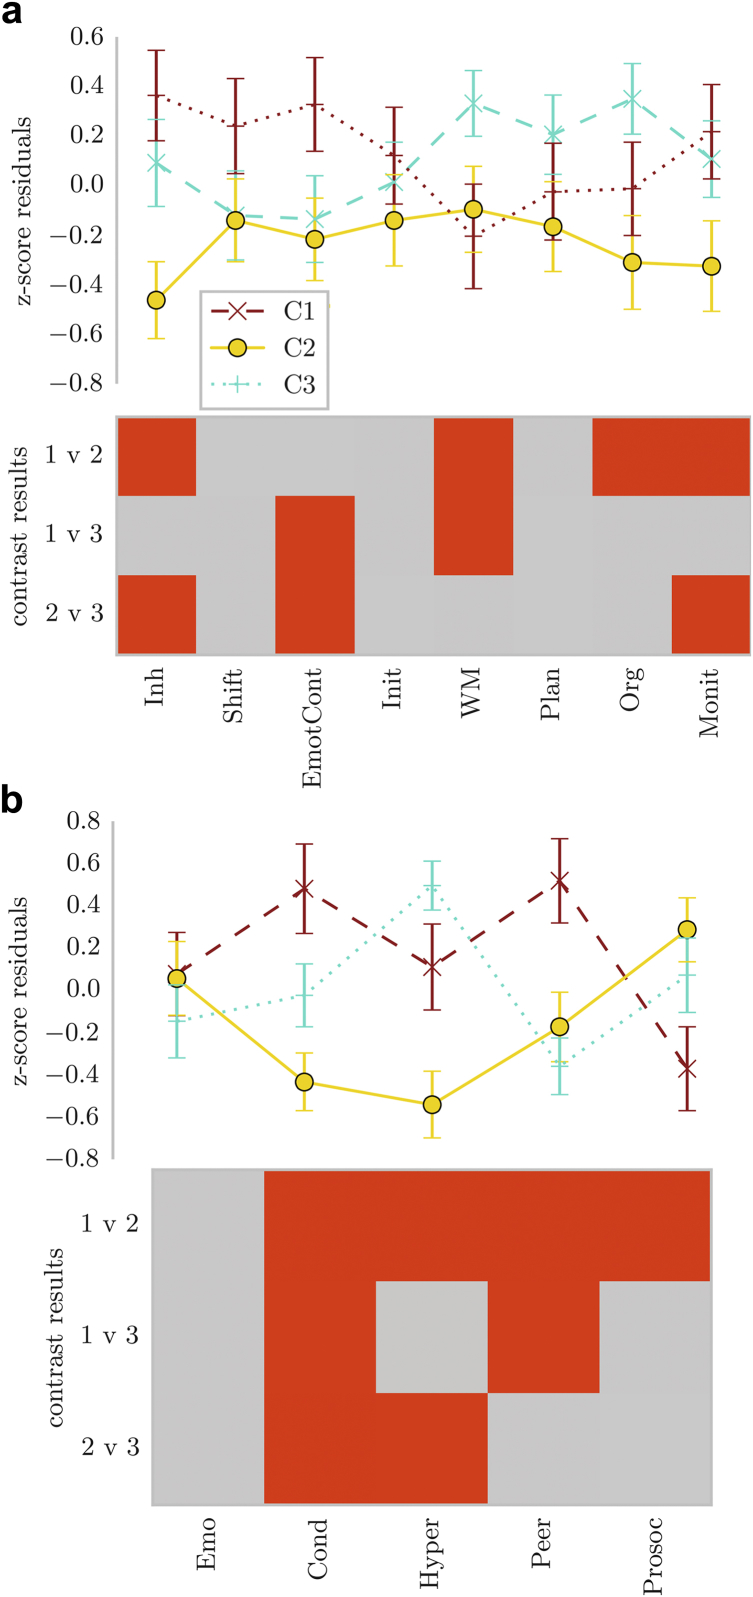
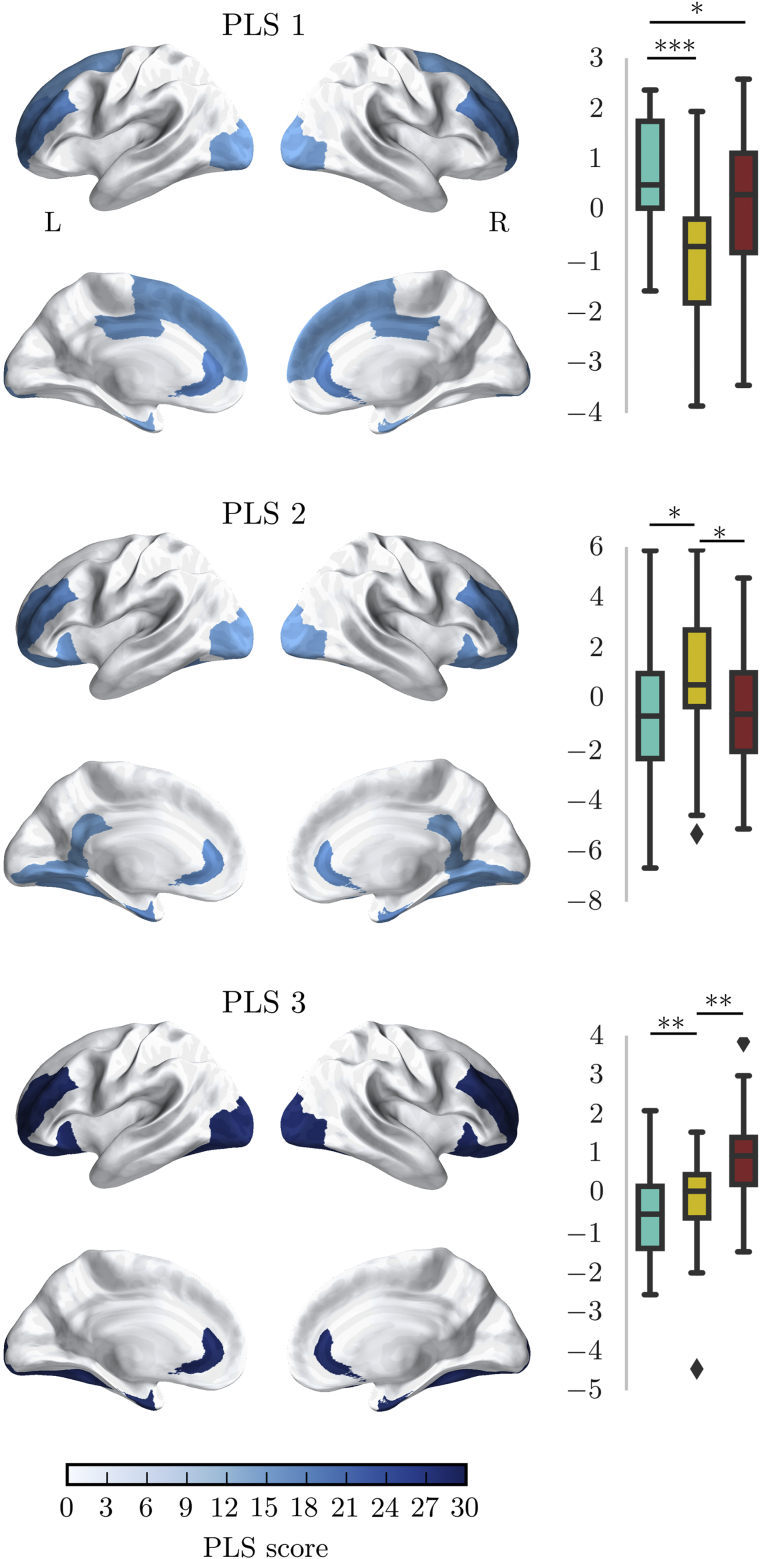
Results: The data-driven clustering yielded 3 distinct groups of children with symptoms of one of the following: (1) elevated inattention and hyperactivity/impulsivity, and poor EF; (2) learning problems; or (3) aggressive behavior and problems with peer relationships. These groups were associated with significant interindividual variation in white matter connectivity of the prefrontal and anterior cingulate cortices.

Conclusion: In sum, data-driven classification of EF-related behavioral difficulties identified stable groups of children, provided a good account of interindividual differences, and aligned closely with underlying neurobiological substrates.

Keywords: childhood; executive function; nosology; structural imaging.


Figures

Figure 1
Figure 1
Overview of Data Included in Behavioral and Connectome Analysis Note:MRI = magnetic resonance imaging.
Figure 2
Figure 2
Overview of Processing Steps for Structural Connectome Estimation Note:ANTs = Advanced Normalization Tools; DiPy = Diffusion Imaging in Python; FSL = FMRIB Software Library; WM = working memory. Other abbreviations are names of functions in the software packages mentioned.
Figure 3
Figure 3
Overview of Community Clusters and Their Behavioral Profiles Note:(a) Profile of ratings on the Conners 3 questionnaire in the 3 clusters indicated by the community detection algorithm. The top of the figure shows the mean of scores in each group with 2 standard errors. The scores represent residuals after regressing the effect of age. The bottom figure shows the results of groupwise contrasts on each scale. Red indicates a significant difference between groups after Bonferroni correction. (b) Comparison of the groups on scores standardized with reference to the normative data of the Conners 3 questionnaire. (c) Child-by-child correlation matrix of Conners 3 scores after ordering the matrix according to the cluster assignment indicated by community clustering. The order matrix shows a clear separation between the clusters. (d) Correlation matrix in a spring layout color-coded according to the cluster assignment indicated by community clustering. The spring layout representation shows clear spatial separation between the clusters. C1 = cluster 1 (inattention, hyperactivity/impulsivity/executive function); C2 = cluster 2 (learning problems); C3 = cluster 3 (aggression, peer relations).
Figure 4
Figure 4
Profile of Ratings for Children in the Clusters Defined by Community Module Assignment on (a) a Questionnaire on Executive Function Difficulties (BRIEF) and (b) a Questionnaire on Strengths and Difficulties (SDQ) Note:The lines indicate the mean of each group across the questionnaire scales, with error bars showing 2 standard errors around the mean. The bottom of each figure shows the binary outcome of t tests comparing the groups. Red indicates a significant result (pcorrected<.05). after Bonferroni correction. Note that higher scores indicate a higher level of difficulties on each scale, apart from the Prosocial Behavior (Prosoc) scale, where high scores indicate more prosocial behavior. C1 = cluster 1 (inattention, hyperactivity/impulsivity/executive function); C2 = cluster 2 (learning problems); C3 = cluster 3 (aggression, peer relations); Cond = Conduct Problems; Emo = Emotional Problems; EmotCont = Emotional Control; Hyper = Hyperactivity; Inh = Inhibition; Init = Initiate; Monit = Monitoring; Org = Organization of Materials; Peer = Peer Problems; Prosoc = Prosocial Behavior WM = Working Memory.
Figure 5
Figure 5
Relationship Between the Node Degree of Brain Regions in the Structural Connectome and Clusters Based on Conners 3 Responses Note:The brain maps show the score of partial least squares (PLS) components for brain regions that most strongly distinguished the group (top 25%). PLS scores above 2 are considered to be significantly predictive. The graphs show the statistical comparison of groups on loadings for each component. *p < 0.05; **p < 0.01; ***p < 0.001. C1 = cluster 1 (inattention, hyperactivity/impulsivity/executive function); C2 = cluster 2 (learning problems); C3 = cluster 3 (aggression, peer relations).
Figure S1
Figure S1
(A) Community-Grouped Adjacency Matrix Based on the Community Clustering Algorithm Used in the Main Analysis. (B) Community-Grouped Adjacency Matrix Based on the Kernighan−Lin Algorithm
Figure S2
Figure S2
Results of Robustness Testing Note:(a) Quality indices of consensus clustering using simulated networks with varying levels of within (pin) and between (pout) connections probabilities. High within-cluster and low between-cluster connectivity led to high separation of clusters with consensus clustering, that is, high quality indices. (b) Consensus clustering using the empirical child-by-child network of Conners 3 correlations with varying levels of added noise. The 3-cluster solution could be reconstructed up to 30% of added Gaussian noise. At a higher level of noise, no clustering solution could be obtained.
Figure S3
Figure S3
Principal Component Analysis (PCA) of the Conners 3 Scales Note:The left panel shows the correlation matrix. The tables show the factor loadings and explained variance (prop. = proportional; cumul. = cumulative). The right figure shows the eigenvalues of each component (scree plot).

Comment in

Similar articles

Cited by

References

    1. Anderson P. Assessment and development of executive function (EF) during childhood. Child Neuropsychol. 2002;8:71–82. - PubMed
    1. Diamond A. Executive functions. Annu Rev Psychol. 2013;64:135–168. - PMC - PubMed
    1. Duncan G.J., Dowsett C.J., Claessens A. School readiness and later achievement. Dev Psychol. 2007;43:1428–1446. - PubMed
    1. St Clair-Thompson H.L., Gathercole S.E. Executive functions and achievements in school: Shifting, updating, inhibition, and working memory. Q J Exp Psychol (Hove) 2006;59:745–759. - PubMed
    1. Miller H.V., Barnes J.C., Beaver K.M. Self-control and health outcomes in a nationally representative sample. Am J Health Behav. 2011;35:15–27. - PubMed

Supplementary References

    1. Rubinov M., Sporns O. Weight-conserving characterization of complex functional brain networks—Google search. NeuroImage. 2011;56:2068–2079. - PubMed
    1. Bathelt J., Barnes J., Raymond F.L., Baker K., Astle D. Global and local connectivity differences converge with gene expression in a neurodevelopmental disorder of known genetic origin. Cereb Cortex. 2017;27:1–12. - PMC - PubMed
    1. Coupe P., Yger P., Prima S., Hellier P., Kervrann C., Barillot C. An optimized blockwise nonlocal means denoising filter for 3-D magnetic resonance images. IEEE Trans Med Imaging. 2008;27:425–441. - PMC - PubMed
    1. Garyfallidis E., Brett M., Amirbekian B. Dipy: a library for the analysis of diffusion MRI data. Front Neuroinform. 2014;8:554. - PMC - PubMed
    1. Behrens T.E.J., Woolrich M.W., Jenkinson M. Characterization and propagation of uncertainty in diffusion-weighted MR imaging. Magn Reson Med. 2003;50:1077–1088. - PubMed

Publication types

MeSH terms