. 2018 May 24;131(21):e1-e11.
doi: 10.1182/blood-2017-12-821413. Epub 2018 Mar 27.

A single-cell hematopoietic landscape resolves 8 lineage trajectories and defects in Kit mutant mice

Affiliations

A single-cell hematopoietic landscape resolves 8 lineage trajectories and defects in Kit mutant mice

Joakim S Dahlin et al. Blood. .

Abstract

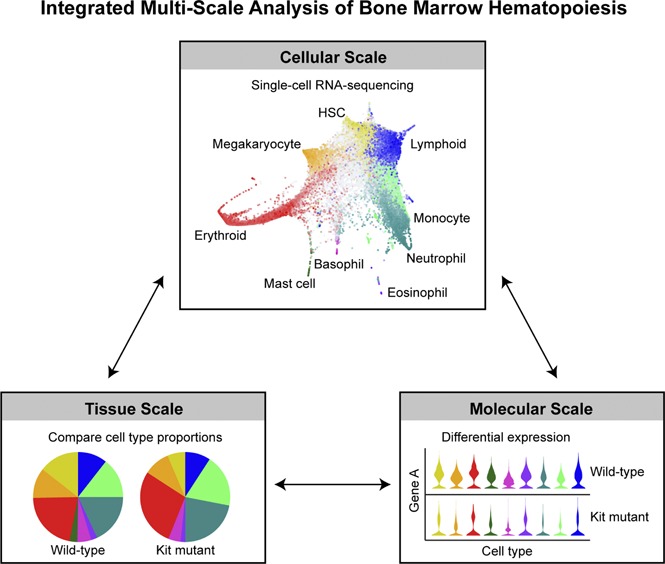
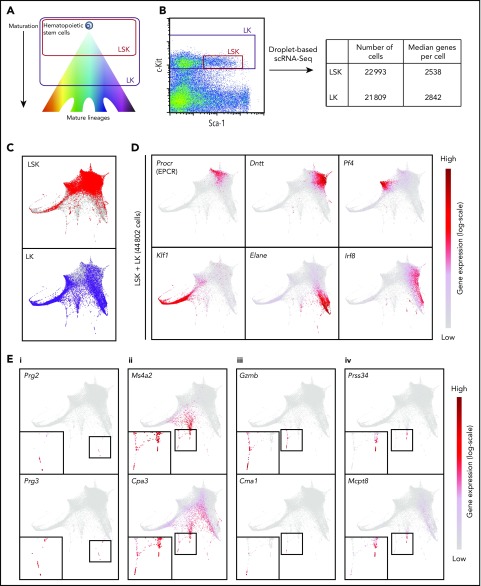
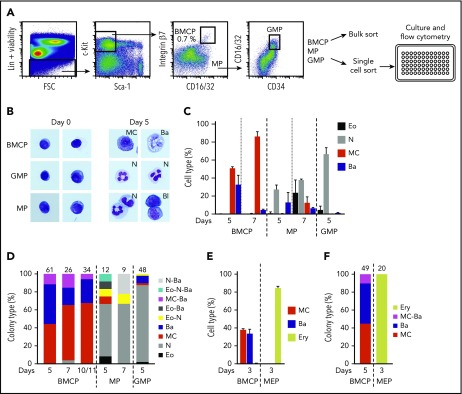
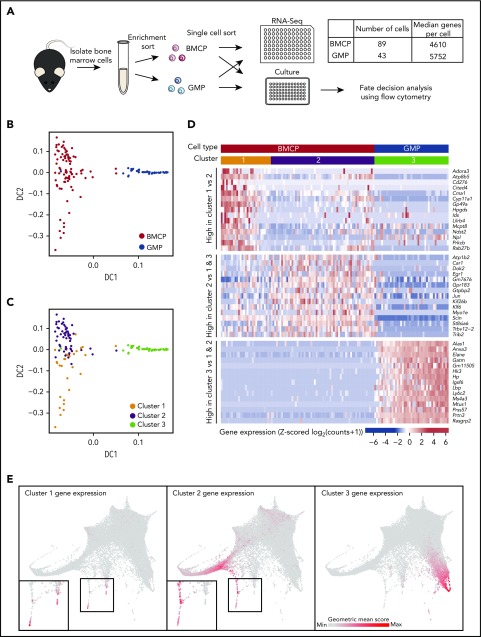
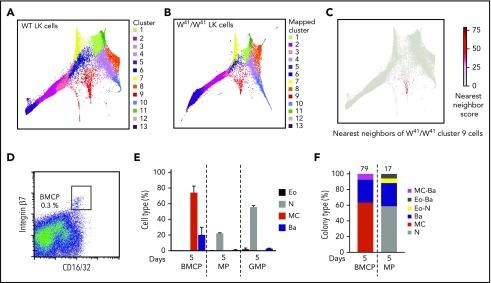
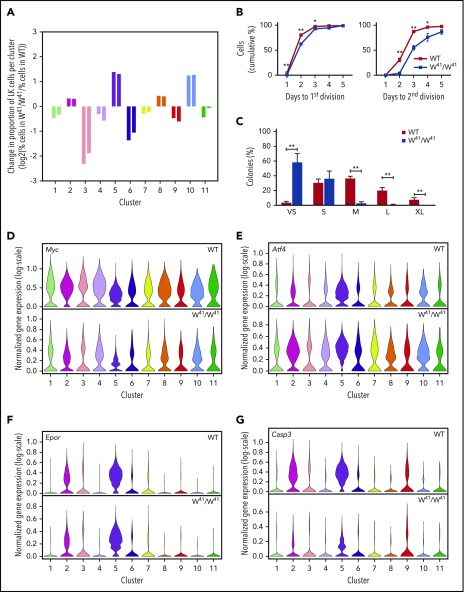
Hematopoietic stem and progenitor cells (HSPCs) maintain the adult blood system, and their dysregulation causes a multitude of diseases. However, the differentiation journeys toward specific hematopoietic lineages remain ill defined, and system-wide disease interpretation remains challenging. Here, we have profiled 44 802 mouse bone marrow HSPCs using single-cell RNA sequencing to provide a comprehensive transcriptional landscape with entry points to 8 different blood lineages (lymphoid, megakaryocyte, erythroid, neutrophil, monocyte, eosinophil, mast cell, and basophil progenitors). We identified a common basophil/mast cell bone marrow progenitor and characterized its molecular profile at the single-cell level. Transcriptional profiling of 13 815 HSPCs from the c-Kit mutant (W41/W41) mouse model revealed the absence of a distinct mast cell lineage entry point, together with global shifts in cell type abundance. Proliferative defects were accompanied by reduced Myc expression. Potential compensatory processes included upregulation of the integrated stress response pathway and downregulation of proapoptotic gene expression in erythroid progenitors, thus providing a template of how large-scale single-cell transcriptomic studies can bridge between molecular phenotypes and quantitative population changes.


Conflict of interest statement

Conflict-of-interest disclosure: The authors declare no competing financial interests.

Figures

None
Graphical abstract
Figure 1.
Figure 1.
Transcriptional profiling of 44 802 single hematopoietic stem and progenitor cells reveals a differentiation landscape with 8 lineage entry points. (A) Diagram indicating relative maturity of cells captured in LSK and LK sorting gates. (B) Sorting gate used to isolate LSK and LK cells based on c-Kit and Sca-1 surface expression for droplet-based scRNA-seq. Table indicates numbers of cells that passed quality control and median number of genes detected in scRNA-seq samples. (C) Force-directed graph embedding of scRNA-seq data on LSK and LK cells. Individual cells are connected to their 7 nearest neighbors based on similarities in their transcriptional profiles, and the resulting nearest-neighbor graph is used to calculate 2-dimensional coordinates. Top panel shows LSK cells highlighted in red, with LK cells in gray in the background. Similarly, the bottom panel highlights LK cells in purple, with LSK cells in gray behind. (D) Expression of marker genes plotted on the force-directed graph embedding. Gene expression is plotted on a log(normalized count + 1) scale, with gray equal to no counts and dark red representing the maximum value detected. (E) Expression of marker genes plotted on the force-directed graph embedding using a log(normalized count + 1) scale, with gray equal to no counts and dark red representing the maximum value detected. Insets in the bottom left of each panel display magnified branch of interest. Panels display genes relating to (i) eosinophil, (ii) mast cell and basophil, (iii) mast cell, and (iv) basophil lineages, respectively. Bone marrow cells were harvested simultaneously and pooled from 6 mice.
Figure 2.
Figure 2.
LinSca-1c-Kit+integrin β7hiCD16/32hibone marrow cells constitute bipotent mast cell/basophil progenitors. Bone marrow cells from WT mice were analyzed by flow cytometry and bipotent BMCPs, MPs, and GMPs were sorted and cultured in myeloid promoting-conditions or in erythroid-promoting conditions. (A) The gating strategy of primary BMCPs, MPs, and GMPs and the experimental setup are shown. The frequency of BMCPs is indicated as percentage of LinSca-1c-Kit+ cells. (B) Sorted cells were cultured in myeloid-promoting conditions for 5 days and stained with May-Grünwald Giemsa. Photo width, 33 μm. Images were captured using the Axio Imager.Z2, Axiocam 506, and Zen software (Zeiss). (C) BMCPs, MPs, and GMPs were cultured in bulk with myeloid-promoting cytokines and analyzed by flow cytometry. Supplemental Figure 4B shows the gating strategy. Day 7 cells were analyzed without the CD49b antibody. (D) Colonies derived from single BMCPs, MPs, and GMPs cultured in myeloid-promoting conditions were analyzed with flow cytometry. Supplemental Figure 4E shows the gating strategy. (E-F) BMCPs and MEPs were sorted and cultured in erythroid-promoting conditions. The cultured cells were analyzed by flow cytometry. Bulk cultures (E) and single-cell cultures (F) are shown. Supplemental Figure 5B shows the gating strategy. Panels C and D show data pooled from 2 experiments per time point from 4 independent sorts. Panels E and F show data pooled from 2 independent experiments. The number of single-cell colonies in which the cell types were determined is indicated above each bar. Supplemental Figures 4F-H and 5C-D show the colony sizes. Bulk indicates 50 to 100 sorted cells. Bone marrow cells were pooled from 2 to 4 mice per experiment. Ba, basophil; Bl, blast; Eo, eosinophil; Ery, erythroid; MC, mast cell; N, neutrophil.
Figure 3.
Figure 3.
scRNA-seq of bone marrow basophil/mast cell progenitors reveals transcriptional profile distinct from GMPs. (A) Schematic showing process of isolating BMCP and GMP cells for parallel single-cell sequencing and culture experiments (Figure 2). Table indicates numbers of cells that passed quality and median number of genes detected in scRNA-seq samples. (B) Diffusion map calculated on 4267 highly variable genes from scRNA-seq data colored by cell type. (C) Diffusion map colored by clusters assigned by hierarchical clustering. (D) Heatmap displaying Z-score transformed expression of 15 most significantly differentially expressed genes specific to each cluster. Genes in top rows are upregulated in cluster 1 vs cluster 2, genes in middle rows are upregulated in cluster 2 when compared with cells in clusters 1 and 3, and genes in bottom rows are upregulated in cluster 3 cells when compared with cells in clusters 1 and 2. The colored bars at the top of the heatmap indicate cluster and cell type identity of cells in the columns. (E) Expression of groups of genes from heatmap in panel D in the droplet-based scRNA-seq data. A geometric mean score of counts was calculated for each cell across the genes in a group. The color of cells indicates the value of this score, with gray being the lowest value and red the highest value. Insets in left and center panels show magnifications of regions in black boxes. DC, diffusion component.
Figure 4.
Figure 4.
The transcriptional landscape is altered in W41/W41mice and lacks cells entering a mast cell differentiation program. (A) Cluster identity of WT LK cells. Cells were clustered into 13 clusters using Louvain clustering on the k-nearest-neighbor graph connected scRNA-seq profiles. Cluster identifiers are ordered by size, with cluster 1 containing the most cells and cluster 13 the least. (B) W41/W41 LK cells from 2 animals were sequenced and then assigned to WT clusters based on the cluster identities of their nearest WT neighbors. The color in the plot indicates which WT cluster the W41/W41 cell was mapped to. (C) The 15 nearest neighbors of W41/W41 LK cells from cluster 9 were identified in the WT LK data. Nearest neighbor score represents the number of times a WT is one of those nearest neighbors. (D) Sorting strategy used to isolate BMCPs from bone marrow of W41/W41 mice. The frequency of BMCPs is indicated as percentage of LinSca-1c-Kit+ cells. (E) BMCPs, MPs, and GMPs were cultured in 86 to 100 cell bulk pools for 5 days with myeloid-promoting cytokines and analyzed by flow cytometry. (F) Colonies derived from single BMCPs and MPs cultured in myeloid-promoting conditions were analyzed with flow cytometry. The number of single-cell colonies in which the cell types were determined is indicated above each bar. Supplemental Figure 8C shows the colony sizes. Single GMP colonies were not analyzed. The gating strategy is shown in supplemental Figure 4B,E. The data are pooled from 2 independent experiments. Pooled bone marrow cells from 2 or 3 mice were used in each experiment.
Figure 5.
Figure 5.
Local and global differences in signaling programs of c-Kit mutant mice are revealed by single-cell transcriptional profiling and functional assays. (A) Log2 fold-change of the percentage of cells in a cluster in the W41/W41 WT data divided by the percentage of cells mapped to that cluster in the WT data. Left-hand and right-hand bars indicate fold-changes for samples from 2 separate mice. Fold changes are only displayed for WT clusters with >100 cells. (B) Division kinetics of single WT and W41/W41 HSCs. (C) Colony size of single WT and W41/W41 HSCs at day 10. The results in panel B are derived from 5 WT and 5 W41/W41 mice, in which at total of at least 500 single HSCs were analyzed per genotype. The results in panel C are derived from 6 WT and 7 W41/W41 mice. A total of 598 WT and 629 W41/W41 HSCs were analyzed in panel C. The frequency of HSCs that formed colonies was 94% in WT and 95% in W41/W41 mice. The means and standard error of the mean of the mice are indicated. Unpaired 2-tailed Student t tests for each time point; *P < .05, **P < .01. Clone size estimates: VS, very small (<50 cells); S, small (50-5000 cells); M, medium (5000-10 000 cells); L, large (10 000-50 000); and XL, extra large (≥50 000 cells). (D-G) Violin plots showing the distribution of selected genes in WT and corresponding W41/W41 clusters, as measured by scRNA-seq. Distributions are shown for clusters containing >100 WT cells. Colors correspond to those in Figure 4. Data from WT and W41/W41 mice were normalized independently.

References

    1. Ema H, Morita Y, Suda T. Heterogeneity and hierarchy of hematopoietic stem cells. Exp Hematol. 2014;42(2):74-82.e2. - PubMed
    1. Adolfsson J, Månsson R, Buza-Vidas N, et al. . Identification of Flt3+ lympho-myeloid stem cells lacking erythro-megakaryocytic potential a revised road map for adult blood lineage commitment. Cell. 2005;121(2):295-306. - PubMed
    1. Paul F, Arkin Y, Giladi A, et al. . Transcriptional heterogeneity and lineage commitment in myeloid progenitors. Cell. 2015;163(7):1663-1677. - PubMed
    1. Notta F, Zandi S, Takayama N, et al. . Distinct routes of lineage development reshape the human blood hierarchy across ontogeny. Science. 2016;351(6269):aab2116. - PMC - PubMed
    1. Sun J, Ramos A, Chapman B, et al. . Clonal dynamics of native haematopoiesis. Nature. 2014;514(7522):322-327. - PMC - PubMed

Publication types

Substances