. 2018 Sep 11;138(11):1130-1143.
doi: 10.1161/CIRCULATIONAHA.117.031420.

Regulatory CD4+ T Cells Recognize Major Histocompatibility Complex Class II Molecule-Restricted Peptide Epitopes of Apolipoprotein B

Affiliations

Regulatory CD4+ T Cells Recognize Major Histocompatibility Complex Class II Molecule-Restricted Peptide Epitopes of Apolipoprotein B

Takayuki Kimura et al. Circulation. .

Abstract

Background: CD4+ T cells play an important role in atherosclerosis, but their antigen specificity is poorly understood. Immunization with apolipoprotein B (ApoB, core protein of low density lipoprotein) is known to be atheroprotective in animal models. Here, we report on a human APOB peptide, p18, that is sequence-identical in mouse ApoB and binds to both mouse and human major histocompatibility complex class II molecules.

Methods: We constructed p18 tetramers to detect human and mouse APOB-specific T cells and assayed their phenotype by flow cytometry including CD4 lineage transcription factors, intracellular cytokines, and T cell receptor activation. Apolipoprotein E-deficient ( Apoe-/-) mice were vaccinated with p18 peptide or adjuvants alone, and atherosclerotic burden in the aorta was determined.

Results: In human peripheral blood mononuclear cells from donors without cardiovascular disease, p18 specific CD4+ T cells detected by a new human leukocyte antigen-antigen D related-p18 tetramers were mostly Foxp3+ regulatory T cells (Tregs). Donors with subclinical cardiovascular disease as detected by carotid artery ultrasound had Tregs coexpressing retinoic acid-related orphan receptor gamma t or T-bet, which were both almost absent in donors without cardiovascular disease. In Apoe-/- mice, immunization with p18 induced Tregs and reduced atherosclerotic lesions. After peptide restimulation, responding CD4+ T cells identified by Nur77-GFP (green fluorescent protein) were highly enriched in Tregs. A new mouse I-Ab-p18 tetramer identified the expansion of p18-specific CD4+ T cells on vaccination, which were enriched for interleukin-10-producing Tregs.

Conclusions: These findings show that APOB p18-specific CD4+ T cells are mainly Tregs in healthy donors, but coexpress other CD4 lineage transcription factors in donors with subclinical cardiovascular disease. This study identifies ApoB peptide 18 as the first Treg epitope in human and mouse atherosclerosis.

Keywords: antigen specificity; apoB-100; atherosclerosis; regulatory T cells; vaccination.


Conflict of interest statement

Disclosure

K.L. is an inventor on a patent application that includes p18. Other authors do not report any conflict of interest.

Figures

Figure 1
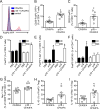
Figure 1. Apolipoprotein B (APOB) peptide specific CD4+ T cells in human peripheral blood mononuclear cells (PBMCs)
(A) APOB peptide p18 is sequence-identical in mouse ApoB and human APOB; residue numbers of mature protein. The MHC-II binding core nonamers are shown in bold. (B) Binding affinity of p18 to mouse (I-Ab) and human MHC-II (DRB1*07:01). (C) Structure of tetramer reagent which was made from HLA-DRA and HLA-DRB1*07:01 loaded with p18 for detecting p18-specific T cell receptors and conjugated separately with PE or APC. (D) Human PBMCs were collected from Women’s Interagency HIV Study participants expressing DRB1*07:01 or not (mismatch). PBMCs were analyzed by multi-color flow cytometry after staining with DRB1*07:01-p18 tetramer (PE- and APC-labeled) and cell surface markers. The analyzed populations were gated on singlet, dump channel (CD8, CD14, CD19, CD56, and viability dye) negative, CD3+CD4+ T cells. (E) Representative plots of PE- and APC-labeled tetramer staining gated as shown above. Tetramer+ (tet+) cells were defined as PE- and APC-positive. (F) Percentage of tet+ cells among CD3+CD4+ T cells of individuals expressing DRB1*07:01 (N=29) or not (mismatch) (N=11) (left) or between individuals with (N=14) or without sCVD (N=15). (G) Lineage-defining transcription factors were analyzed by intracellular staining of tet+CD4+ T cells. Average frequencies among tet+CD4+ T cells isolated from participants with (N=10) or without sCVD (N=11) are displayed. (H) Percentage of FoxP3+RORgt+ and (I) ratio of FoxP3+RORgt+ to FoxP3+ cells among tet+CD4+ T cells. (F, H, I) Data is presented as mean ± SEM. *p<0.05 by unpaired t-test.
Figure 2
Figure 2. Increased Tregs in peritoneal cavity after immunization with p18
(A) Representative histograms of FoxP3-YFP expression in peritoneal CD4+ T cells of western diet (WD) fed FoxP3YFPcre Apoe−/− mice immunized with p18 (one prime in CFA followed by one boost in IFA) (red) or adjuvant (CFA/IFA) only (blue). CD8+ T cells from the same mouse as negative control (black). (B) Percentage of CD25+FoxP3+ by YFP in FoxP3YFPcre Apoe−/− mice and (C) by intracellular staining of FoxP3 in Apoe−/− mice. (D-F) Percentage of FoxP3+ (D), FoxP3+T-bet+ (E), and FoxP3+GATA3+ cells among peritoneal CD4+ T cells in control (PBS or p18) or p18 immunized (p18 + CFA/IFA) Apoe−/− mice fed chow diet (CD, black) or western diet (WD, white) for 4 weeks. N=9-10 per group. Data is presented as mean ± SEM. *p<0.05 by one-way ANOVA followed by Dunnett’s test for multiple comparisons. The mean of each column was compared to the mean of the CD PBS group. (G) Percentage of neuropilin-1 (Nrp-1) negative inducible Tregs (iTregs) among all Tregs (CD25+FoxP3+). (H) Percentage of IL-10 producing cells among Tregs and (I) Nrp-1 iTregs. N=7 mice (B, G, H, I) and N=6 mice (C) per group, *p<0.05, by Mann-Whitney U-test.
Figure 3
Figure 3. Activation of Tregs in mice vaccinated with p18
Peritoneal cells from Nur77GFP Apoe−/− mice immunized with p18 (one prime in CFA and one boost in IFA) or adjuvant (CFA/IFA) only were gated on live singlet TCRβ+CD4+ T cells and analyzed by multi-color flow cytometry 24 hours after peptide restimulation. (A) Representative plots of Nur77GFP expression in CD4+ T cells. (B) Histogram of Nur77GFP expression among CD4+ T cells after p18 in CFA/IFA (red) or CFA/IFA only (blue). (C) Percentage of Nur77GFP+ cells among CD4+ T cells. (D) Representative plots of Nur77-GFP expression in CD25+FoxP3+ Tregs. (E) Histogram of Nur77GFP expression on CD25+FoxP3+ Tregs from mice immunized with p18 or adjuvant only. (F) Percentage of CD25+FoxP3+ Tregs among Nur77GFP+ or Nur77GFP– CD4+ T cells (immunized with p18). N=5-6 (C, F) per group. Mean ± SEM, *p<0.05 by Mann-Whitney U-test.
Figure 4
Figure 4. p18-specific peritoneal CD4+ T cells in mice immunized with p18
(A) Peritoneal cells were harvested from western diet (WD) fed Nur77GFPApoe−/− mice immunized with p18 (one prime in CFA and one boost in IFA) or adjuvant only (CFA/IFA) and analyzed by multi-color flow cytometry after staining with I-Ab-p18 tetramer (PE and APC-labeled). All gated on live singlet CD45+TCRβ+CD4+ T cells. Representative plots of PE-labeled and APC-labeled tetramer staining of CD4+ T cells. Tetramer+ cells were defined as PE- and APC-double positive population. (B) Percentage of p18:I-Ab tetramer-labeled cells among all peritoneal CD4+ T cells. (C) Percentage of CD25+FoxP3+ Tregs among p18:I-Ab tetramer+ and p18:I-Ab tetramer peritoneal CD4+ T cells. (D) Percentage of CD4+ T cells among Nur77GFP+ and Nur77GFP– peritoneal CD4+ T cells. N=5-6 per group. Means ± SEM. *p<0.05 and ***p<0.001 by Mann-Whitney U-test.
Figure 5
Figure 5. p18-specific CD4+ splenocytes produce more IL-10 after immunization with p18
(A) Splenic CD4+ T cells from IL-10GFP Apoe−/− mice immunized with p18 or adjuvant only were analyzed by multi-color flow cytometry after staining with I-Ab-p18 tetramer. Percentage of p18:I-Ab+ CD4+ T cells (gated on live singlet CD45+TCRβ+CD4+). N=4-5 mice per group. (B) Representative scatter plot of IL-10 expression (GFP) on p18:I-Ab+ (red) and p18:I-Ab– (blue) CD4+ T cells. (C) Mean fluorescence intensity (MFI) of IL-10 (GFP) in splenic FoxP3+CD4+ T cells. (D) Phenotype of p18:I-Ab+ and p18:I-Ab– CD4+ T cells in spleen. Naïve T cells, central memory T cells (TCM), and effector memory T cells (TEM) are defined as CD62L+CD44, CD62L+CD44+, and CD62LCD44+, respectively. (E) Frequency of FoxP3+ cells among splenic p18:I-Ab+ and p18:I-Ab– CD4+ T cells after immunization with p18 or adjuvant only. (F) Percentage of splenic p18:I-Ab+FoxP3+ among CD4+ T cells from control (PBS injected) or p18 immunized (p18 + CFA/IFA: one prime, one boost) Apoe−/− mice fed chow diet (CD). (G) Splenic CD4+ T cells from Apoe−/− mice immunized with p18 were co-cultured with antigen-presenting cells and p18 peptide or PMA/ionomycin as positive control. IL-10 production was evaluated with ELISPOT and quantified by spot forming colonies (SFC) per 1 million cells. N=4-5 (A, C), N=9-10 (E-G) mice per group. Means ± SEM. *p<0.05, **p<0.01, and ***p<0.001 by Mann-Whitney U-test.
Figure 6
Figure 6. Aortic atherosclerosis in Apoe−/− mice vaccinated with p18
(A) Female Apoe−/− mice were fed at 10 weeks of age for 13 weeks western diet and immunized once with either p18 or adjuvant only in CFA, then boosted four times with p18 or adjuvant only in IFA. (B) Representative images of whole aorta stained with Sudan IV. Atherosclerotic plaque was quantified as percentage of whole aorta (C) and aortic arch (D). N=8-9 mice per group, means ± SEM. *p<0.05 by Mann-Whitney U-test.

References

    1. Sakaguchi S, Yamaguchi T, Nomura T, Ono M. Regulatory T cells and immune tolerance. Cell. 2008;133:775–787. - PubMed
    1. Witztum JL, Lichtman AH. The influence of innate and adaptive immune responses on atherosclerosis. Annual review of pathology. 2014;9:73–102. - PMC - PubMed
    1. Moore KJ, Sheedy FJ, Fisher EA. Macrophages in atherosclerosis: a dynamic balance. Nat Rev Immunol. 2013;13:709–721. - PMC - PubMed
    1. Ley K, Miller YI, Hedrick CC. Monocyte and macrophage dynamics during atherogenesis. Arterioscler Thromb Vasc Biol. 2011;31:1506–1516. - PMC - PubMed
    1. Jonasson L, Holm J, Skalli O, Bondjers G, Hansson GK. Regional accumulations of T cells, macrophages, and smooth muscle cells in the human atherosclerotic plaque. Arteriosclerosis. 1986;6:131–138. - PubMed

Publication types

MeSH terms