. 2018 Jul 24;138(4):377-393.
doi: 10.1161/CIRCULATIONAHA.117.032291.

Spatiotemporal Multi-Omics Mapping Generates a Molecular Atlas of the Aortic Valve and Reveals Networks Driving Disease

Affiliations

Spatiotemporal Multi-Omics Mapping Generates a Molecular Atlas of the Aortic Valve and Reveals Networks Driving Disease

Florian Schlotter et al. Circulation. .

Abstract

Background: No pharmacological therapy exists for calcific aortic valve disease (CAVD), which confers a dismal prognosis without invasive valve replacement. The search for therapeutics and early diagnostics is challenging because CAVD presents in multiple pathological stages. Moreover, it occurs in the context of a complex, multi-layered tissue architecture; a rich and abundant extracellular matrix phenotype; and a unique, highly plastic, and multipotent resident cell population.

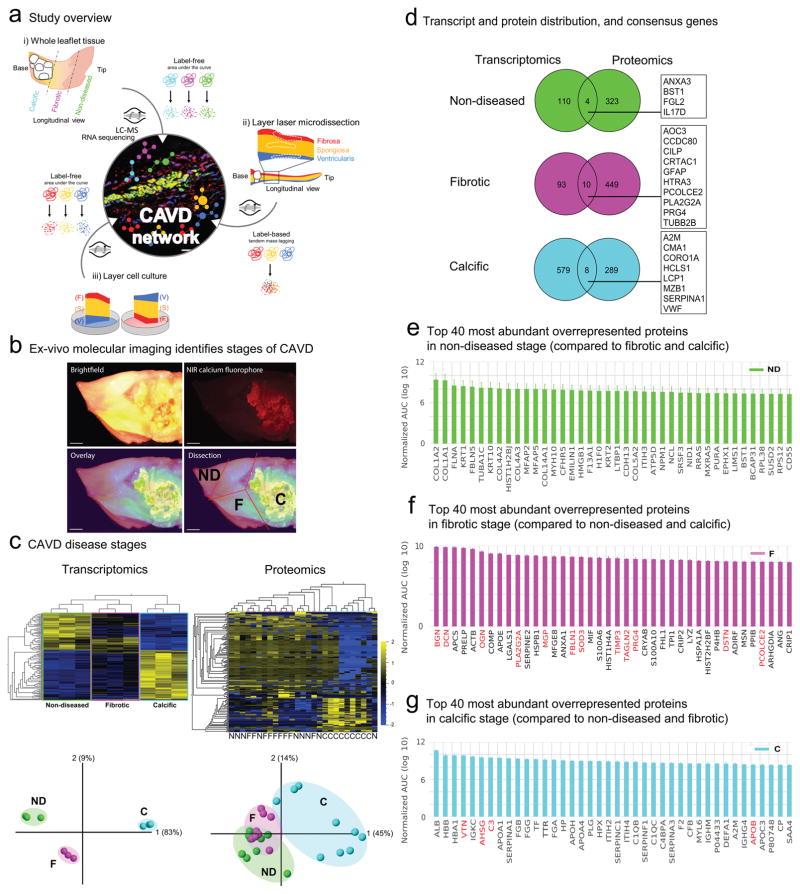
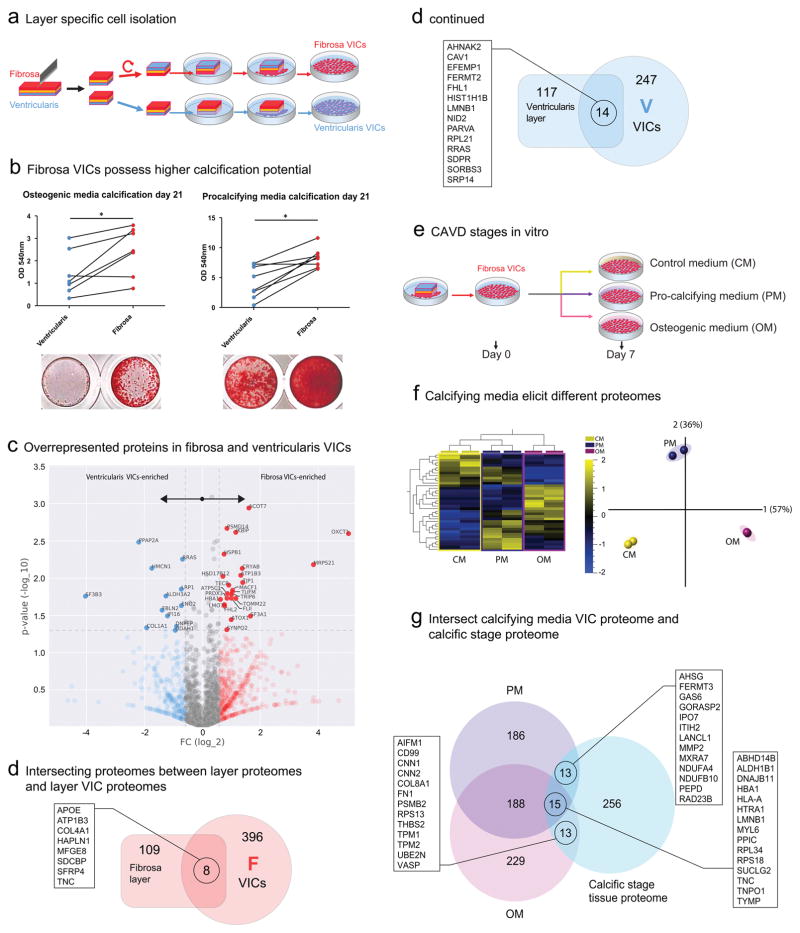
Methods: A total of 25 human stenotic aortic valves obtained from valve replacement surgeries were analyzed by multiple modalities, including transcriptomics and global unlabeled and label-based tandem-mass-tagged proteomics. Segmentation of valves into disease stage-specific samples was guided by near-infrared molecular imaging, and anatomic layer-specificity was facilitated by laser capture microdissection. Side-specific cell cultures were subjected to multiple calcifying stimuli, and their calcification potential and basal/stimulated proteomes were evaluated. Molecular (protein-protein) interaction networks were built, and their central proteins and disease associations were identified.

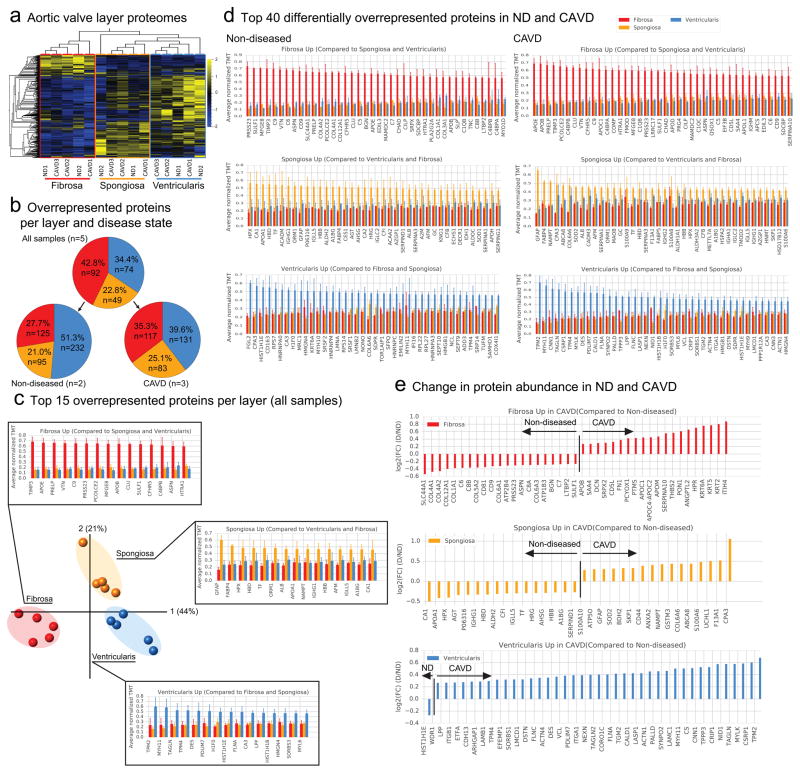
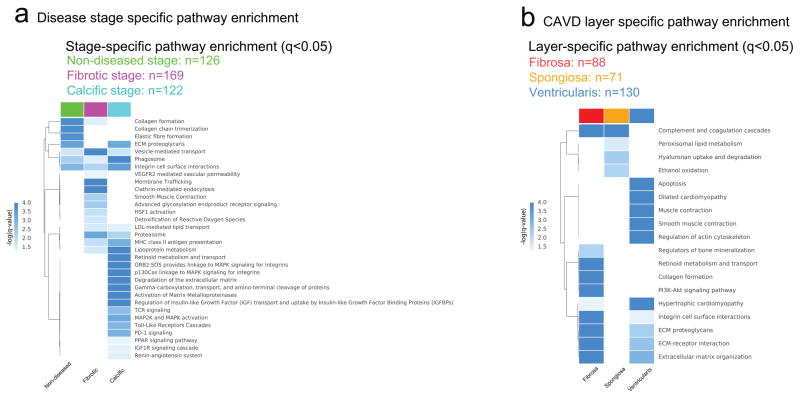
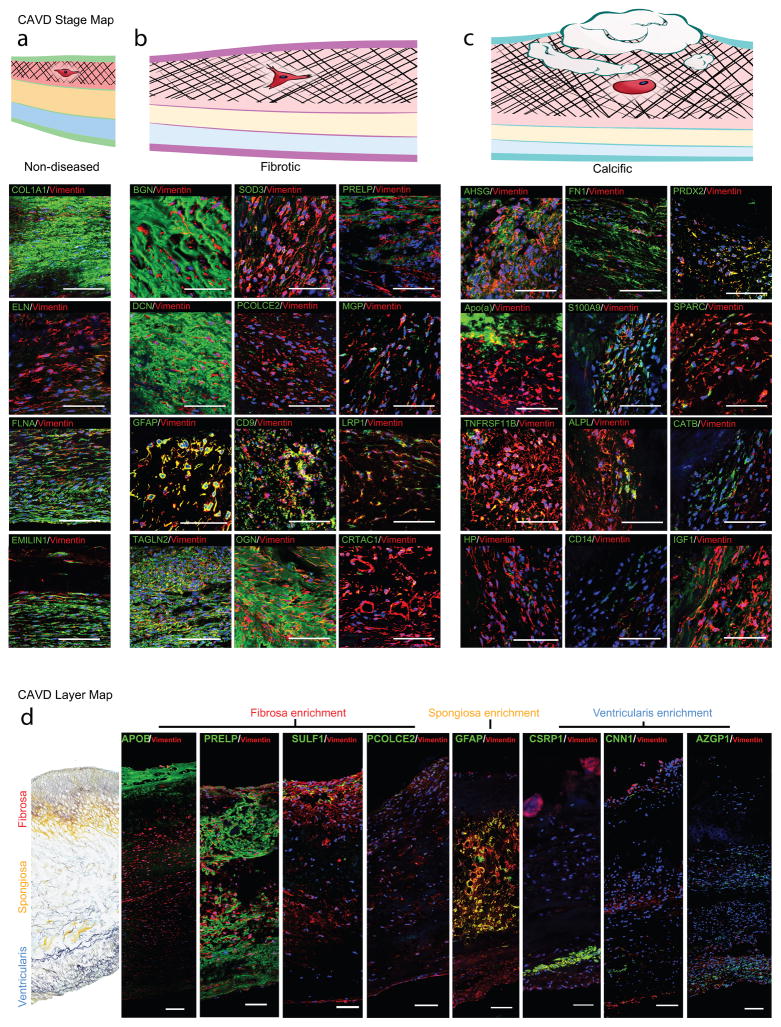
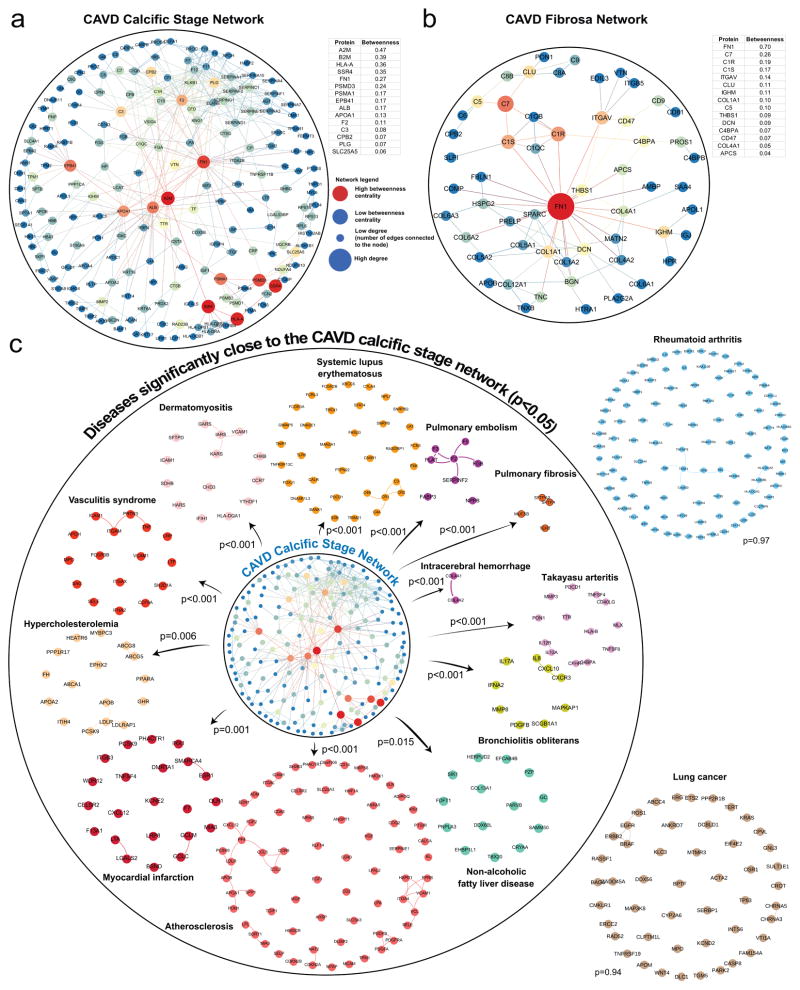
Results: Global transcriptional and protein expression signatures differed between the nondiseased, fibrotic, and calcific stages of CAVD. Anatomic aortic valve microlayers exhibited unique proteome profiles that were maintained throughout disease progression and identified glial fibrillary acidic protein as a specific marker of valvular interstitial cells from the spongiosa layer. CAVD disease progression was marked by an emergence of smooth muscle cell activation, inflammation, and calcification-related pathways. Proteins overrepresented in the disease-prone fibrosa are functionally annotated to fibrosis and calcification pathways, and we found that in vitro, fibrosa-derived valvular interstitial cells demonstrated greater calcification potential than those from the ventricularis. These studies confirmed that the microlayer-specific proteome was preserved in cultured valvular interstitial cells, and that valvular interstitial cells exposed to alkaline phosphatase-dependent and alkaline phosphatase-independent calcifying stimuli had distinct proteome profiles, both of which overlapped with that of the whole tissue. Analysis of protein-protein interaction networks found a significant closeness to multiple inflammatory and fibrotic diseases.

Conclusions: A spatially and temporally resolved multi-omics, and network and systems biology strategy identifies the first molecular regulatory networks in CAVD, a cardiac condition without a pharmacological cure, and describes a novel means of systematic disease ontology that is broadly applicable to comprehensive omics studies of cardiovascular diseases.

Keywords: aortic valve; network medicine; proteomics; stenosis; transcriptomics; vascular calcification.


Figures

Figure 1
Figure 1. CAVD Omics Study Design and CAVD Disease-associated Stages
a. CAVD mapping study overview: i) CAVD Disease Stages: human aortic valve (AV) whole leaflet tissue was separated into disease-associated stages guided by molecular imaging and transcriptomics and label-free proteomics were conducted (liquid-chromatography-mass spectrometry (LC-MS)); ii) CAVD Layers: human AV leaflet layer proteomics by label-based tandem mass tagging LC-MS; iii) CAVD VICs: layer-specific valvular interstitial cell (VIC) migration culture analysis by label-free LC-MS. Selected molecules form each sub-study were then mapped by immunofluorescence, and pathway and molecular network analyses. The area under the curve of the chromatographic peak intensity as a label-free measure of peptide abundance of up to the top three abundant peptides was used for quantification in the two label-free experiments. b. Calcified human AV leaflets stained with near-infrared fluorescence calcium tracer was sectioned into 3 disease-associated stages (ND- non-diseased, F- fibrotic, C- calcific). Scale bar = 1mm. c. CAVD Disease Stages: Transcriptomics and proteomics heat map and principal component analysis (PCA) for 3 stages on n=3 donors for transcriptomics and n=9 donors for proteomics, (transcripts and proteins filtered with q<0.2 for between-stage difference, N: non-diseased, F: fibrotic, C: calcific). d. The number of overrepresented proteins and their percentages of each stage in the transcriptomics (left) and proteomics (right) CAVD Disease Stages data. Proteins/genes classified into the same stage in both omics datasets are shown in their respective boxes. e–g. The top 40 most abundant ‘stage-specific’ proteins ranked according to the logarithm of their normalized mean AUCs for the three stages from the CAVD Disease Stages proteomics data. Proteins highlighted in red signify previously implicated proteins in AV fibrosis and calcification.
Figure 2
Figure 2. CAVD OMICs in the Three Leaflet Microlayers (CAVD Layers)
a. Proteomics heatmap of 5 donor samples (2 ND and 3 CAVD) per layer. b. The number and relative percentage of proteins highly expressed in the fibrosa (red), spongiosa (yellow), and ventricularis (blue) layer for non-diseased (ND) tissue only (left), diseased (CAVD) tissue only (right). c. PCA of 5 donor samples (2 ND and 3 CAVD) per layer and the top 15 “layer-specific” proteins per layer, ranked according to their average normalized TMT in all three layers as a consistent signal regardless of the disease state. Error bars indicate standard deviation (SD). d. The top 40 “layer-specific” proteins ranked according to their average normalized TMT in all three layers for ND (left) and CAVD (right) tissues. Error bars indicate SD. e. The “layer-specific” proteins ranked according to their fold change abundance from ND to CAVD [denoted FC(D/ND]. The proteins on the left of the vertical line are more expressed in ND tissue whereas the proteins to the right of the vertical line are more expressed in CAVD tissue. Proteins with FC(D/ND) > 1.2 and FC(D/ND) < 1/1.2 are shown for brevity.
Figure 3
Figure 3. CAVD Disease Stages and CAVD Layers Functional Analysis
a.. Pathways that are significantly enriched (q < 0.05) in the non-diseased (ND, green), fibrotic (F, magenta), and calcific (C, cyan) stages, obtained from proteomics data (n=9 donors). Selected pathways are listed for the non-diseased, fibrotic and calcific stages (Full pathway lists are available in Supplemental Figure 9, Supplemental Table 3). b. Pathways that are significantly enriched (q < 0.05) in the fibrosa (red), spongiosa (orange), and ventricularis (blue) layers, obtained from proteomics data (n=3 CAVD AV samples). Selected pathways are listed for the three layers (Full pathway lists are available in Supplemental Figure 11, Supplemental Table 4).
Figure 4
Figure 4. CAVD using VICs Isolated from Fibrosa and Ventricularis Microlayers
a. Layer specific cell isolation: AV leaflet samples were dissected in halves, and the fibrosa or ventricularis side placed downwards. The VICs migrate out and expand the layer-specific cultures. b. Fibrosa VICs display a higher propensity to calcification in osteogenic (OM, n=7 individual donors) and procalcifying media (PM, n=8 donors); calcification was evaluated by Alizarin Red staining and quantitatively evaluated; * indicates p<0.05. c. Volcano plot for the Day 0 CAVD VICs proteomics data. Blue and red markers indicate “layer-specific” proteins highly expressed in ventricularis and fibrosa, respectively, with a fold change (FC) cutoff of 1.5. The significantly enriched (p<0.05) layer-specific proteins are denoted with their names. d. Venn diagrams showing the intersection of proteins from tissue proteomics (CAVD Layers, rectangle on the left) and VIC proteomics (CAVD VICs, circle on the right) for the fibrosa (red) and ventricularis (blue) layers. Proteins at the intersection of each pair of sets are shown. Comparison of Calcification-associated Disease Stage with Fibrosa-derived VICs Cultured in Osteogenic and Procalcifying Environment e. Fibrosa-derived VICs were cultured in control (CM), osteogenic (OM), and procalcifying (PM) media, and protein samples were collected after 7 days in the respective media. f. Heatmap and PCA of the proteomes of fibrosa VICs (from 2 independent donors) cultured in CM, OM, and PM for 7 days (q<0.05-filtered data for difference between media conditions, data derived from the CAVD VICs dataset). g. The intersection of the VIC-PM and VIC-OM proteome after seven days of media treatment with the calcific stage CAVD Disease Stages proteome (n=9) from whole tissue proteomics. Proteins at the intersection regions are marked.
Figure 5
Figure 5. CAVD Protein Maps
a–c. CAVD disease stage map: Immunofluorescence staining (IF) of proteins enriched in the (a) non-diseased, (b) fibrotic, and (c) calcific stage. Vimentin indicates VICs. DAPI stains nuclei. Scale bar indicates 100μm. d. CAVD microlayer map: IF of representative proteins for high layer specificity in the layer proteomics; ApoB, PRELP, SULF1, and PCOLCE2 were detected primarily in the fibrosa; GFAP specifically in the spongiosa, and CSRP1, CNN1, and AZGP1 in the ventricularis VICs; scale bar indicates 100μm.
Figure 6
Figure 6. CAVD Disease-associated Stage and CAVD Fibrosa Leaflet Microlayer Protein Networks in Relation to CAVD Calcific Stage Disease Module
a. The largest connected component of the calcific stage subnetwork (calcific stage of the CAVD Disease Stage proteome). The subnetwork is generated by mapping the calcific stage proteome onto the protein-protein interaction (PPI) network. The node size indicates the number of connections (degree) and the node color indicates the betweenness centrality (blue: low betweenness centrality, red: high betweenness centrality). The key proteins with the highest betweenness centrality values shown in the table are marked by the red nodes in the subnetwork. b. The largest connected component of the CAVD fibrosa subnetwork (CAVD fibrosa layer of the CAVD Layers proteome). c. Disease associations of the CAVD calcific stage network to cardiovascular, malignant, metabolic, autoimmune diseases were measured in terms of the average network distance (see Methods for details). Disease modules are built by mapping the respective disease-related genes onto the PPI network. Diseases inside the circle represent the significant disease associations, with empirical p <0.05, whereas the diseases outside the circle are not significantly associated. Empirical p-values are calculated based on 1,000 randomizations.

Comment in

References

    1. Stewart BF, Siscovick D, Lind BK, Gardin JM, Gottdiener JS, Smith VE, Kitzman DW, Otto CM. Clinical factors associated with calcific aortic valve disease. J Am Coll Cardiol. 1997;29:630–634. - PubMed
    1. Nishimura RA, Otto CM, Bonow RO, Carabello BA, Erwin JP, 3rd, Guyton RA, O’Gara PT, Ruiz CE, Skubas NJ, Sorajja P, Sundt TM, 3rd, Thomas JD. 2014 aha/acc guideline for the management of patients with valvular heart disease: Executive summary: A report of the american college of cardiology/american heart association task force on practice guidelines. Circulation. 2014;129:2440–2492. - PubMed
    1. Ross J, Braunwald E. Aortic stenosis. Circulation. 1968;38:V-61–V-67. - PubMed
    1. Schoen FJ. Evolving concepts of cardiac valve dynamics. Circulation. 2008;118:1864. - PubMed
    1. Otto CM, Kuusisto J, Reichenbach DD, Gown AM, O’Brien KD. Characterization of the early lesion of ‘degenerative’ valvular aortic stenosis. Histological and immunohistochemical studies. Circulation. 1994;90:844–853. - PubMed

Publication types

MeSH terms

Substances