. 2018 May 7;215(5):1397-1415.
doi: 10.1084/jem.20171761. Epub 2018 Mar 27.

Microbial symbionts regulate the primary Ig repertoire

Affiliations

Microbial symbionts regulate the primary Ig repertoire

Yuezhou Chen et al. J Exp Med. .

Abstract

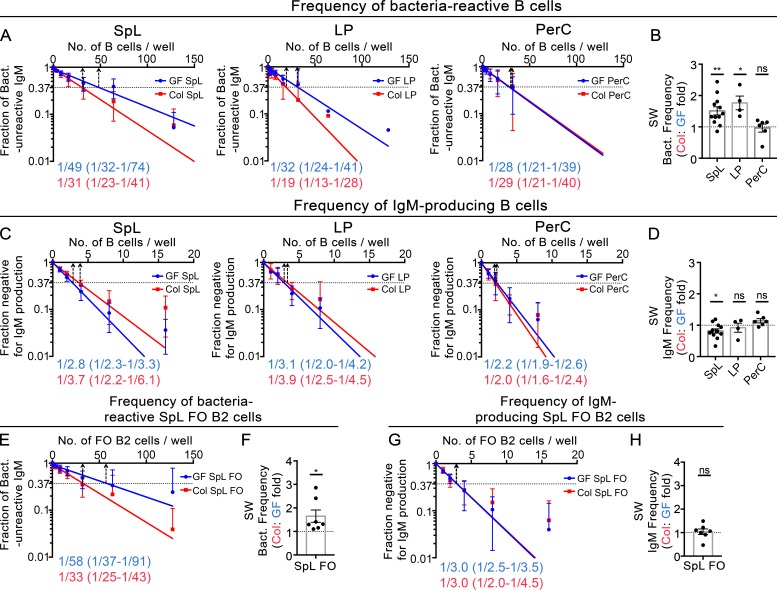
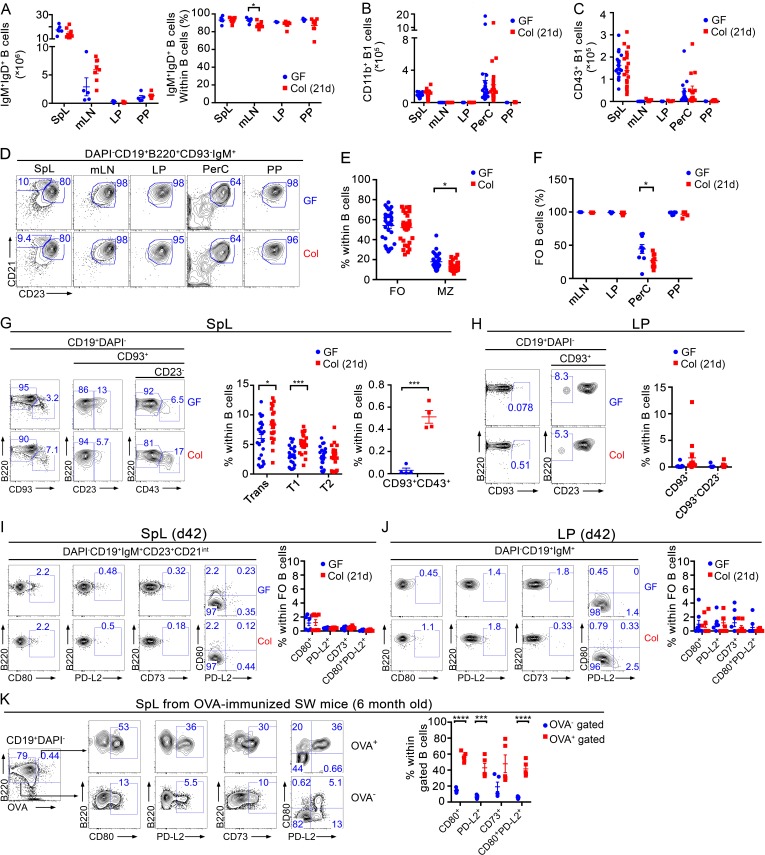
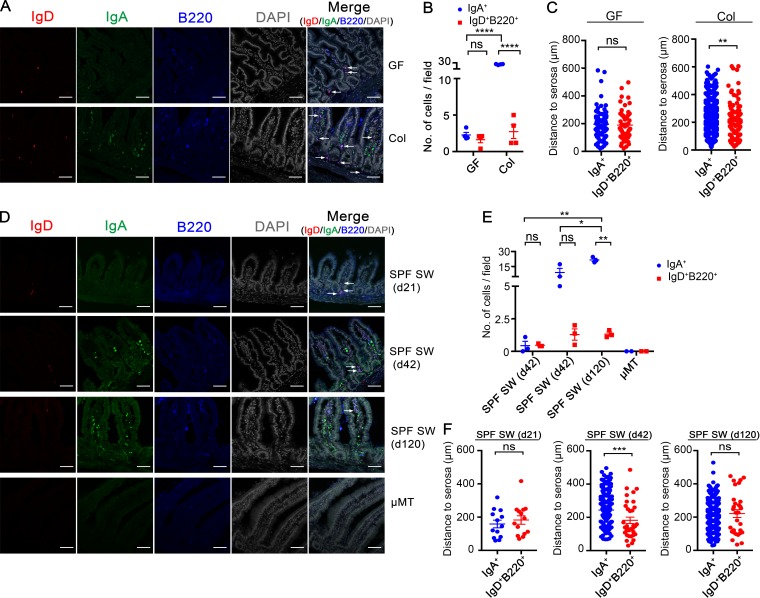
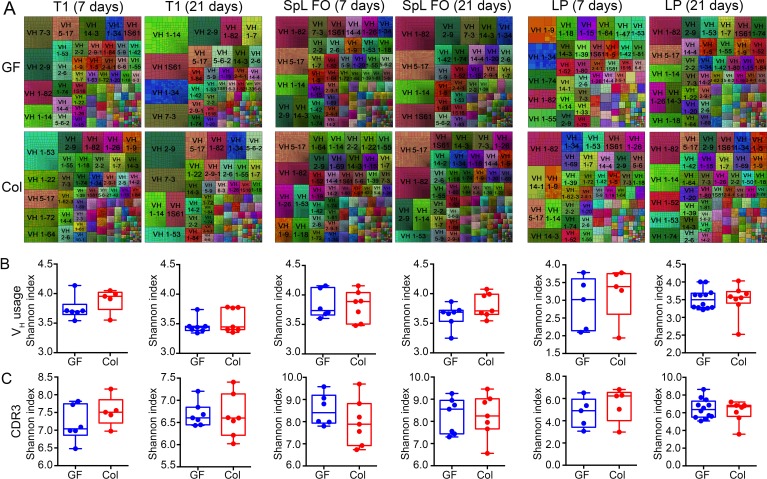
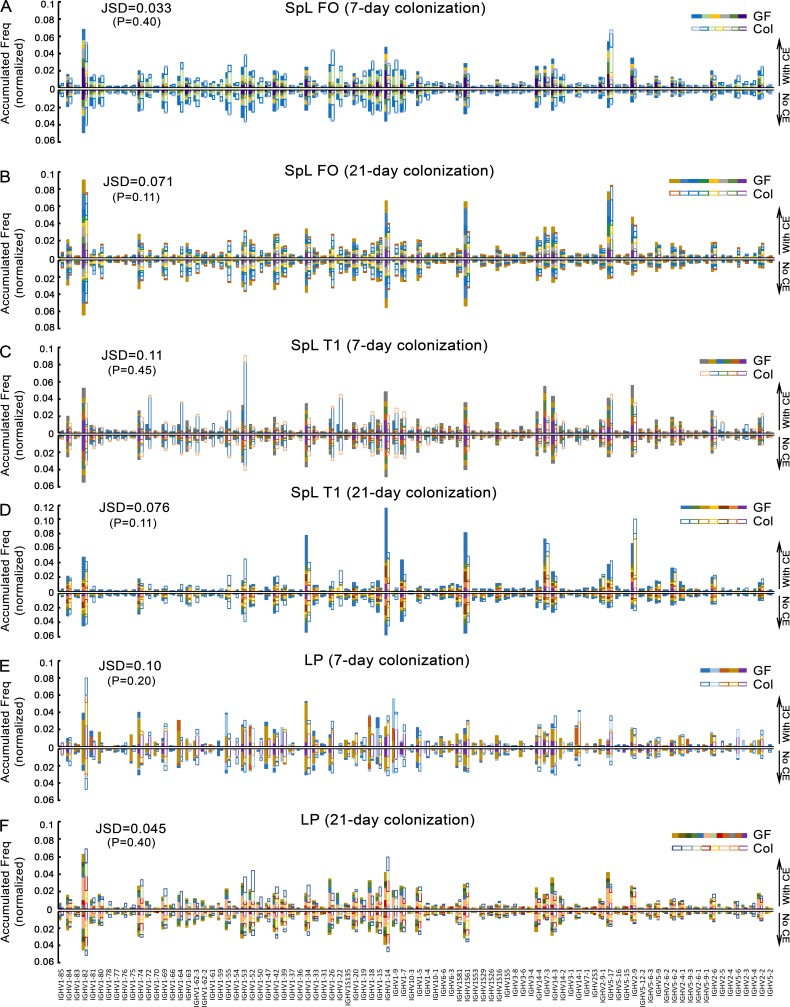
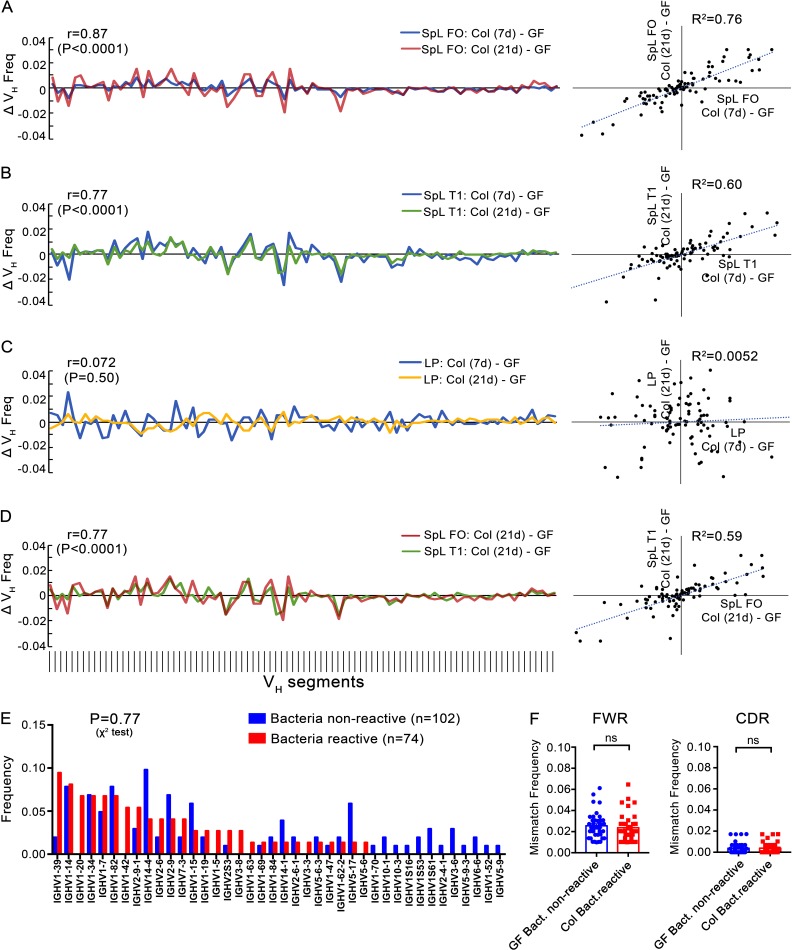
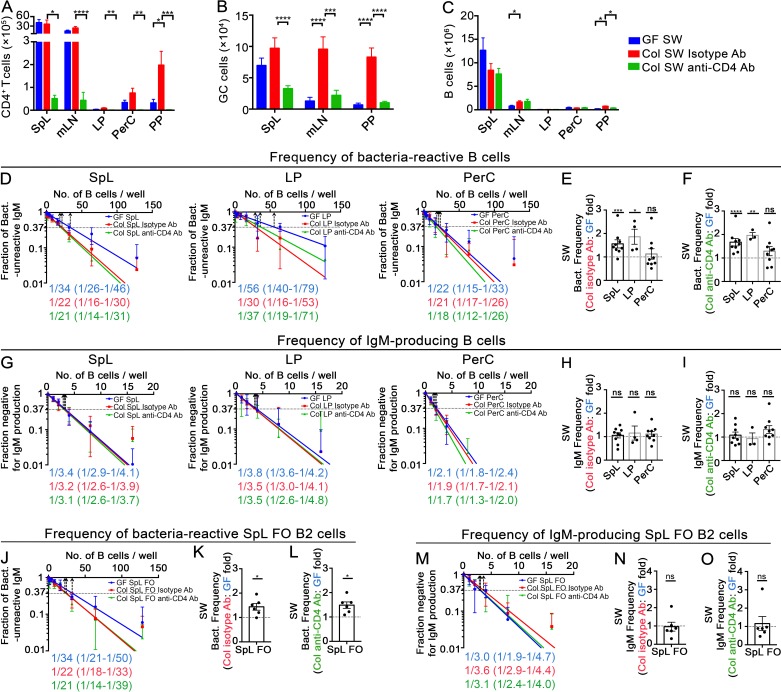
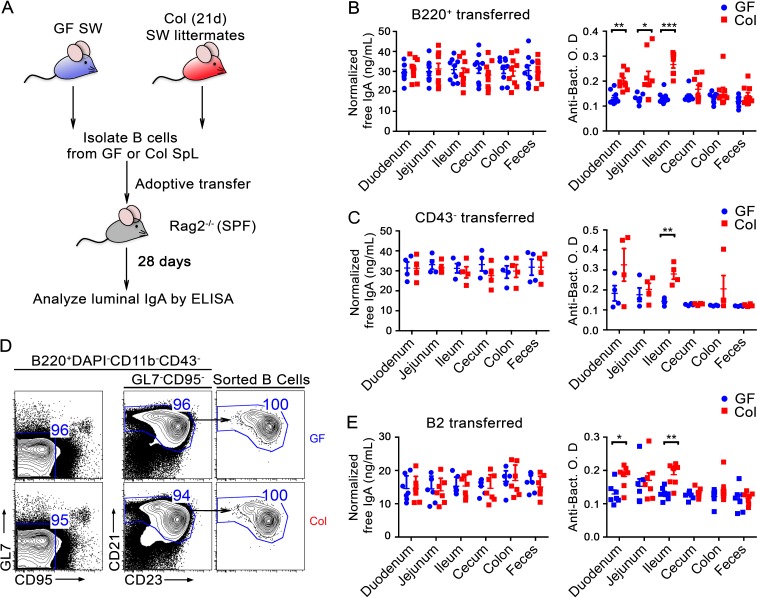
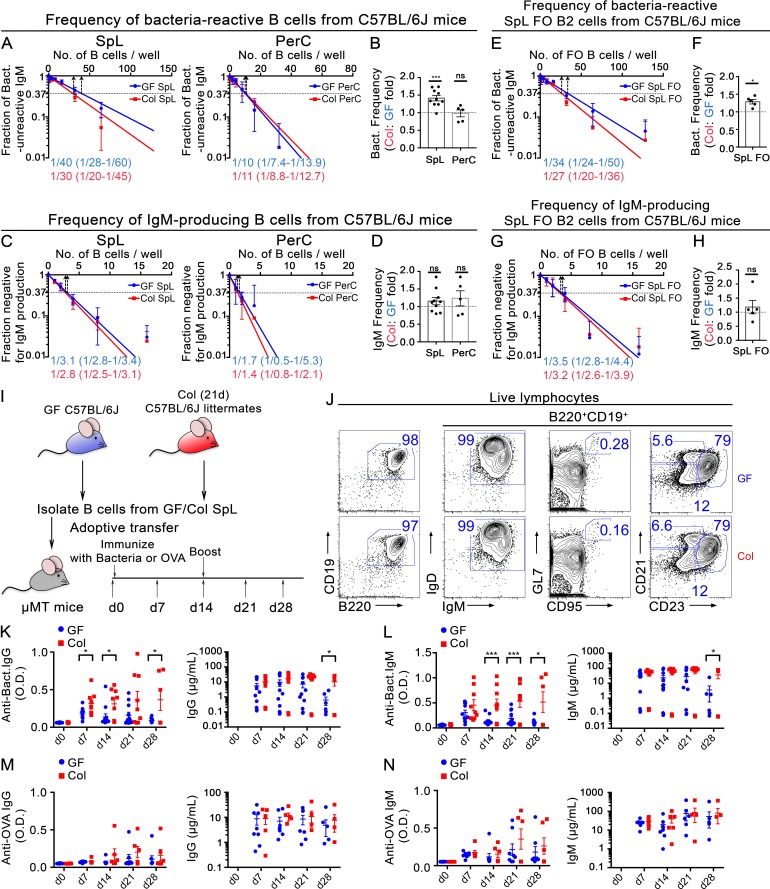
The ability of immunoglobulin (Ig) to recognize pathogens is critical for optimal immune fitness. Early events that shape preimmune Ig repertoires, expressed on IgM+ IgD+ B cells as B cell receptors (BCRs), are poorly defined. Here, we studied germ-free mice and conventionalized littermates to explore the hypothesis that symbiotic microbes help shape the preimmune Ig repertoire. Ig-binding assays showed that exposure to conventional microbial symbionts enriched frequencies of antibacterial IgM+ IgD+ B cells in intestine and spleen. This enrichment affected follicular B cells, involving a diverse set of Ig-variable region gene segments, and was T cell-independent. Functionally, enrichment of microbe reactivity primed basal levels of small intestinal T cell-independent, symbiont-reactive IgA and enhanced systemic IgG responses to bacterial immunization. These results demonstrate that microbial symbionts influence host immunity by enriching frequencies of antibacterial specificities within preimmune B cell repertoires and that this may have consequences for mucosal and systemic immunity.


Figures

Figure 1.
Figure 1.
Exposure of weanling GF mice to microbial symbionts leads to increased bacterial reactivity in the primary Ig repertoire. (A–H) LDA line graphs (A, C, E, and G) and fold-change bar graphs (B, D, F, and H) showing comparisons of frequencies of bacteria-reactive IgM (A, B, E, and F) and total IgM-producing B cells (C, D, G, and H) of the indicated sorted cells from GF (blue; n = 4–12) or mice colonized with SPF microbiota (Col, red; n = 4–12). Splenic B cells were sorted based on a DAPI B220+. Splenic follicular (FO) B cells were sorted based on the DAPI B220+ CD93 GL7 CD95 CD43 CD23+ CD21int phenotype. Dots indicate individual mice. Data are from 4–10 independent experiments. P-values were calculated using the one-sample t test. The dashed line in the bar graphs indicates the null hypothesis. For the LDA, the number of IgM-producing cells giving rise to 37% of wells negative for bacteria binding defines the frequency of reactivity based on Poisson statistics as described (Vale et al., 2012). Numbers in parenthesis in A, C, E, and G indicate 95% confidence intervals (CI). Dotted arrows indicate the minimum number of cells required to recover bacteria-reactive IgM (A and E) or total IgM production (C and G). Error bars indicate ± 95% CI (A, C, E, and G) or ± SEM (B, D, F, and H). *, P < 0.05; **, P < 0.01. ns, not significant. Conventionalization occurred for 21 d beginning at the age of postnatal day 21.
Figure 2.
Figure 2.
Composition of B cell subsets in GF and conventionalized littermates. (A) Dot plots showing numbers and percentages of IgM+ IgD+ B cells from the indicated tissues ofGF (n = 3–6) and colonized littermates (Col; n = 7–9). Data are from two to three independent experiments. (B and C) Dot plots showing the number of PerC B1 cells (DAPI CD19+ B220+ IgM+ CD93 CD23 CD11b+; B) or splenic B1 cells (DAPI CD19+ B220+ IgM+ CD93 CD23 CD43+; C) from indicated tissues of young GF (n = 9–23) and colonized littermate (Col; n = 11–24) mice. Data are from four to six independent experiments. (D–F) FACS plots (D) and scatter plots (E and F) showing the percentage of B cells with follicular (FO) B cell (DAPI CD19+ B220+ IgM+ CD93 CD23+ CD21int) and marginal zone (MZ) B cell (DAPI CD19+ B220+ IgM+ CD93 CD23CD21hi; D and E) phenotypes from GF (n = 5–23) and colonized SW littermates (Col; n = 5–21). Data are shown for two to seven independent experiments. (G) FACS plots and scatter plots showing the percentage of splenic transitional (Trans) B cells (DAPI CD19+ B220low CD93+), transitional 1 (T1) B cells (DAPI CD19+ B220low CD93+ CD23), transitional 2 (T2) B cells (DAPI CD19+ B220low CD93+ CD23+), and progenitor B cells (DAPI CD19+ B220low IgM CD93+ CD43+) from GF (n = 4–23) and colonized littermates (Col; n = 4–21). Data are shown for 2–10 independent experiments. (H) FACS plots and scatter plot showing the percentage of LP B cells with CD93+ and CD93+ CD23 phenotypes from GF (n = 15) and colonized littermates (Col; n = 13). Data are shown for five independent experiments. (I and J) FACS plots and scatter plots showing the percentage of splenic B cells (I) and LP B cells (J) with surface expression of CD80, PD-L2, and CD73 from GF (n = 8) and colonized littermates (Col; n = 8). Data are shown for two independent experiments. (K) FACS plots and scatter plot showing the percentage of splenic B cells with surface expression of CD80, PD-L2, and CD73 gated on OVA+ or OVA B cells from OVA-immunized SW mice (n = 5). SW mice were immunized with 100 µg OVA in Alum every 3 wk times three, beginning at the age of 2 mo. Spleens were collected 8–9 wk after the last immunization and used as a positive control for the memory marker stains. Data are shown for two independent experiments. Two-tailed t test. Error bars in the results indicate ± SEM. *, P < 0.05; ***, P < 0.0005; ****, P < 0.0001. For all the conventionalization experiments, the GF SW littermates were conventionalized to SPF conditions at the age of postnatal day 21 for 21 d.
Figure 3.
Figure 3.
Localization of intestinal IgD+ B Cells. (A) Representative photomicrographs of small intestinal sections stained with DAPI- and fluorophore-conjugated Ab for IgD (FITC), IgA (PE), and B220 (APC) as indicated from GF (n = 4) and conventionalized SW littermates (Col, n = 4). Photomicrographs shown are representative of one of two independent experiments. (B) Dot plot showing the number of LP IgA+ cells and IgD+ B220+ cells per high power field (200×) per GF (n = 4; 10 fields/mouse) and conventionalized SW littermates (Col; n = 4; 11 fields/mouse) described as in A. (C) Dot plots showing the perpendicular distance (see Materials and methods) between individual LP IgA+ cells (n = 85 for GF; n = 971 for Col), IgD+ B220+ cells (n = 59 for GF; n = 108 for Col), and the serosal surface from GF (n = 4) and colonized SW littermates (Col, n = 4) described as in A. (D) Representative photomicrographs of small intestinal sections stained as in A from SPF SW mice at the age of postnatal day 21 (n = 3), 42 (n = 3), and 120 (n = 3). Negative control µMT mice (n = 2) are also shown. White arrows indicate IgD+ B220+ cells. Bars, 60 µm. Photomicrographs are representative images from one of three independent experiments for each time point and two independent experiments for µMT mice. (E) Dot plot showing the number of IgA+ cells and IgD+ B220+ cells per high power field (200×) from SPF SW mice and µMT mice described as in D. (F) Dot plots showing the perpendicular distance (see Materials and methods) between individual LP IgA+ cells (n = 13 for SPF SW day 21; 10 fields/mouse; n = 261 cells for SPF SW day 42, 10 fields/mouse; n = 482 cells for SPF SW day 120, 8 fields/mouse), IgD+ B220+ cells (n = 14 for SPF SW day 21, 10 fields/mouse; n = 34 cells for SPF SW day 42, 10 fields/mouse; n = 30 cells for SPF day 120, 8 fields/mouse) and the serosal surface from SPF SW mice described as in D. Two tailed t test. Error bars indicate ± SEM. *, P < 0.05; **, P < 0.01; ***, P < 0.0005; ****, P < 0.0001. ns, not significant. GF SW mice were conventionalized by cohousing with SPF mice for 21 d beginning at the age of postnatal day 21.
Figure 4.
Figure 4.
Clonal complexity and overall VH gene segment usage in splenic T1 (T1), splenic follicular (FO), and LP B cells of GF versus conventionalized mice. (A) Tree maps showing the Ig VH gene segment usage for the sorted splenic transitional 1, splenic follicular, and intestinal LP B cells from GF and littermates cohoused with the SPF mice for 7 or 21 d. Each block represents combined data from all the mice under the same indicated condition (n = 5–12). Unique colors were assigned to each VH gene segment. The separated individual areas (segments) within each colored box refers to the size of individual clones bearing unique CDR3 regions within the VH usage pool. The following markers defined T1 cells: DAPI CD19+ B220low IgM+ CD93+ CD23; splenic FO B cells: DAPI CD19+ B220+ IgM+ CD93 CD95 CD43 CD23+ CD21int; and LP B cells: DAPI CD19+ B220+ IgM+ CD93 CD95 GL7 CD23+. (B and C) Box plots showing the Shannon diversities of VH gene segment usage (B) and CDR3 (C) for the sequences shown in A for splenic T1, splenic FO, and LP B cells from GF and colonized (Col) SW littermates. Data are from four and five independent experiments for 7- and 21-d conventionalization experiments, respectively. Conventionalization was initiated at postnatal age day 21.
Figure 5.
Figure 5.
Normalized accumulated VH gene segment frequencies in splenic T1, splenic follicular (FO), and LP B cells of GF versus conventionalized mice. (A–F) Bar graphs showing normalized accumulated frequencies of VH gene segment usage in sorted splenic follicular (A and B), splenic T1 (C and D), and intestinal LP (E and F) B cells of GF (solid bars; n = 5–12) versus conventionalized (open bars; n = 5–12) SW mice. Conventionalization was initiated in GF SW mice at postnatal day 21 and lasted for 7 or 21 d. The markers for sorting the splenic FO, splenic T1, and LP B cells were described in Fig. 4. Data are from four and five independent experiments for 7- and 21-d conventionalization periods, respectively. For each bar graph, the frequency of each VH gene segment usage was calculated by dividing the total counts of the sequences aligned with the VH gene segment by the total counts of the sequences in the indicated conditions. The VH gene segments are not depicted if the overall usage frequencies in all the B cell subsets (T1, SpL FO, and LP) added together was less than 0.001. The VH segments (n = 90) on the x axis are aligned based on their location on chromosome arrangement from distal (left) to the most proximal (right). The individual sequencing libraries (generated from one mouse in the indicated condition) counted in the frequency were assigned with different colors in the bar graphs. The same color shown in the solid bar and the open bar in the same bar graph indicated the libraries were generated from littermates. The length of each color segment shown in the bars indicates the proportion of individual sequencing libraries contributing to the total frequency. The two blue-colored segments shown in B are generated from two technical sequencing repeats from the same library. For each bar graph, the clonal expansion (CE)–included sequences and the CE-excluded sequences were plotted on the top and the bottom, respectively. Jensen-Shannon divergences (JSDs) were calculated and p-values were assigned against permutation tests of libraries under comparison.
Figure 6.
Figure 6.
Microbial symbionts influence VH usage frequencies. (A–C) Overlay of line graphs indicating differences in VH segment usage frequencies between colonized (Col) and GF littermates (Col–GF) in the SpL follicular (FO) B cells (A), SpL transitional 1 (T1) B cells (B), and small intestinal lamina propria (LP) B cells (C) sorted from GF (n = 5–12) mice and that of conventionalized littermates (Col; n = 5–12). Conventionalization of GF mice was initiated at postnatal age day 21 for 7 or 21 d. (D) Overlay of the line graphs showing Col–GF subtraction plots of VH frequencies in sorted SpL FO B cells and SpL T1 cells. The markers for sorting the splenic FO, splenic T1, and LP B cells were described in Fig. 4. The correlation coefficient (R) between the two lines in each graph and its p-value are shown. The frequencies of VH segment usage were calculated as described in Fig. 5. The order of VH genes (n = 90) shown on the x axis is the same as that shown in Fig. 5. Data are from four and five independent experiments for 7- and 21-d conventionalization experiments, respectively. Only unique CDR3s were included in the subtraction plot analysis. (E) Bar plot showing the frequency of VH gene segments amplified from single cultured splenic B cells sorted from GF and conventionalized SW littermates. The cells for VH gene segment amplification were selected based on the reactivity of their secreted IgM toward cultured intestinal bacteria. 74 IgH sequences were amplified from bacteria-reactive single cultured cells sorted from GF (n = 7 and 37 sequences) and colonized SW littermates (n = 7 and 37 sequences). 102 IgH sequences were amplified from bacteria nonreactive single cultured cells sorted from GF (n = 7 mice and 40 sequences) and colonized SW littermates (n = 7 mice and 62 sequences). P-value calculated from the χ2 test. (F) Dot plot showing mismatch frequencies (compared with the germline reference sequences in IMGT) in the frame work regions 1, 2, and 3 (FWR) and the complementarity-determining regions 1 and 2 (CDR) in the sequences isolated from bacteria nonreactive single cultured splenic B cells of GF (n = 40) and bacteria-reactive single cultured splenic B cells of colonized (Col; n = 37) littermates which were cohoused with the SPF mice for 21 d beginning at the age of postnatal day 21. Two-tailed t test indicated no significant change. ns, not significant. Data are from five independent experiments.
Figure 7.
Figure 7.
Microbial symbionts regulate bacteria reactivity in the primary Ig repertoire in a T cell–independent manner. (A–C) Bar graphs showing the total number of live CD4+ T cells (A), GC B cells (DAPI CD19+ B220+ GL7+ CD95+; B), and total B cells (DAPI CD19+ B220+; C) in the indicated tissues from GF (blue; n = 14), isotype Ab–injected (red; n = 16), and anti-CD4 Ab–injected (green; n = 16) littermates colonized for 14 or 21 d. Data are from five independent experiments. *, P < 0.05; **, P < 0.01; ***, P < 0.0005; ****, P < 0.0001, multiple t test. Error bars indicate ± SEM. (D–M) LDA line graphs (D, G, J, and M), and fold-change bar graphs (E, F, H, I, K, L, N, and O) showing comparisons of frequencies of bacteria-reactive IgM (D–F and J–L) and total IgM-producing B cells (G–I and M–O) of the indicated sorted cell populations from GF mice (n = 4–8) or mice colonized with SPF microbiota treated with an isotype control Ab (n = 4–9) or a CD4 T cell-depleting anti-CD4 Ab (n = 3–9). Splenic B cells were sorted based on a DAPI B220+ GL7 CD95 phenotype. Splenic follicular (FO) B cells were sorted based on the DAPI B220+ CD93 GL7 CD95 CD43 CD23+ CD21int phenotype. Dots indicate individual mice. Data are from two to three independent experiments. P-values were calculated using the one-sample t test. The dashed line in the bar graphs indicates the null hypothesis. All colonization experiments were initiated at postnatal day 21 for 21 d. Numbers in graphs indicate mean frequencies (D, G, J, and M). Numbers in parenthesis (D, G, J, and M) indicate 95% confidence intervals (CI). Dotted arrows indicate the minimum number of cells required to achieve bacteria-reactive IgM (D and J) or IgM production (G and M). Error bars indicate ± 95% CI (D, G, J, and M) or ± SEM (E, F, H, I, K, L, N, and O). *, P < 0.05; **, P < 0.01; ***, P < 0.0005; ****, P < 0.0001. ns, not significant.
Figure 8.
Figure 8.
Symbiotic microbes can prime naive B cells toward enriched bacteria-reactive IgA. (A) Schematic of the adoptive transfer procedure. (B, C, and E) Total normalized IgA isolated from lumens of indicated intestinal sections from recipient SPF Rag2−/− mice (left) and its reactivity to bacteria cultured from intestine (right) measured by ELISA 28 d after splenic B220+ (B), CD43 (C), or sorted B2 cells (E) were transferred from GF SW mice (n = 4–9) or littermates conventionalized with SPF microbiota from the age of postnatal day 21 for 21 d (Col; n = 4–9). *, P < 0.05; **, P < 0.01; ***, P < 0.0005, two-tailed t test. Data are from two to three independent experiments. (D) FACS plots of the sorting strategy and the purity of sorted B2 (DAPI B220+ CD43 CD11b GL7 CD95 CD21+) cells.
Figure 9.
Figure 9.
Symbiotic microbes prime naive B cells toward higher systemic immune response against bacteria. (A–D) LDA line graphs (A and C) and fold-change bar graphs (B and D) of DAPI B220+ cells sorted from the SpL (n = 10) and PerC (n = 5) of GF and colonized (Col) C57BL/6J littermates for IgM reactivity to intestinal bacteria (A and B) or total IgM (C and D). Data are from two to three independent experiments. (E–H) LDA line graphs (E and F) and fold-change bar graphs (G and H) of splenic follicular (FO) B cells (DAPI B220+ CD93 CD95 GL7 CD43 CD23+ CD21int) sorted from SpLs of GF (n = 5) and colonized C57BL/6 littermates (Col; n = 5) for IgM reactivity to intestinal bacteria (E and F) or total IgM (G and H). Data are from two independent experiments. P-values calculated using the one-sample t test. (I) Schematic of the adoptive transfer and immunization procedure. (J) FACS plots of the purity and composition of the purified B cells for adoptive transfer. The plots shown are representative of three independent adoptive transfer experiments. (K–N) ELISA data showing antibacterial IgG (K) and IgM (L) or total IgG (K) and IgM (L) from intestinal bacteria-immunized SPF μMT that received splenic B220+ B cells from GF C57BL/6J (n = 8–12) or colonized littermates (Col; n = 6–9). Control experiments using OVA immunization and anti-OVA Ab were also performed in parallel (M and N). Each dot represents an individual mouse from two to three independent adoptive transfer experiments for bacteria or OVA immunization experiments, respectively. P-values calculated using the two-tailed t test. The dashed line in the bar graphs indicates the null hypothesis. In the LDA experiments, numbers in graphs (A, C, E, and G) indicate mean frequencies. Numbers in parenthesis (A, C, E, and G) indicate the 95% confidence interval (CI). Dotted arrows indicate the minimum number of cells required to produce bacteria-reactive IgM (A and E) or IgM production (C and G). Error bars indicate ± 95% CI (A, C, E, and G) or ± SEM (B, D, F, H, and K–N). *, P < 0.05; ***, P < 0.001. Conventionalized GF C57BL/6J mice were cohoused with the SPF mice for 21 d beginning at the age of postnatal day 21 to 25.

References

    1. Anderson S.M., Tomayko M.M., Ahuja A., Haberman A.M., and Shlomchik M.J.. 2007. New markers for murine memory B cells that define mutated and unmutated subsets. J. Exp. Med. 204:2103–2114. 10.1084/jem.20062571 - DOI - PMC - PubMed
    1. Arnold L.W., Pennell C.A., McCray S.K., and Clarke S.H.. 1994. Development of B-1 cells: segregation of phosphatidyl choline-specific B cells to the B-1 population occurs after immunoglobulin gene expression. J. Exp. Med. 179:1585–1595. 10.1084/jem.179.5.1585 - DOI - PMC - PubMed
    1. Baumgarth N. 2010. The double life of a B-1 cell: self-reactivity selects for protective effector functions. Nat. Rev. Immunol. 11:34–46. 10.1038/nri2901 - DOI - PubMed
    1. Bunker J.J., Flynn T.M., Koval J.C., Shaw D.G., Meisel M., McDonald B.D., Ishizuka I.E., Dent A.L., Wilson P.C., Jabri B., et al. 2015. Innate and Adaptive Humoral Responses Coat Distinct Commensal Bacteria with Immunoglobulin A. Immunity. 43:541–553. 10.1016/j.immuni.2015.08.007 - DOI - PMC - PubMed
    1. Bunker J.J., Erickson S.A., Flynn T.M., Henry C., Koval J.C., Meisel M., Jabri B., Antonopoulos D.A., Wilson P.C., and Bendelac A.. 2017. Natural polyreactive IgA antibodies coat the intestinal microbiota. Science. 358:eaan6619 10.1126/science.aan6619 - DOI - PMC - PubMed

Publication types

Substances

Associated data