. 2018 May;28(5):714-725.
doi: 10.1101/gr.231472.117. Epub 2018 Mar 27.

Double insertion of transposable elements provides a substrate for the evolution of satellite DNA

Affiliations

Double insertion of transposable elements provides a substrate for the evolution of satellite DNA

Michael P McGurk et al. Genome Res. 2018 May.

Abstract

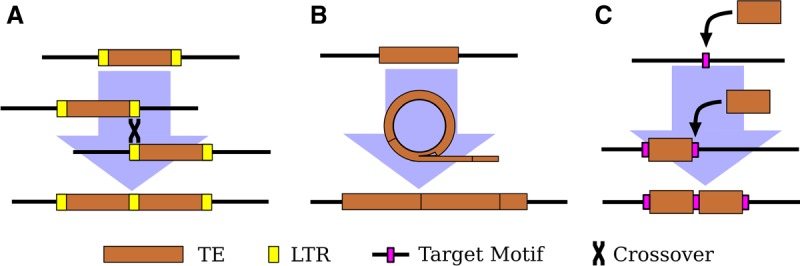
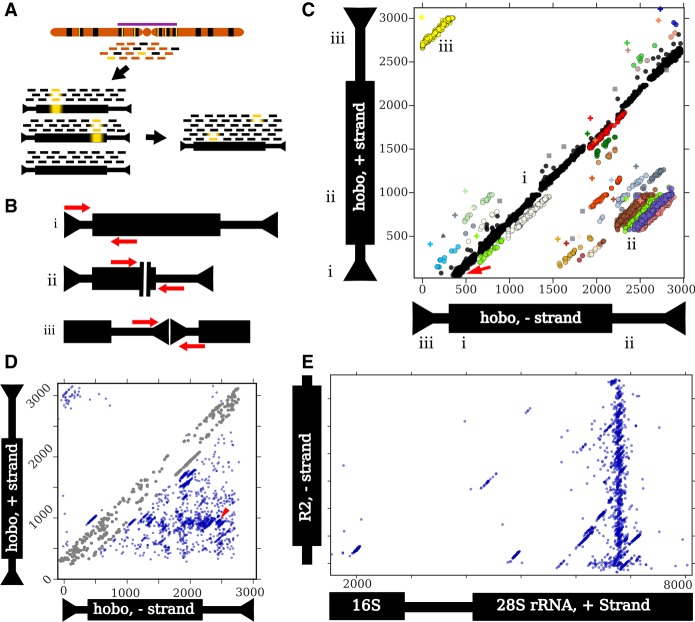
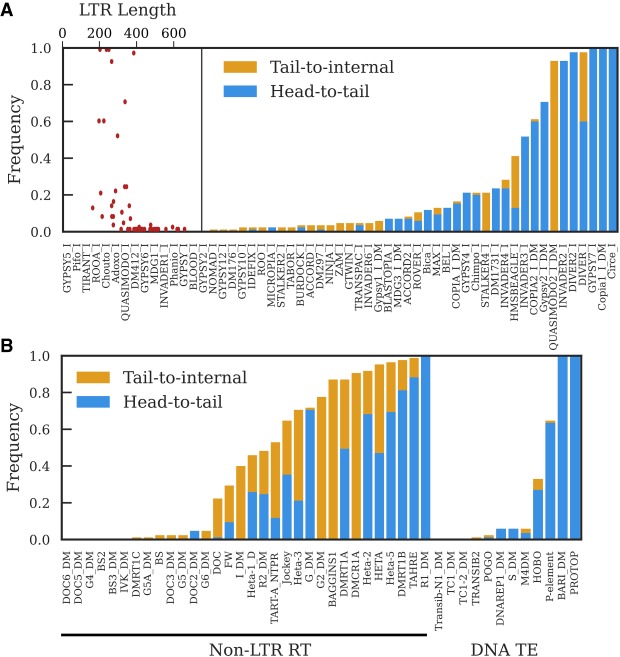
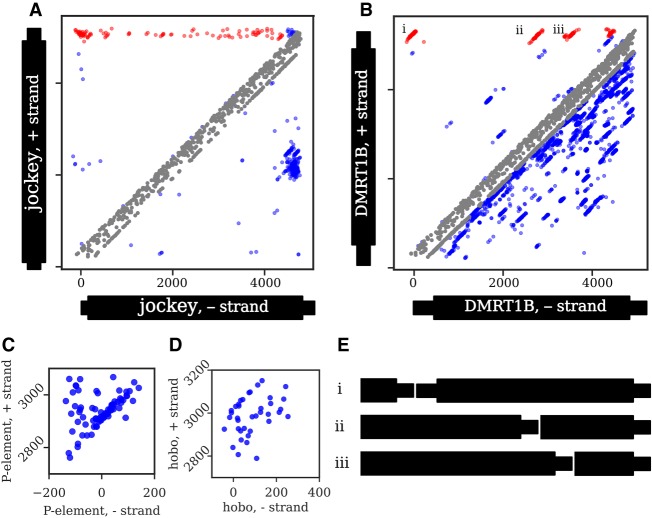
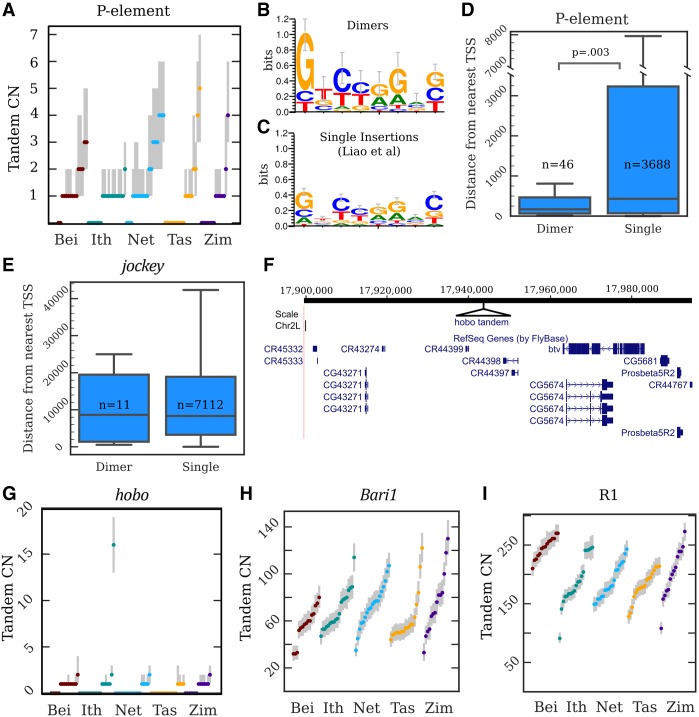
Eukaryotic genomes are replete with repeated sequences in the form of transposable elements (TEs) dispersed across the genome or as satellite arrays, large stretches of tandemly repeated sequences. Many satellites clearly originated as TEs, but it is unclear how mobile genetic parasites can transform into megabase-sized tandem arrays. Comprehensive population genomic sampling is needed to determine the frequency and generative mechanisms of tandem TEs, at all stages from their initial formation to their subsequent expansion and maintenance as satellites. The best available population resources, short-read DNA sequences, are often considered to be of limited utility for analyzing repetitive DNA due to the challenge of mapping individual repeats to unique genomic locations. Here we develop a new pipeline called ConTExt that demonstrates that paired-end Illumina data can be successfully leveraged to identify a wide range of structural variation within repetitive sequence, including tandem elements. By analyzing 85 genomes from five populations of Drosophila melanogaster, we discover that TEs commonly form tandem dimers. Our results further suggest that insertion site preference is the major mechanism by which dimers arise and that, consequently, dimers form rapidly during periods of active transposition. This abundance of TE dimers has the potential to provide source material for future expansion into satellite arrays, and we discover one such copy number expansion of the DNA transposon hobo to approximately 16 tandem copies in a single line. The very process that defines TEs-transposition-thus regularly generates sequences from which new satellites can arise.


Figures

Figure 1.
Figure 1.
Three mechanisms of tandem TE formation. (A) Ectopic recombination between long-terminal repeats (LTRs; shown in yellow) generates tandem LTR retrotransposons with shared LTRs. (B) Circularization and rolling circle replication of a TE, followed by insertion of the resulting concatemer. The possible mechanism(s) of circularization remains unclear. (C) Two insertions of a TE at the same target site (shown in magenta). Note the preservation of the target site within the tandem junction.
Figure 2.
Figure 2.
An outline of the ConTExt pipeline and examples of identified structures. Thin and thick bars of repeats represent noncoding and coding sequences, respectively. (A) Reads are derived from genomic DNA, with many copies of a particular repeat family (black) dispersed among single-copy sequence (orange); some repeat copies have polymorphisms relative to the consensus (yellow bars), especially those in heterochromatin (purple bar). The reads are aligned to individual repeats identified in the reference genome, including divergent elements; three examples are shown. Alignments to these individual elements are then collapsed onto a consensus sequence for that repeat family. Inverted arrowheads indicate short terminal inverted repeats (TIRs) that are common to many DNA transposons. (B) Schematics of paired-end reads spanning sequence concordant with the consensus (i), the junction of an internal deletion (ii), and the junction of a head-to-tail tandem (iii). (C) A two-dimensional scatterplot of paired-end alignments from strain I03 to the hobo element. Each dot represents a single read pair. Its position on the x- and y-axes corresponds to the 3′ ends of the reads aligning to the minus and plus strands of the hobo consensus, respectively. For example, the red arrow indicates a read pair where the 5′ end of the forward read aligns to the beginning of the consensus (as in panel B,i). Both reads are 70 bp and the gap is 330 bp, so the corresponding dot is located at position 70 on the y-axis (the location of the 3′ end of the forward read) and at position 400 on the x-axis (70 + 330). The Roman numerals indicate how the three types of structures shown in B correspond to patterns in the scatter plot and where the reads map on each of the axes. (i) Concordant reads (black dots) that form the main diagonal. (ii) Reads spanning internal deletions. (iii) Reads spanning head-to-tail tandem junctions. The nonblack colors correspond to nonconcordant clusters identified by the EM algorithm, and gray squares are potential artifacts. The plus symbols are the estimated junction for the cluster with the corresponding color. Note that some colors are used twice to indicate distinct widely separated clusters. Read pairs where both ends map to the same strand (e.g., head-to-head tandems) require a different scatterplot to detect. (D) A scatter plot of all junctions involving hobo across all GDL strains. Each dot represents a junction estimated from a cluster in a specific strain (the plus symbols in C). The red arrowhead indicates the location of the deletion identified previously in the Th hobo variant (Periquet et al. 1994). At some rate, concordant read pairs are misclassified as discordant and may generate spurious junctions along the main diagonal; we excluded these from the analysis (see Methods, “Categorizing Tandem Junctions”) and colored these junctions in gray. (E) A scatter plot depicting all junctions across all GDL strains between the minus-strand of the R2 retrotransposon and the plus-strand of rDNA. The thick black bar on the rDNA schematic represents the transcribed rRNAs. The first ∼1500 bp of the rDNA cistron is not shown because only a few low-frequency R2 junctions are present there. The plot successfully identifies that most R2 insertions occur at the same position in the 28S rDNA subunit, as previously demonstrated (Kojima and Fujiwara 2005; Stage and Eickbush 2009).
Figure 3.
Figure 3.
The proportion of GDL strains in which a tandem junction was identified for LTR retrotransposon families (A) and non-LTR retrotransposon families and DNA transposon families (B). Head-to-tail tandems have junctions involving the first and last 200 nt of the consensus sequence. Tail-to-internal junctions have junctions between the last 200 nt of the consensus sequence and internal sequence; these are consistent with tandems involving 5′-truncated elements, though they can also be formed by nested insertions. We do not depict the frequency of internal-to-internal tandems because they are present in most strains, but generally at low copy number; Supplemental Figure S5 provides a more informative visualization of internal-to-internal tandem variation. A does not include LTR–LTR junctions shown in Supplemental Table S2. The scatter plot inset in A depicts the relationship between LTR length and the frequency of detecting head-to-tail tandems for each LTR retrotransposon family.
Figure 4.
Figure 4.
Junction distributions from all strains in the GDL for two non-LTR retrotransposons (A,B) and two DNA transposons (C,D). Note that C and D only show head-to-tail tandem distributions, and thus, the axes only include the terminal regions. Each dot represents a junction identified from a single strain. A junction present in multiple strains will generate a diagonal distribution around the true coordinate due to estimation errors. In A and B, head-to-tail and tail-to-internal tandem junctions are highlighted in red, internal-to-internal tandems and deletions are colored in blue, and probable artifacts are colored in gray (see Methods, “Categorizing Tandem Junctions”); all junctions in C and D are head-to-tail. The distribution of tandem junctions of jockey (A) are dispersed, with few distinct diagonal clusters, indicating that most individual tandem junctions are low-frequency. In contrast, the four distinct diagonal clusters of DMRT1B (B) indicate junctions at moderate to high population frequency, suggesting that they represent older tandems. While not the focus of our analysis, internal deletions ranging from low to high frequency are also evident in both A and B as junctions below the main diagonal, with several distinct deletion variants of jockey sharing similar sequence coordinates and with many distinct deletions identifiable in DMRT1B. (C) For the P-element, most junctions fall within a single tight diagonal cluster, consistent with their representing tandem P-elements separated by an 8-bp target site duplication. Several junctions are dispersed above this cluster, consistent with additional sequence of variable length within the junction. (D) In contrast, only a few hobo junctions form a tight diagonal cluster, while most are dispersed below the cluster, consistent with small internal deletions spanning most of the tandem junctions. (E) Schematics of the head-to-tail and tail-to-internal DMRT1B tandems denoted with iiii in B.
Figure 5.
Figure 5.
Copy number, location, and sequence of TE tandem junctions. (A) Copy number (CN) distributions for the P-element. The dots are maximum a posteriori estimates in a particular strain, while the gray lines indicate 98%-credible intervals. (B,C) Sequence logos constructed from the 8-nt motifs found within the junctions of P-element tandem dimers (B) and the P-element TSDs described by Liao et al. (2000) (C). (D) A boxplot depicting the distances to the nearest TSS for P-element dimers and single insertions. (N) Counts of insertions in each category; (p) Kolmogorov–Smirnov test. (E) A similar plot for jockey elements; there is no significant difference between singles and dimers. (F) A UCSC Genome Browser view of the region on Chromosome 2L inferred to contain the hobo tandem array in strain I03, with the site of the hobo tandem added in as a black triangle. (GI) CN distributions for hobo (G), Bari1 (H) and R1 (I) tandems. The dots are maximum a posteriori estimates in a particular strain, while the gray lines indicate 98%-credible intervals.

References

    1. Aldrup-MacDonald ME, Kuo ME, Sullivan LL, Chew K, Sullivan BA. 2016. Genomic variation within alpha satellite DNA influences centromere location on human chromosomes with metastable epialleles. Genome Res. 26: 1301–1311. - PMC - PubMed
    1. Bao W, Kojima KK, Kohany O. 2015. Repbase update, a database of repetitive elements in eukaryotic genomes. Mob DNA 6: 11. - PMC - PubMed
    1. Bashir A, Volik S, Collins C, Bafna V, Raphael BJ. 2008. Evaluation of paired-end sequencing strategies for detection of genome rearrangements in cancer. PLoS Comput Biol 4: e1000051. - PMC - PubMed
    1. Bergman CM, Quesneville H, Anxolabéhère D, Ashburner M. 2006. Recurrent insertion and duplication generate networks of transposable element sequences in the Drosophila melanogaster genome. Genome Biol. 7: R112. - PMC - PubMed
    1. Bingham PM, Kidwell MG, Rubin GM. 1982. The molecular basis of P–M hybrid dysgenesis: the role of the P element, a P-strain-specific transposon family. Cell 29: 995–1004. - PubMed

Publication types

LinkOut - more resources