. 2018 May 4;8(5):1755-1769.
doi: 10.1534/g3.117.300512.

Distinguishing Among Evolutionary Forces Acting on Genome-Wide Base Composition: Computer Simulation Analysis of Approximate Methods for Inferring Site Frequency Spectra of Derived Mutations

Affiliations

Distinguishing Among Evolutionary Forces Acting on Genome-Wide Base Composition: Computer Simulation Analysis of Approximate Methods for Inferring Site Frequency Spectra of Derived Mutations

Tomotaka Matsumoto et al. G3 (Bethesda). .

Abstract

Inferred ancestral nucleotide states are increasingly employed in analyses of within- and between -species genome variation. Although numerous studies have focused on ancestral inference among distantly related lineages, approaches to infer ancestral states in polymorphism data have received less attention. Recently developed approaches that employ complex transition matrices allow us to infer ancestral nucleotide sequence in various evolutionary scenarios of base composition. However, the requirement of a single gene tree to calculate a likelihood is an important limitation for conducting ancestral inference using within-species variation in recombining genomes. To resolve this problem, and to extend the applicability of ancestral inference in studies of base composition evolution, we first evaluate three previously proposed methods to infer ancestral nucleotide sequences among within- and between-species sequence variation data. The methods employ a single allele, bifurcating tree, or a star tree for within-species variation data. Using simulated nucleotide sequences, we employ ancestral inference to infer fixations and polymorphisms. We find that all three methods show biased inference. We modify the bifurcating tree method to include weights to adjust for an expected site frequency spectrum, "bifurcating tree with weighting" (BTW). Our simulation analysis show that the BTW method can substantially improve the reliability and robustness of ancestral inference in a range of scenarios that include non-neutral and/or non-stationary base composition evolution.

Keywords: GC content; ancestral reconstruction; codon usage; nucleotide substitution; unfolded site frequency spectrum.


Figures

Figure 1
Figure 1
Phylogenetic relationships and evolutionary scenarios used to generate simulated sequences. Tree is a simplified depiction of relationships among six D. melanogaster subgroup species (Ko et al. 2003). Two selection schemes, stationary and fixation bias change scenarios were considered in the simulations. Lineage-specific selection intensities are expressed by different line-formatting in the phylogeny.
Figure 2
Figure 2
Process for creating input data for bifurcating tree (BT) ancestral inference. (A) The process to make two “collapse-pair” sequences in the BT method. (B) phylogeny used in the BT method. Node names are from Figure 1. x’ shows the MRCA of population (species) x. x1 and x2 are collapse-pair sequences.
Figure 3
Figure 3
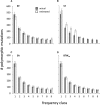
Actual vs. estimated numbers of polymorphic pu mutations for each frequency class. Results for four inference methods: BT, ST, SA and BTWne are shown. The legends applies across graphs. The simulation assumed stationary evolution with GC0 = 0.5 and results are shown for the m population. Population sampling and following ancestral inference were replicated 100 times. The figures show the average and the 95% confidence interval among the replicates. The scales of unlabeled axes are shared across graphs in the same columns and in the same rows. This standard applies to all following figures.
Figure 4
Figure 4
Performance of ancestral inference methods for estimating the SFS of polymorphic mutations in stationary GC content scenarios. χ2goodness of fit statistics were calculated using actual vs. estimated numbers of polymorphic mutations for each mutation category. In each frequency class, the proportions of actual polymorphic mutations were used to calculate “expected” values to compare to the inferred numbers of polymorphisms (“observed” values). χ2 statistics were calculated for each replicate with these expected and observed values. The gray scales and cell values give the numbers of replicates showing “poor” fits between observed and expected values (χ2 ≥ 13.0) and “good” fits (χ2 ≤ 3.5). Low and high χ2 cutoffs correspond to P ≥ 0.9 and ≤ 0.1 for χ2 goodness of fit tests with the degree of freedom = 8. Note that χ2 values strongly depend on the number of polymorphic mutations; results are comparable among different methods for the same simulation scenario and mutation category, but are only comparable among different scenarios or mutation categories if their sample sizes are similar. The numbers of polymorphic mutations in each scenario and mutation category are shown in Table S1. The SFS of the m population was estimated under four inference methods: BT, ST, SA and BTWne. The simulation assumed stationary evolution with GC0 = 0.5 and 0.7. Population sampling and ancestral inference were replicated 100 times.
Figure 5
Figure 5
Actual vs. estimated numbers of fixations under four ancestral inference methods. Results are for fixations in the ms-m’ lineage (ms-m lineage in SA). Among actual fixations, parallel fixations of ancestral polymorphism (PFAP) in the ms-m’ and ms-s’ lineages are shown separately from non-PFAP fixations (actualfPFAP). The legend applies to both graphs. The simulation assumed stationary scenario with (A) GC0 = 0.5 and (B) 0.7. Population sampling and ancestral inference were replicated 100 times. Averages and 95% confidence interval of counts among the replicates are shown. Note that y-axis values do not start at zero.
Figure 6
Figure 6
Performance of the BTWne methods for estimating the SFS of polymorphic mutations in non-stationary GC content scenarios. χ2 goodness of fit statistics were calculated using actual vs. estimated numbers of polymorphic mutations for each mutation category. The gray scale and cell values give the numbers of replicates showing “poor” and “good” fits between observed and expected values. The procedure of χ2 calculation and the meaning of the gray scale and the number inside each cell are described in the Figure 4 legend. The numbers of polymorphic mutations in each scenario and mutation category is shown in Table S2. The SFS of the focused population was estimated under the BTWne method. The simulation assumed fixation bias change scenario with GC0 = 0.7 and four demographic change scenarios, demA, demB, demE and demF. Population sampling and ancestral inference were replicated 100 times.
Figure 7
Figure 7
Performance of the iterative BTWest method for estimating the SFS of polymorphic mutations in non-stationary GC content scenarios. SFS of the t population in fixation bias change scenario with GC0 = 0.9 and m population in demB and demF were estimated under the iterative BTWest method, and χ2 goodness of fit statistics were calculated using actual vs. estimated numbers of polymorphic mutations for each mutation category. The procedure for χ2 calculation is described in the Figure 4 legend. This figure shows results for a single replicate that showed relatively large χ2 value in the BTWne analysis. The estimation under iterative BTWest was repeated for six rounds (the first round was BTWne and the following five were BTWest using the estimated SFS of the previous round). The cell values show the calculated χ2 value and the shaded cell means that the χ2 ≤ 3.5 which is the criteria of low χ2 value. The results of all 100 replicates for demB and demF are shown in Table S5.

Similar articles

Cited by

References

    1. Akashi H., 1995. Inferring weak selection from patterns of polymorphism and divergence at “silent” sites in Drosophila DNA. Genetics 139: 1067–1076. - PMC - PubMed
    1. Akashi H., 1996. Molecular evolution between Drosophila melanogaster and D. simulans: reduced codon bias, faster rates of amino acid substitution, and larger proteins in D. melanogaster. Genetics 144: 1297–1307. - PMC - PubMed
    1. Akashi H., 1999. Within- and between-species DNA sequence variation and the “footprint” of natural selection. Gene 238(1): 39–51. 10.1016/S0378-1119(99)00294-2 - DOI - PubMed
    1. Akashi H., Schaeffer S. W., 1997. Natural selection and the frequency distributions of “silent” DNA polymorphism in Drosophila. Genetics 146: 295–307. - PMC - PubMed
    1. Akashi H., Goel P., John A., 2007. Ancestral inference and the study of codon bias evolution: implications for molecular evolutionary analyses of the Drosophila melanogaster subgroup. PLoS One 2: e1065 10.1371/journal.pone.0001065 - DOI - PMC - PubMed

Publication types