

Allometry and Ecology of the Bilaterian Gut Microbiome
- PMID: 29588401
- PMCID: PMC5874926
- DOI: 10.1128/mBio.00319-18
Allometry and Ecology of the Bilaterian Gut Microbiome
Abstract
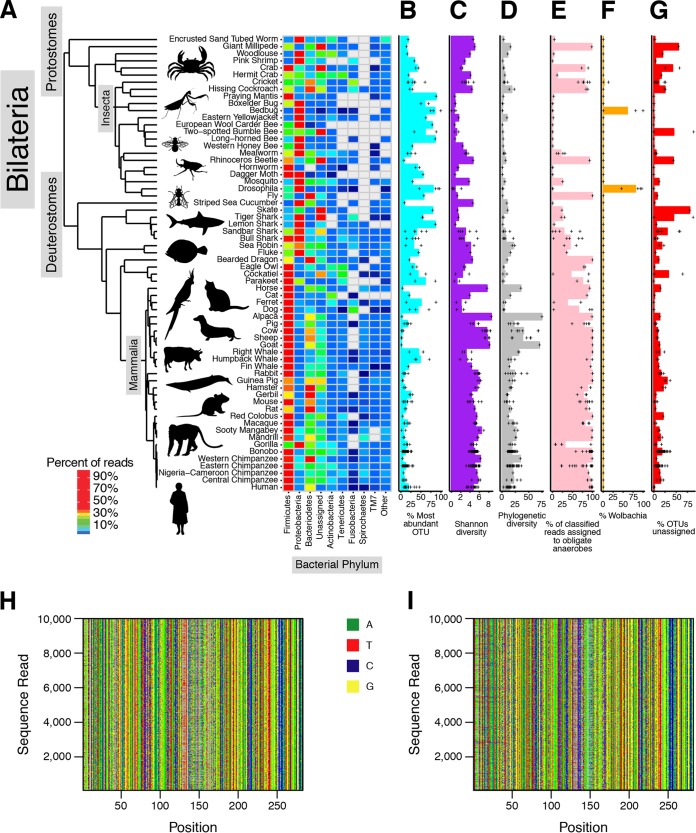
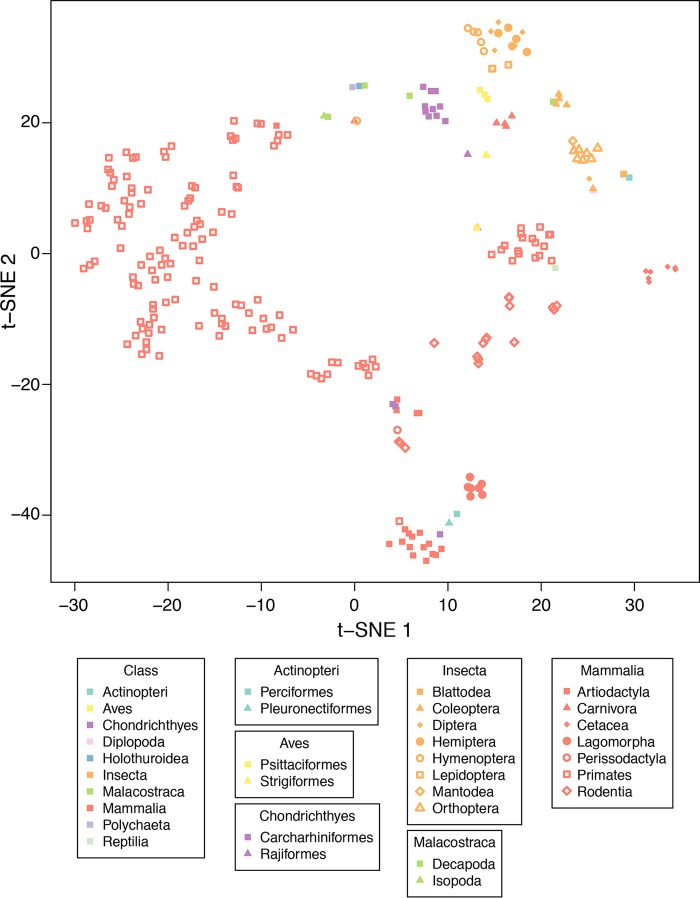
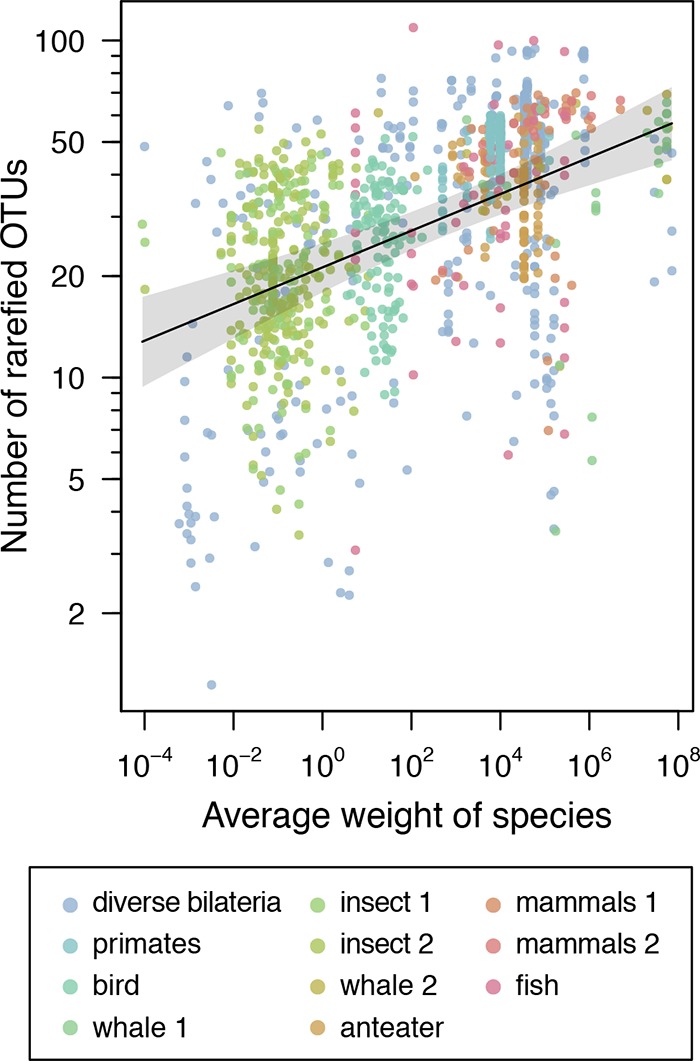
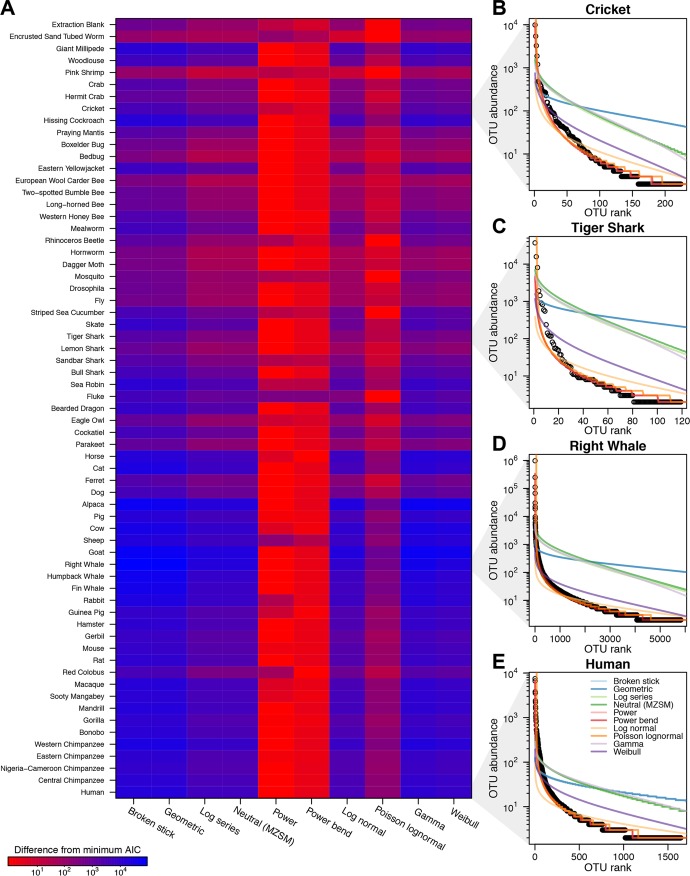
Classical ecology provides principles for construction and function of biological communities, but to what extent these apply to the animal-associated microbiota is just beginning to be assessed. Here, we investigated the influence of several well-known ecological principles on animal-associated microbiota by characterizing gut microbial specimens from bilaterally symmetrical animals (Bilateria) ranging from flies to whales. A rigorously vetted sample set containing 265 specimens from 64 species was assembled. Bacterial lineages were characterized by 16S rRNA gene sequencing. Previously published samples were also compared, allowing analysis of over 1,098 samples in total. A restricted number of bacterial phyla was found to account for the great majority of gut colonists. Gut microbial composition was associated with host phylogeny and diet. We identified numerous gut bacterial 16S rRNA gene sequences that diverged deeply from previously studied taxa, identifying opportunities to discover new bacterial types. The number of bacterial lineages per gut sample was positively associated with animal mass, paralleling known species-area relationships from island biogeography and implicating body size as a determinant of community stability and niche complexity. Samples from larger animals harbored greater numbers of anaerobic communities, specifying a mechanism for generating more-complex microbial environments. Predictions for species/abundance relationships from models of neutral colonization did not match the data set, pointing to alternative mechanisms such as selection of specific colonists by environmental niche. Taken together, the data suggest that niche complexity increases with gut size and that niche selection forces dominate gut community construction.IMPORTANCE The intestinal microbiome of animals is essential for health, contributing to digestion of foods, proper immune development, inhibition of pathogen colonization, and catabolism of xenobiotic compounds. How these communities assemble and persist is just beginning to be investigated. Here we interrogated a set of gut samples from a wide range of animals to investigate the roles of selection and random processes in microbial community construction. We show that the numbers of bacterial species increased with the weight of host organisms, paralleling findings from studies of island biogeography. Communities in larger organisms tended to be more anaerobic, suggesting one mechanism for niche diversification. Nonselective processes enable specific predictions for community structure, but our samples did not match the predictions of the neutral model. Thus, these findings highlight the importance of niche selection in community construction and suggest mechanisms of niche diversification.
Keywords: bacteria; bilateria; microbiome; microbiota; neutral model; species-area.
Copyright © 2018 Sherrill-Mix et al.
Figures
References
-
- Arrhenius O. 1921. Species and area. J Ecol 9:95–99. doi: 10.2307/2255763. - DOI
-
- Lomolino MV. 2000. Ecology’s most general, yet protean pattern: the species-area relationship. J Biogeogr 27:17–26. doi: 10.1046/j.1365-2699.2000.00377.x. - DOI
-
- McGuinness KA. 1984. Species-area curves. Biol Rev 59:423–440. doi: 10.1111/j.1469-185X.1984.tb00711.x. - DOI
Publication types
MeSH terms
Substances
Grants and funding
LinkOut - more resources
Full Text Sources
Other Literature Sources
