. 2018 Apr 10;115(15):E3351-E3360.
doi: 10.1073/pnas.1720542115. Epub 2018 Mar 27.

Successful reprogramming of cellular protein production through mRNA delivered by functionalized lipid nanoparticles

Affiliations

Successful reprogramming of cellular protein production through mRNA delivered by functionalized lipid nanoparticles

Marianna Yanez Arteta et al. Proc Natl Acad Sci U S A. .

Abstract

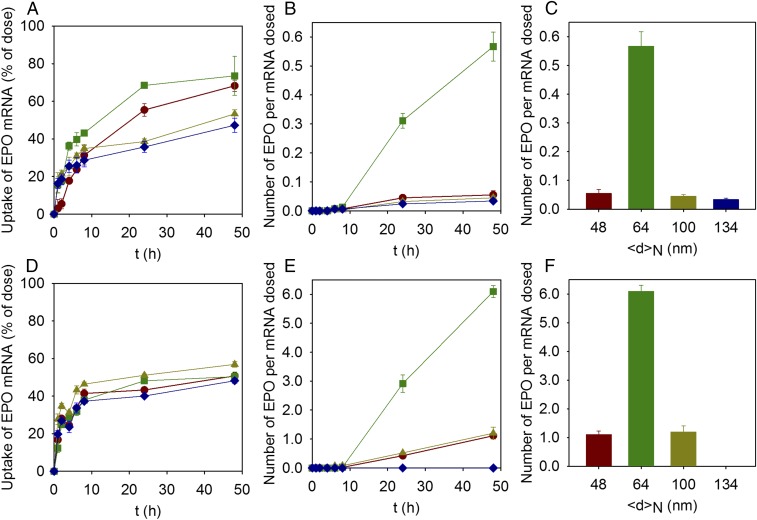
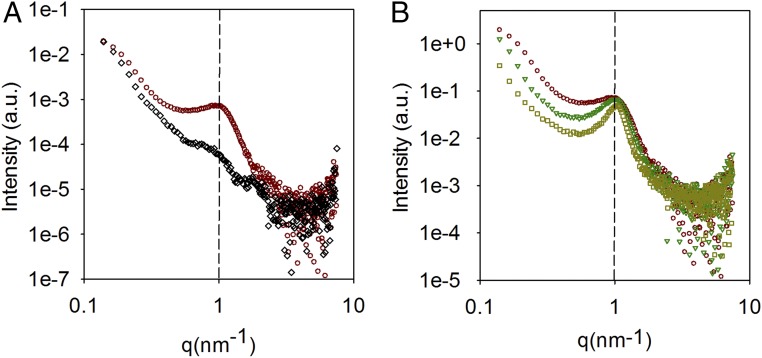
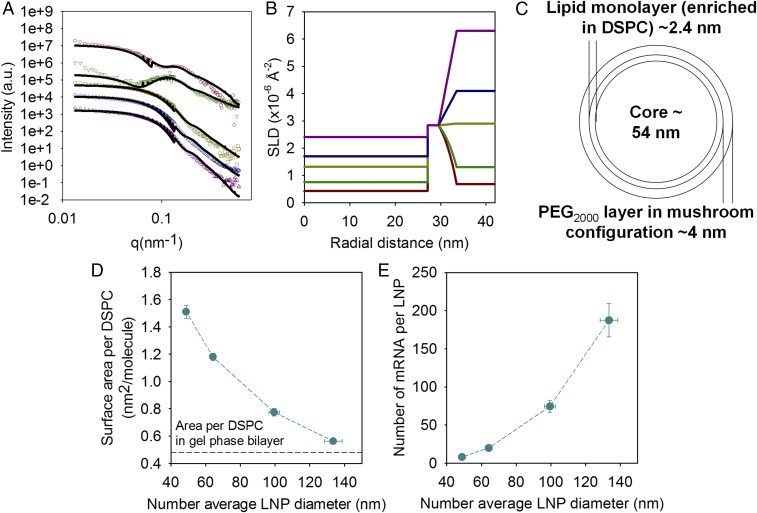
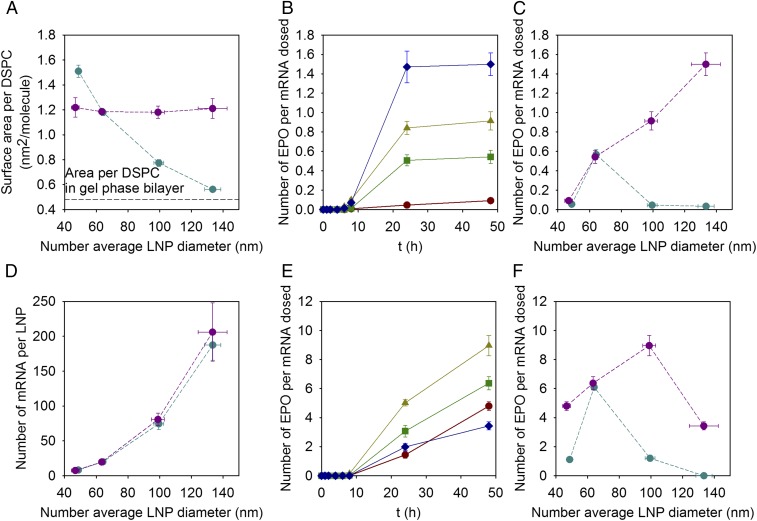
The development of safe and efficacious gene vectors has limited greatly the potential for therapeutic treatments based on messenger RNA (mRNA). Lipid nanoparticles (LNPs) formed by an ionizable cationic lipid (here DLin-MC3-DMA), helper lipids (distearoylphosphatidylcholine, DSPC, and cholesterol), and a poly(ethylene glycol) (PEG) lipid have been identified as very promising delivery vectors of short interfering RNA (siRNA) in different clinical phases; however, delivery of high-molecular weight RNA has been proven much more demanding. Herein we elucidate the structure of hEPO modified mRNA-containing LNPs of different sizes and show how structural differences affect transfection of human adipocytes and hepatocytes, two clinically relevant cell types. Employing small-angle scattering, we demonstrate that LNPs have a disordered inverse hexagonal internal structure with a characteristic distance around 6 nm in presence of mRNA, whereas LNPs containing no mRNA do not display this structure. Furthermore, using contrast variation small-angle neutron scattering, we show that one of the lipid components, DSPC, is localized mainly at the surface of mRNA-containing LNPs. By varying LNP size and surface composition we demonstrate that both size and structure have significant influence on intracellular protein production. As an example, in both human adipocytes and hepatocytes, protein expression levels for 130 nm LNPs can differ as much as 50-fold depending on their surface characteristics, likely due to a difference in the ability of LNP fusion with the early endosome membrane. We consider these discoveries to be fundamental and opening up new possibilities for rational design of synthetic nanoscopic vehicles for mRNA delivery.

Keywords: adipocytes; gene therapy; hEPO mRNA; hepatocytes; small-angle scattering.


Conflict of interest statement

Conflict of interest statement: M.Y.A., T.K., S.B., S.W., X.W., A.J.K, A.D., and L.L. are employed by AstraZeneca R&D Gothenburg.

Figures

Fig. 1.
Fig. 1.
Cellular uptake and cellular protein production for LNPs of different sizes prepared with the standard variation of size approach. (A and D) Uptake of LNPs expressed as the percent of hEPO mRNA dosed as a function of time in (A) adipocytes and (D) hepatocytes for LNPs with lipid molar compositions of DLin-MC3-DMA:DSPC:Chol:DMPE-PEG2000 in the ratio 50:10:40-X:X for X: 3% (<d>N = 48 nm; red circles), 1.5% (<d>N = 64 nm; green squares), 0.5% (<d>N = 100 nm; yellow triangles), and 0.25% (<d>N = 134 nm; blue diamonds). Lines are to guide the eye. (B and E) Number of hEPO produced per mRNA dosed as a function of time in (B) adipocytes and (E) hepatocytes for LNPs with the same lipid composition as A and D. Lines are to guide the eye. (C and F) Number of hEPO produced per mRNA dosed after 48 h of dosing (C) adipocytes and (F) hepatocytes for LNPs with the same lipid composition as A and D. The experiments were done in the presence of 1% human serum. Values are means ± SEM (n = 3).
Fig. 2.
Fig. 2.
Cryo-TEM characterization of the LNPs. (AC) Cryo-TEM images and (DF) size number distribution of LNPs with lipid molar compositions of DLin-MC3-DMA:DSPC:Chol:DMPE-PEG2000 in the ratio 50:10:40-X:X for X: (A and D) 3, (B and E) 1.5, and (C and F) 0.5. The size distribution corresponds to the DLS measurements (purple) and cryo-TEM image analysis (yellow).
Fig. 3.
Fig. 3.
SAXS characterization of LNPs. (A) Small-angle X-ray scattering data for LNPs without mRNA with lipid molar compositions of DLin-MC3-DMA:DSPC:Chol:DMPE-PEG2000 in the ratio 50:10:40-X:X for X: 1.5% (<d>N = 42 nm; black diamonds) and mRNA containing LNPs for X: 3% (<d>N = 48 nm; red circles). (B) Small-angle X-ray scattering data for mRNA containing LNPs for X: 3% (<d>N = 48 nm; red circles), 1.5% (<d>N = 64 nm; green triangles) and 0.5% (<d>N = 100 nm; yellow squares). The dashed black vertical line corresponds to the position of the structural peak.
Fig. 4.
Fig. 4.
Characterization of the lipid distribution within the LNPs, their surface composition, and number of mRNA per LNPs. (A) SANS data (symbols) for mRNA containing LNPs with a lipid molar compositions of DLin-MC3-DMA:DSPC:Chol:DMPE-PEG2000 in the ratio 50:10:38.5:1.5 with deuterated DSPC and Chol in 18% (red circles), 27% (green inverted triangles), 50% (yellow squares), 68% (blue diamonds), and 100% (purple triangles) D2O buffer. The solid lines correspond to the best fit using the multishell model with exponential decay. Only the data at low q are plotted, and the intensity of the samples in the upper curves has been offset for clarity. (B) Scattering length density (SLD) profiles as a function of the distance to the center of the LNPs corresponding to the fits of the data in A. (C) Schematic representation of the lipid distribution in the LNP according to the SLD radial profile. (D) Area per DSPC molecule and (E) number of mRNA per LNP as a function of the LNP size for LNPs with lipid molar compositions of DLin-MC3-DMA:DSPC:Chol:DMPE-PEG2000 in the ratio 50:10:40-X:X. The horizontal line in D corresponds to the reported value of the area per DSPC in the gel phase (26). Lines are to guide the eye. Values are means ± SEM (n = 3).
Fig. 5.
Fig. 5.
Core structure of the LNPs and cholesterol solubility. (A and B) SAXS data for DLin-MC3-DMA:Chol mixtures in 50:38.5 mol ratio in the presence of polyA (red curve) and absence (black curve), which have been dialyzed against (A) citrate buffer:ethanol 3:1 volume mixture and (B) PBS buffer. The dashed black vertical lines correspond to the position of the structural peaks, and the pink continuous lines correspond to cholesterol monohydrate crystals. For all of the SAXS data, the intensity of the samples in the upper curves has been offset for clarity. (C) Measured light scattering intensity as a function of the mole percentage of cholesterol for the addition of cholesterol nanocrystals to a DLin-MC3-DMA emulsion in citrate buffer:ethanol 3:1 volume mixture. The solid line is a fit to the data with high cholesterol content. The solubility is estimated from extrapolating the line to zero intensity. (D and E) TEM images for DLin-MC3-DMA:Chol mixtures in 50:38.5 mol ratio in the presence of polyA, which have been dialyzed against (D) citrate buffer:ethanol 3:1 volume mixture and (E) PBS buffer. Insets correspond to a higher magnification of the image. (F) Schematic representation of the proposed disordered inverse hexagonal phase inside the mRNA–LNPs core.
Fig. 6.
Fig. 6.
The surface composition and size of LNPs regulates cellular production. (A) Area per DSPC molecule and (D) number of mRNA per LNP as a function of the LNP size for LNPs with variable (blue) and constant (purple) surface composition. The horizontal line corresponds to the reported value of the area per DSPC in the gel phase (26). (B and E) Number of hEPO produced per mRNA dosed as a function of time in (B) adipocytes and (E) hepatocytes for LNPs with constant surface composition and different size: <d>N = 47 nm (red circles), <d>N = 64 nm (green squares), <d>N = 99 nm (yellow triangles), and <d>N = 133 nm (blue diamonds). (C and F) Number of hEPO expressed per mRNA dosed after 48 h of dosing (C) adipocytes and (F) hepatocytes for LNPs with variable (blue) and constant (purple) surface composition. Lines are to guide the eye. The experiments were done in the presence of 1% human serum. Values are means ± SEM (n = 3).

References

    1. Wang Y, et al. Systemic delivery of modified mRNA encoding herpes simplex virus 1 thymidine kinase for targeted cancer gene therapy. Mol Ther. 2013;21:358–367. - PMC - PubMed
    1. Zangi L, et al. Modified mRNA directs the fate of heart progenitor cells and induces vascular regeneration after myocardial infarction. Nat Biotechnol. 2013;31:898–907. - PMC - PubMed
    1. Kormann MSD, et al. Expression of therapeutic proteins after delivery of chemically modified mRNA in mice. Nat Biotechnol. 2011;29:154–157. - PubMed
    1. Yin H, et al. Non-viral vectors for gene-based therapy. Nat Rev Genet. 2014;15:541–555. - PubMed
    1. Dowdy SF. Overcoming cellular barriers for RNA therapeutics. Nat Biotechnol. 2017;35:222–229. - PubMed

Publication types