. 2018 Apr 17;115(16):4182-4187.
doi: 10.1073/pnas.1716578115. Epub 2018 Mar 27.

TWEAK and RIPK1 mediate a second wave of cell death during AKI

Affiliations

TWEAK and RIPK1 mediate a second wave of cell death during AKI

Diego Martin-Sanchez et al. Proc Natl Acad Sci U S A. .

Erratum in

Abstract

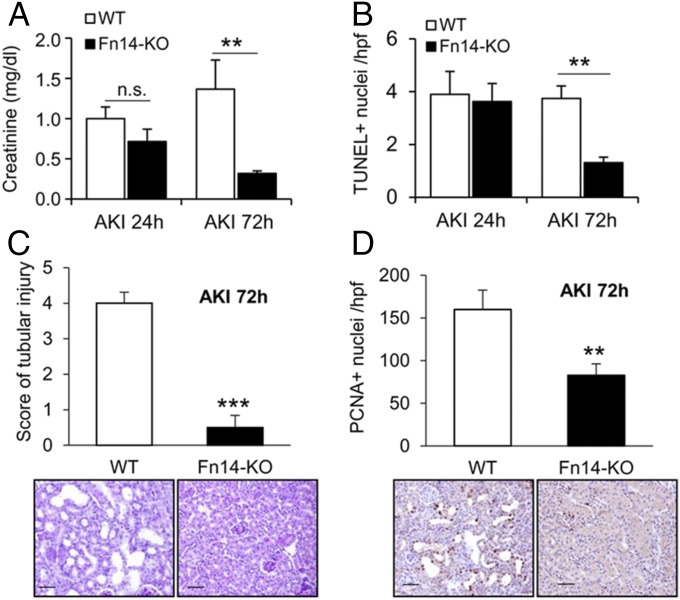
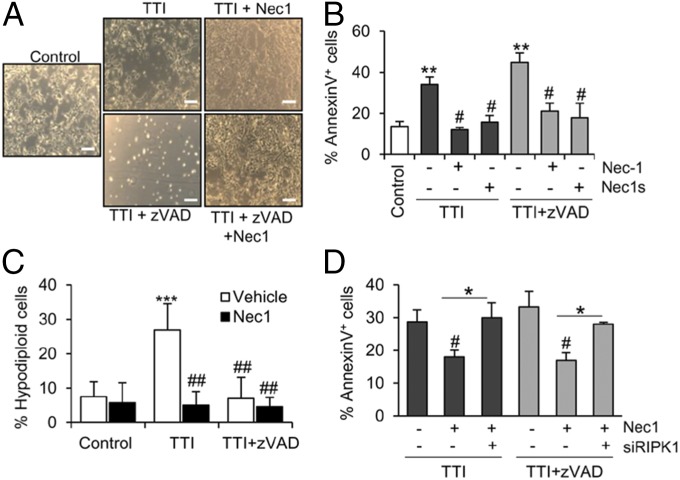
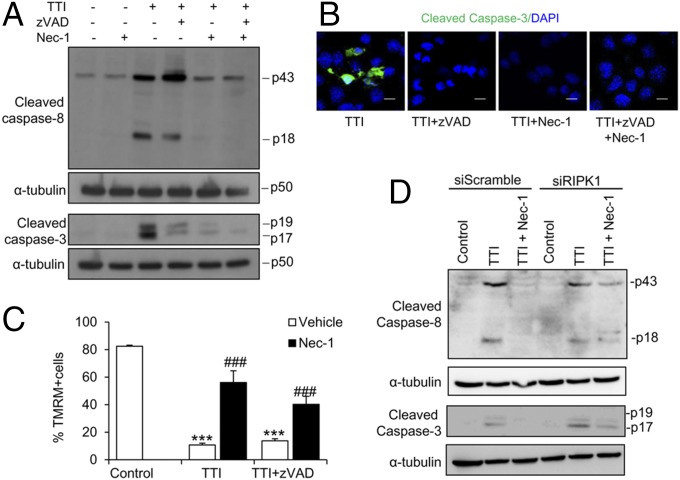
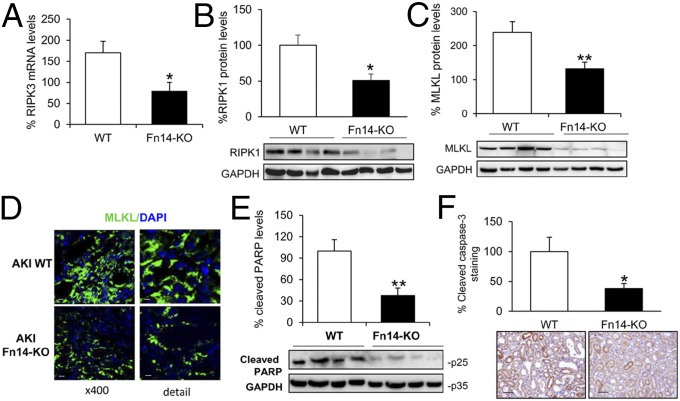
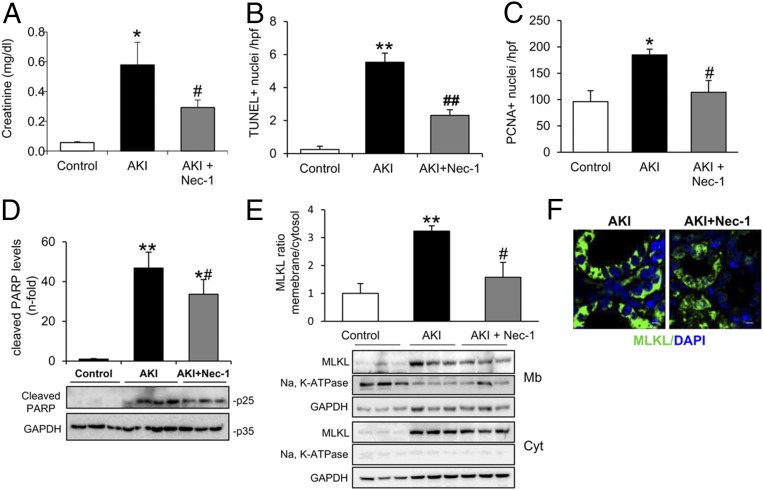
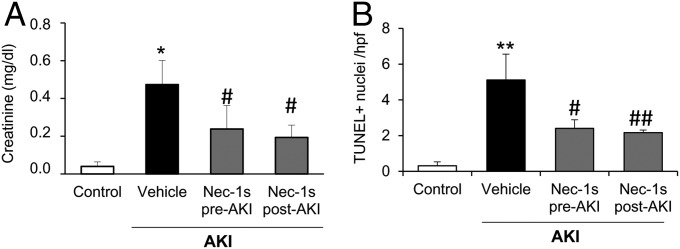
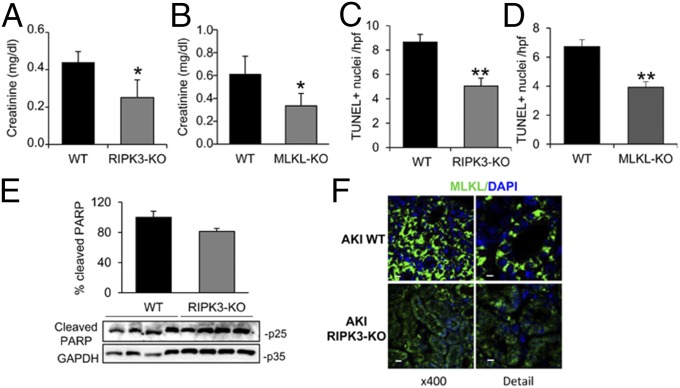
Acute kidney injury (AKI) is characterized by necrotic tubular cell death and inflammation. The TWEAK/Fn14 axis is a mediator of renal injury. Diverse pathways of regulated necrosis have recently been reported to contribute to AKI, but there are ongoing discussions on the timing or molecular regulators involved. We have now explored the cell death pathways induced by TWEAK/Fn14 activation and their relevance during AKI. In cultured tubular cells, the inflammatory cytokine TWEAK induces apoptosis in a proinflammatory environment. The default inhibitor of necroptosis [necrostatin-1 (Nec-1)] was protective, while caspase inhibition switched cell death to necroptosis. Additionally, folic acid-induced AKI in mice resulted in increased expression of Fn14 and necroptosis mediators, such as receptor-interacting protein kinase 1 (RIPK1), RIPK3, and mixed lineage domain-like protein (MLKL). Targeting necroptosis with Nec-1 or by genetic RIPK3 deficiency and genetic Fn14 ablation failed to be protective at early time points (48 h). However, a persistently high cell death rate and kidney dysfunction (72-96 h) were dependent on an intact TWEAK/Fn14 axis driving necroptosis. This was prevented by Nec-1, or MLKL, or RIPK3 deficiency and by Nec-1 stable (Nec-1s) administered before or after induction of AKI. These data suggest that initial kidney damage and cell death are amplified through recruitment of inflammation-dependent necroptosis, opening a therapeutic window to treat AKI once it is established. This may be relevant for clinical AKI, since using current diagnostic criteria, severe injury had already led to loss of renal function at diagnosis.

Keywords: AKI; Fn14; RIPK1; TWEAK; cell death.


Conflict of interest statement

The authors declare no conflict of interest.

Figures

Fig. 1.
Fig. 1.
Fn14 deficiency preserves renal function and reduces cell death in folic acid-induced AKI. AKI was induced by a folic acid overdose in WT and Fn14-KO mice. Mice were killed at 24 and 72 h. (A) Renal function assessed by plasma creatinine. (B) Cell death was assessed by TUNEL staining. (C) Histological injury score. Representative images of PAS staining and quantification according to a tubular damage score. Original magnification, 200×. (Scale bars: 50 µm.) (D) Immunohistochemistry of PCNA and quantification. Original magnification, 200×. Data are expressed as mean ± SEM of n = 7 mice per group. **P < 0.01; ***P < 0.001. n.s., nonsignificant.
Fig. 2.
Fig. 2.
Nec-1 and Nec-1s prevent cell death induced by TWEAK/TNFα/IFNγ (TTI) in cultured tubular cells. Cultured tubular cells were pretreated with zVAD and/or Nec-1 or Nec-1s for 1 h and subsequently stimulated with TTI for 24 h. (A) Representative contrast phase microscopy photographs of tubular cells (original magnification, 200×) are depicted. (Scale bars: 200 μM.) (B) Percentage of annexin V positive tubular cells. **P < 0.01 vs. control; #P < 0.05 vs. vehicle. (C) Percentage of hypodiploid cells. ***P < 0.001 vs. control; ##P < 0.01 vs. TTI alone. (D) Effect of RIPK1 targeting over protection provided by Nec-1. Percentage of annexin V positive cells at 24 h. *P < 0.05; #P < 0.05 vs. TTI or TTI/zVAD alone. Data are expressed as mean ± SEM of three independent experiments.
Fig. 3.
Fig. 3.
RIPK3 and MLKL play a key role in TTI/zVAD-induced cell death but not in TTI-induced apoptosis in MCT cells. (A) p-MLKL protein levels in cultured mouse tubular cells following exposure to TTI or TTI/zVAD. (B) p-MLKL protein levels in tubular cells transfected with a RIPK3 siRNA and exposed to TTI/zVAD for 6 h. (C) Percentage of annexin V positive tubular cells transfected with RIPK3, MLKL, or control (Scramble) siRNA. *P < 0.05 vs. control; #P < 0.05 vs. TTI/zVAD with siScramble. (D) Cell viability assessed by the MTT assay in tubular cells treated with the RIPK3 inhibitor GSK872 (1 µM). ***P < 0.001 vs. control; ###P < 0.001 vs. TTI/zVAD alone. (C and D) Data are expressed as mean ± SEM of three independent experiments.
Fig. 4.
Fig. 4.
Role of RIPK1 in TTI/zVAD-induced necroptosis in cultured tubular cells. (A) p-MLKL protein levels in tubular cells exposed to TTI with zVAD and Nec-1 for 6 h. (B) MCT cells were transfected with specific siRNA against RIPK1. After 24 h, the expression of RIPK1 was checked by Western blot. (C) Percentage of annexin V positive tubular cells transfected with RIPK1 or control siRNA after 24 h of treatment. **P < 0.01 vs. control. (D) p-MLKL protein in tubular cells transfected with a RIPK1 or control siRNA after 6 h of treatment. (E) Pretreatment with a RIPK3 inhibitor (GSK872) in MCT cells transfected with RIPK1 or control siRNA and treated with TTI or TTI + zVAD. Cell viability was assessed by MTT. ***P < 0.001; *P < 0.05. (F) p-MLKL is prevented with GSK872 pretreatment in MCT cells transfected with RIPK1 or control siRNA and treated with TTI or TTI + zVAD. (A, B, D, and F) Representative Western blots of three independent experiments are shown. (C and E) Mean ± SEM of three independent experiments.
Fig. 5.
Fig. 5.
Nec-1 prevents caspase activation in cultured tubular cells. (A) Cleaved caspase-8 and cleaved caspase-3 proteins in tubular cells exposed to TTI or TTI + zVAD for 6 h following pretreatment with Nec-1. (B) Cleaved caspase-3 staining, detected by immunofluorescence. Cleaved caspase 3 is shown in green and DAPI, in blue. Original magnification, 630×. (Scale bars: 15 µm.) (C) MMP in tubular cells at 24 h of treatment. Graph shows TMRM staining. Data are expressed as mean ± SEM of three independent experiments. ***P < 0.001 vs. control; ###P < 0.001 vs. TTI or TTI/zVAD vehicle. (D) Cleaved caspase-8 and cleaved caspase-3 proteins in tubular cells transfected with a RIPK1 or control siRNA and exposed to TTI for 6 h. (A and D) Representative Western blots of three independent experiments are demonstrated.
Fig. 6.
Fig. 6.
Fn14 regulates the expression of necroptosis proteins during AKI at 72 h. (AC) RIPK3 mRNA levels and RIPK1 and MLKL protein levels at 72 h of AKI. (D) MLKL immunofluorescence in AKI at 72 h. Representative images are shown. Magnification, 400× (scale bars: 10 μm); detail, 800× (scale bars: 5 μm). (E) Cleaved PARP protein levels in AKI at 72 h. Quantification and representative Western blots are shown. (F) Cleaved caspase-3 staining and quantification. Original magnification, 200×. (Scale bars: 50 µm.) (AC, E, and F) Data are expressed as mean ± SEM of seven mice per group. *P < 0.05 vs. WT mice; **P < 0.01 vs. WT mice.
Fig. 7.
Fig. 7.
Nec-1 functionally prevents folic acid-induced AKI at 96 h in mice. (A) Renal function assessed by plasma creatinine levels. (B) Cell death assessed by TUNEL. (C) Cell proliferation assessed by PCNA staining. (D) Quantification and representative Western blot of cleaved PARP. (E) Western blot analysis demonstrating that MLKL locates at the membrane during AKI and this is partially prevented with Nec-1. (F) MLKL membrane accumulation is reduced with Nec-1 treatment. Representative images of confocal microscopy. Magnification, 800×. (Scale bars: 5 µm.) (AE) Data expressed as mean ± SEM of n = 10 mice per group. *P < 0.05 vs. control; **P < 0.01 vs. control; #P < 0.05 vs. AKI; ##P < 0.01 vs. AKI.
Fig. 8.
Fig. 8.
Nec-1s prevents features of AKI at 96 h. Nec-1s was administered either before or 6 h after induction of folic acid-AKI and then daily until 96 h. (A) Renal function assessed by plasma creatinine levels. (B) Cell death assessed by TUNEL. Data are expressed as mean ± SEM of n = 5 mice per group. *P < 0.05 vs. control; **P < 0.01 vs. control; #P < 0.05 vs. AKI; ##P < 0.01 vs. AKI.
Fig. 9.
Fig. 9.
RIPK3 and MLKL deficiency prevents features of AKI at 96 h. (A and B) Renal function assessed by plasma creatinine levels. (C and D) Cell death assessed by TUNEL staining. (E) Cleaved PARP protein levels in AKI at 72 h. Quantification and representative Western blots are shown. (F) Representative images of confocal microscopy of MLKL localization. Magnification, 400× (scale bars: 10 μm); detail, 800× (scale bars: 5 μm). Data are expressed as mean ± SEM of n = 5–10 mice per group. *P < 0.05; **P < 0.01.

References

    1. Siew ED, et al. Predictors of recurrent AKI. J Am Soc Nephrol. 2015;27:1190–1200. - PMC - PubMed
    1. Bellomo R, Kellum JA, Ronco C. Acute kidney injury. Lancet. 2012;380:756–766. - PubMed
    1. Linkermann A, Stockwell BR, Krautwald S, Anders HJ. Regulated cell death and inflammation: An auto-amplification loop causes organ failure. Nat Rev Immunol. 2014;14:759–767. - PubMed
    1. Linkermann A, et al. Two independent pathways of regulated necrosis mediate ischemia-reperfusion injury. Proc Natl Acad Sci USA. 2013;110:12024–12029. - PMC - PubMed
    1. Martin-Sanchez D, et al. Ferroptosis, but not necroptosis, is important in nephrotoxic folic acid-induced AKI. J Am Soc Nephrol. 2017;28:218–229. - PMC - PubMed

Publication types

MeSH terms