. 2018 Mar 27;8(1):5252.
doi: 10.1038/s41598-018-23519-8.

A unified framework for modelling sediment fate from source to sink and its interactions with reef systems over geological times

Affiliations

A unified framework for modelling sediment fate from source to sink and its interactions with reef systems over geological times

Tristan Salles et al. Sci Rep. .

Abstract

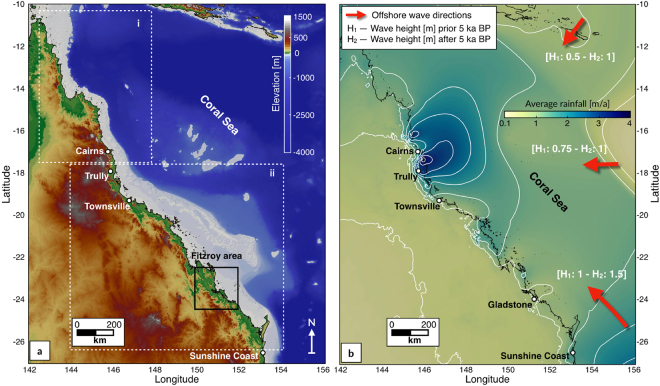
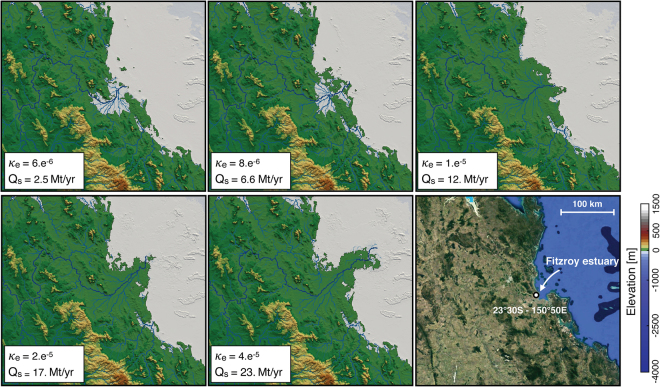
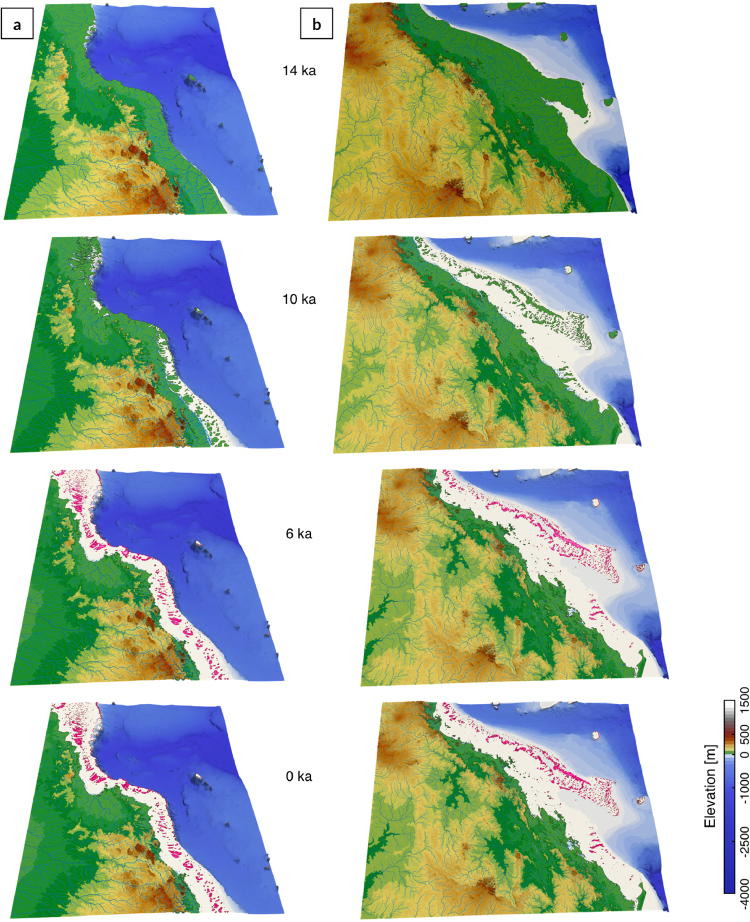
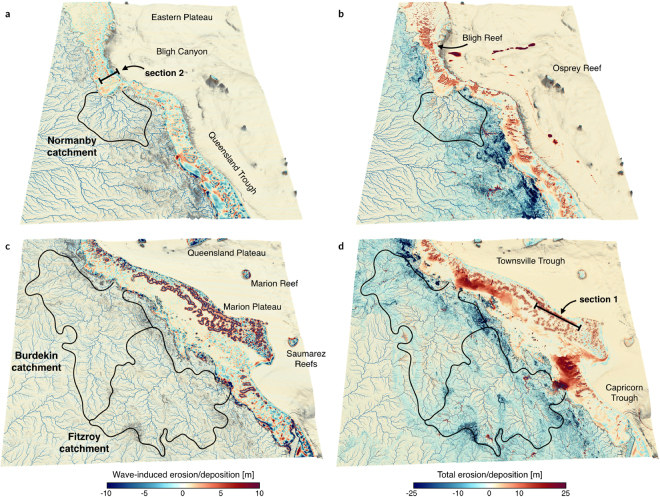
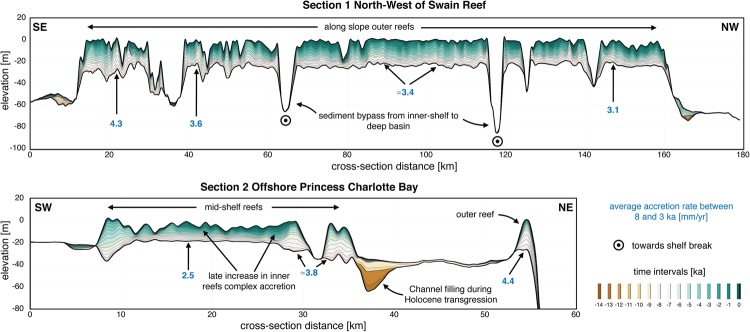
Understanding the effects of climatic variability on sediment dynamics is hindered by limited ability of current models to simulate long-term evolution of sediment transfer from source to sink and associated morphological changes. We present a new approach based on a reduced-complexity model which computes over geological time: sediment transport from landmasses to coasts, reworking of marine sediments by longshore currents, and development of coral reef systems. Our framework links together the main sedimentary processes driving mixed siliciclastic-carbonate system dynamics. It offers a methodology for objective and quantitative sediment fate estimations over regional and millennial time-scales. A simulation of the Holocene evolution of the Great Barrier Reef shows: (1) how high sediment loads from catchments erosion prevented coral growth during the early transgression phase and favoured sediment gravity-flows in the deepest parts of the northern region basin floor (prior to 8 ka before present (BP)); (2) how the fine balance between climate, sea-level, and margin physiography enabled coral reefs to thrive under limited shelf sedimentation rates after ~6 ka BP; and, (3) how since 3 ka BP, with the decrease of accommodation space, reduced of vertical growth led to the lateral extension of reefs consistent with available observational data.


Conflict of interest statement

The authors declare no competing interests.

Figures

Figure 1
Figure 1
(a) Map shows the extend of the 2 regions (i-north, ii-south) of the GBR used in this study (source: Project 3DGBR-eAtlas.org.au). (b) Background map shows the average rainfall annual distribution based on 30-year records (1961–1990) encompassing several ENSO events (7 El Niño - 5 La Niña) (source: Bureau of Meteorology). White lines highlight precipitation 0.5 m/a contours. Red arrows define prevailing annual offshore wave directions scaled based on their annual activity. Wave heights (H) imposed for the considered 2 climatic scenarios from 14 to 5 ka and from 5 ka to present. Both maps were generated using Paraview (V 5.2.0).
Figure 2
Figure 2
Sensitivity analysis of erodibility coefficient (κe in eq. 1) at final time step for 5 simulations showing its effects on sediment accumulation (Mt/yr) and Fitzroy delta progradation (Fitzroy area is shown in Fig. 1a) visualised with Paraview (V 5.2.0). Lower right panel presents today’s topography from Map Data @2018 GBRMPA, Google.
Figure 3
Figure 3
Model outputs for initial time step (14 ka), 10 ka, 6 ka and final step. Left and right panels show the evolution for the northern (a) and southern (b) parts of the GBR through the Holocene period (respectively i & ii regions in Fig. 1a). Pink color displays presence of coral reef at given time intervals. Model outputs are visualised using Paraview (V 5.2.0).
Figure 4
Figure 4
Maps of cumulative erosion/deposition in metres at final time step for the northern (a and b panels) and southern (c and d) GBR regions visualised using Paraview (V 5.2.0). Left panels (a and c) display the cumulative effects of wave-induced erosion and deposition over the simulated period (14 ka). Right panels (b and d) show the erosion, deposition and reef evolution for the 14 ka induced by the combination of fluvial and waves processes as well as reef growth. Sections 1 and 2 are the locations of the stratigraphic cross-sections displayed in Fig. 5.
Figure 5
Figure 5
Cross sections through the model predicted stratigraphy showing time layers of mixed siliciclastic-carbonate accretion NW of Swain Reef and offshore of Princess Charlotte Bay (regional locations of these sections are presented in Fig. 4).
Figure 6
Figure 6
(a) 3D view of the GBR between Cairns and Cooktown highlighting sediment transport from mountain ranges to the coast, and from the coast to the Queensland Trough (generated using Paraview (V 5.2.0)). On the inner shelf dominant wave direction (SE) rework sediments to the North (black arrows). On the mid shelf, coral reef develops. Sediment transfer across the slope happens through V-shaped canyons. White lines (1–2–3) mark the location of seismic lines in b. (b) Topas seismic section illustrating sediment gravity flow (SGF) and thin-bedded deposits for Canyon 8. (c) 3D view of the Noggin region (canyons and slope) with draped GLORIA side-scan sonar backscatter imagery. High-reflectivity (white toned) areas correspond to SGFs and landslide deposits (b and c are adapted from Puga-Bernabéu et al.).

References

    1. DeConto RM, Pollard D. Contribution of antarctica to past and future sea-level rise. Nature. 2016;531:591. doi: 10.1038/nature17145. - DOI - PubMed
    1. IPCC. Climate Change 2014: Synthesis Report Contribution of Working Groups I, II and III to the Fifth Assessment Report of the Intergovernmental Panel on Climate Change. Tech. Rep., IPCC, Geneva, Switzerland, pp. 151 (2014).
    1. Lamb HH. Climate: Past, Present, and Future, 2. London: Methuen; 1977.
    1. Cox PM, Betts RA, Jones CD, Spall SA, Totterdell IJ. Acceleration of global warming due to carbon-cycle feedbacks in a coupled climate model. Nature. 2000;408:184–7. doi: 10.1038/35041539. - DOI - PubMed
    1. Syvitski JPM, Vörösmarty CJ, Kettner AJ, Green P. Impact of humans on the flux of terrestrial sediment to the global coastal ocean. Science. 2005;308:376–380. doi: 10.1126/science.1109454. - DOI - PubMed

Publication types

LinkOut - more resources