. 2018 Mar 27;8(1):5254.
doi: 10.1038/s41598-018-23400-8.

Sequence-dependent catalytic regulation of the SpoIIIE motor activity ensures directionality of DNA translocation

Affiliations

Sequence-dependent catalytic regulation of the SpoIIIE motor activity ensures directionality of DNA translocation

Osvaldo Chara et al. Sci Rep. .

Abstract

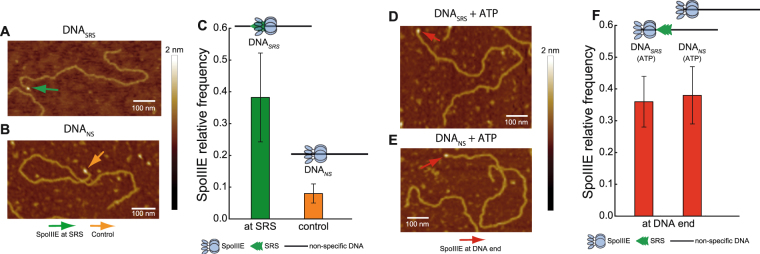
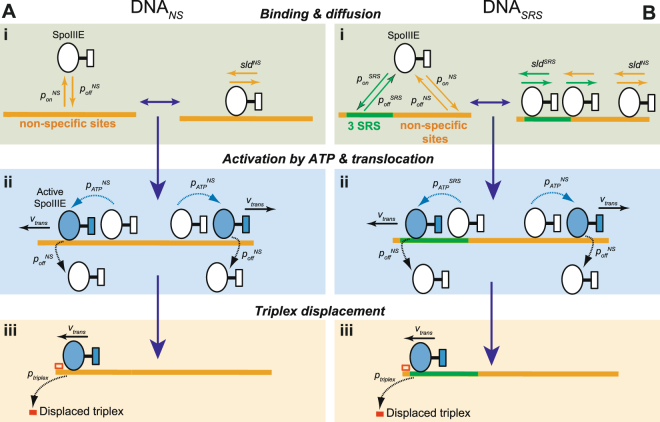
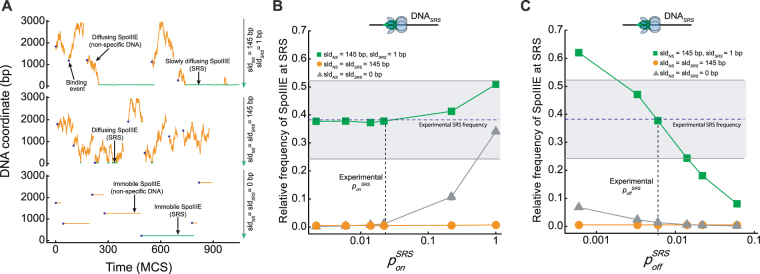
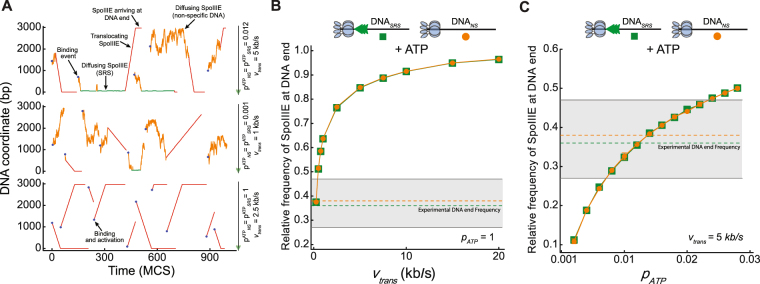
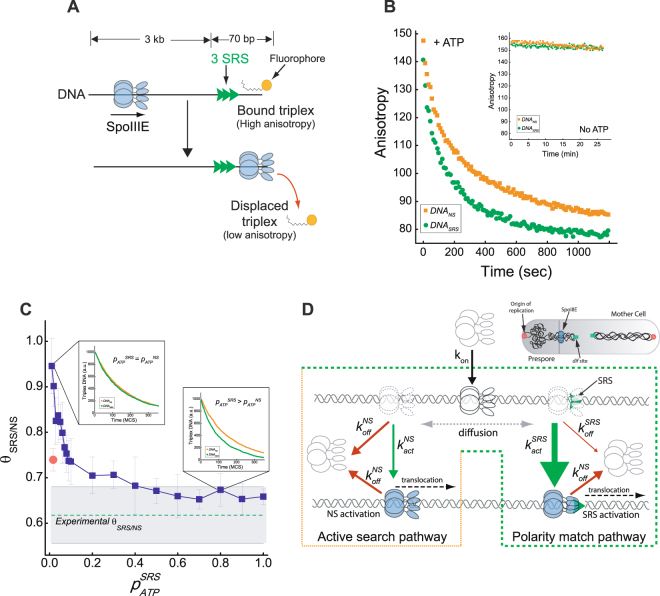
Transport of cellular cargo by molecular motors requires directionality to ensure proper biological functioning. During sporulation in Bacillus subtilis, directionality of chromosome transport is mediated by the interaction between the membrane-bound DNA translocase SpoIIIE and specific octameric sequences (SRS). Whether SRS regulate directionality by recruiting and orienting SpoIIIE or by simply catalyzing its translocation activity is still unclear. By using atomic force microscopy and single-round fast kinetics translocation assays we determined the localization and dynamics of diffusing and translocating SpoIIIE complexes on DNA with or without SRS. Our findings combined with mathematical modelling revealed that SpoIIIE directionality is not regulated by protein recruitment to SRS but rather by a fine-tuned balance among the rates governing SpoIIIE-DNA interactions and the probability of starting translocation modulated by SRS. Additionally, we found that SpoIIIE can start translocation from non-specific DNA, providing an alternative active search mechanism for SRS located beyond the exploratory length defined by 1D diffusion. These findings are relevant in vivo in the context of chromosome transport through an open channel, where SpoIIIE can rapidly explore DNA while directionality is modulated by the probability of translocation initiation upon interaction with SRS versus non-specific DNA.


Conflict of interest statement

The authors declare no competing interests.

Figures

Figure 1
Figure 1
SpoIIIE can actively translocate and reach DNA ends even in the absence of SRS sequences. (A,B) AFM micrographs of SpoIIIE bound to SRS (DNASRS) and to non-specific DNA (DNANS) in the absence of ATP. Arrows indicate SpoIIIE complexes bound to SRS (green arrow in panel A) and to equivalent position replaced by non-specific DNA as a control (orange arrow in panel B). (C) Relative frequency of SpoIIIE binding to SRS (DNASRS) or to the equivalent position replaced by non-specific DNA (DNANS, control). The position of SpoIIIE complexes in DNA was determined using a semi-automated algorithm and the relative frequency of SpoIIIE localization in bins of 50 nm was calculated (see Fig. S1A,B, Material and Methods and Supplementary Information). Error bars were obtained from the error propagation of Eq. 1 (n = 35). Upper scheme represents SpoIIIE bound to SRS and to the equivalent position replaced by non-specific DNA. (D,E) AFM micrographs of SpoIIIE complexes with DNASRS and DNANS substrates in the presence of ATP. Red arrows indicate SpoIIIE complexes that have reached the DNA ends by translocation. (F) Relative frequency of SpoIIIE reaching DNA ends by translocation in substrates with (DNASRS) or without (DNANS) SRS. The position of SpoIIIE complexes in DNA was determined as described in panel C (see Fig. S1C,D, n = 40). Upper scheme represents SpoIIIE reaching the DNA ends for substrates with or without SRS. Relative frequencies depicted in panel C were recalculated from previously published data.
Figure 2
Figure 2
Scheme of the mathematical model encoding the dynamics of SpoIIIE/DNA interaction. (A,B) In the model SpoIIIE can interact with non-specific DNA (DNANS, A) and SRS containing DNA (DNASRS, B). The dynamics of non-active SpoIIIE (i) were modelled as a Markov process controlled by the SpoIIIE binding/unbinding probabilities (pon/poff) to/from non-specific or SRS regions of DNA (orange and green solid lines respectively). Once bound to DNA, SpoIIIE can undergo 1D diffusion defined by the sliding length sld. In the presence of ATP (ii), SpoIIIE can become active with a probability pATP and translocate at constant velocity (vtrans). Probabilities of binding, unbinding, sliding lengths and activation by ATP could be set to distinct values depending on the DNA substrate. When the triplex was present (iii), translocating SpoIIIE can displace the triplex when reaching the corresponding DNA end with probability ptriplex. See Material and Methods and Supplementary Information for additional details.
Figure 3
Figure 3
Model predicted dynamics and distributions of SpoIIIE in DNASRS in the absence of ATP. (A) Representative trajectories of SpoIIIE interacting with DNASRS in the absence of ATP. Each panel represents a DNA molecule where the sliding properties of SpoIIIE when interacting with SRS and non-specific DNA were varied with parameter values shown on the right of each panel. The rest of the parameters were set to the optimal values depicted in Table 1. Horizontal and vertical axis represent time evolution in Monte Carlo steps (MCS) and DNA coordinate (in base pairs, bp), respectively. SpoIIIE binding events are shown by solid blue hexagons and trajectories are shown in orange and green when interacting with non-specific DNA and SRS, respectively. Scheme on the right depicts non-specific DNA regions (solid black line) and SRS sites (semi-transparent green triangles). (B,C) The model-predicted relative frequency of SpoIIIE at SRS sequences in the absence of ATP was evaluated as function of the SpoIIIE/SRS association and dissociation probabilities (ponSRS and poffSRS for panels B and C, respectively) one order of magnitude above and below the values reproducing AFM distributions while the rest of the parameter values were set to the values described in Table 1. Simulations were performed in the absence of 1D diffusion (grey triangles), including homogeneous (orange circles) and anomalous (green squares) sliding between non-specific DNA and SRS with values depicted in the inset of the figure. Solid lines connecting dots are only a guide to the eye. Blue dotted line and grey shaded area indicate the mean experimental relative frequency of SpoIIIE binding at SRS and standard deviation respectively as obtained from Fig. 1C. Dotted black vertical line indicates the association and dissociation probability values defined from experimental data (see Methods and Supplementary Information). Upper scheme represents SpoIIIE bound to SRS.
Figure 4
Figure 4
Model predicted dynamics and distributions of SpoIIIE in DNASRS and DNANS in the presence of ATP. (A) Representative trajectories of SpoIIIE when interacting with DNASRS in the presence of ATP. Each panel represents a DNA molecule where the activation probability (pATP) and translocating velocity (vtrans) were varied with values shown on the right of each panel. The rest of the parameters were set at the values depicted in Table 1. Horizontal and vertical axis represent time evolution in Monte Carlo steps (MCS) and DNA coordinates (in base pairs, bp), respectively. Color code from Fig. 3A is conserved and translocating proteins are depicted in red. Translocation velocity was reduced 10 times with respect to the value depicted on the right solely for representation purposes. Scheme on the right depicts non-specific DNA regions (solid black line) and SRS sites (semi-transparent green triangles). (B,C) Model-predicted relative frequency of SpoIIIE reaching DNA ends for DNASRS (green squares) and DNANS (orange circles) as a function of translocation velocity with ATP activation probability pATP = 1 (B) and as a function of pATP for different translocation velocities (C). Solid lines connecting dots are only a guide to the eye. Orange and green dashed lines and grey shadow area indicate the experimental mean relative frequency and standard deviation respectively for both substrates in the presence of ATP. All other parameter values were set at the values depicted in Table 1. Upper scheme represents SpoIIIE reaching the DNA ends for substrates with or without SRS.
Figure 5
Figure 5
SRS enhances ATP-dependent translocation activity of SpoIIIE. (A) Scheme representing the triplex displacement experimental design. (B) Time course of triplex displacement by SpoIIIE for substrates with (green circles) or without (orange squares) SRS sequences in the presence of ATP. Inset shows that in the absence of ATP, SpoIIIE is unable to displace the triplex. (C) Effect of SRS in triplex displacement rates quantified as the ratio between the area under the kinetic traces for DNASRS and DNANS (θSRS/NS). Blue squares and error bars indicate mean and standard deviation from the simulation results by varying pATPSRS while maintaining pATPNS constant at 0.012. Red circle depicts the result expected for the ‘recruitment and orient’ directionality model (see main text). Green dotted line and grey shaded area indicate the mean and standard deviation of θSRS/NS obtained from the experimental results shown in panel B (n = 3). Solid blue lines connecting squares are only a guide to the eye. Insets depict the time courses for triplex displacement obtained from simulations when pATPSRS = pATPNS (left) and pATPSRS = 0.8 (right). Parameter values for simulations are depicted in Table 1. (D) SpoIIIE in vivo directionality mechanism. Free, bound, diffusing and active SpoIIIE are represented in grey, black, dotted grey and filled light blue respectively. Dotted green and orange contour lines represent the two alternative pathways for SpoIIIE directionality regulation. Upon binding (black arrow) SpoIIE can explore DNA by diffusion (dotted grey arrow) and/or dissociate (red arrows) and/or become active (green arrows). Once active SpoIIIE can translocate (dashed black arrows). Thickness of red and green arrows is proportional to the rate/probability values obtained from experimental and modelling optimized parameter values when SpoIIIE is interacting with non-specific or SRS sequences. Upper scheme depicts a B. subtilis cell in the initial stages of sporulation. oriC regions (red circles) move towards the cell poles and after asymmetric division SpoIIIE (blue circles) is recruited to the septum to transport two-thirds of the chromosome into the forespore.

References

    1. Burton B, Dubnau D. Membrane-associated DNA transport machines. Cold Spring Harb. Perspect. Biol. 2010;2:a000406. doi: 10.1101/cshperspect.a000406. - DOI - PMC - PubMed
    1. Wu LJ, Errington J. Bacillus subtilis SpoIIIE protein required for DNA segregation during asymmetric cell division. Science. 1994;264:572–575. doi: 10.1126/science.8160014. - DOI - PubMed
    1. Sharpe ME, Errington J. Postseptational chromosome partitioning in bacteria. Proc. Natl. Acad. Sci. USA. 1995;92:8630–8634. doi: 10.1073/pnas.92.19.8630. - DOI - PMC - PubMed
    1. Wu LJ, Errington J. Septal localization of the SpoIIIE chromosome partitioning protein in Bacillus subtilis. EMBO J. 1997;16:2161–2169. doi: 10.1093/emboj/16.8.2161. - DOI - PMC - PubMed
    1. Bath J, Wu LJ, Errington J, Wang JC. Role of Bacillus subtilis SpoIIIE in DNA transport across the mother cell-prespore division septum. Science. 2000;290:995–997. doi: 10.1126/science.290.5493.995. - DOI - PubMed

Publication types

LinkOut - more resources