

Topological estimation of signal flow in complex signaling networks
- PMID: 29588498
- PMCID: PMC5869720
- DOI: 10.1038/s41598-018-23643-5
Topological estimation of signal flow in complex signaling networks
Abstract
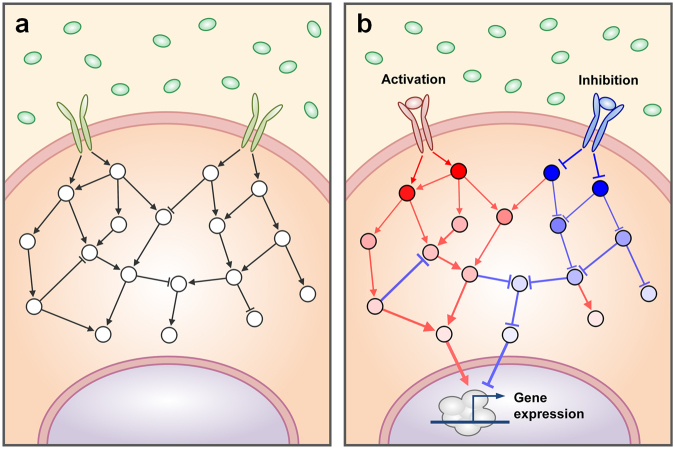
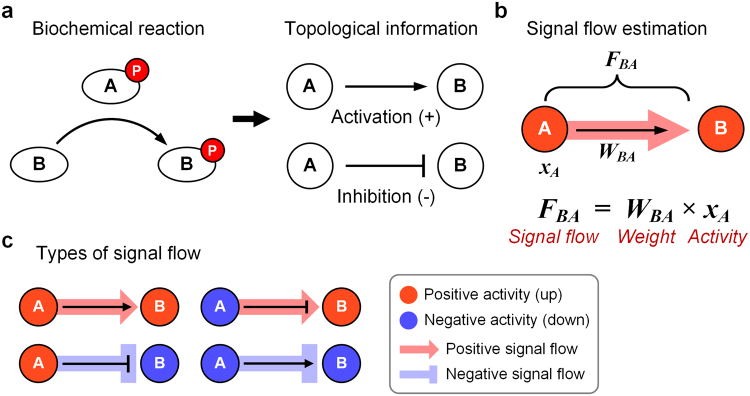
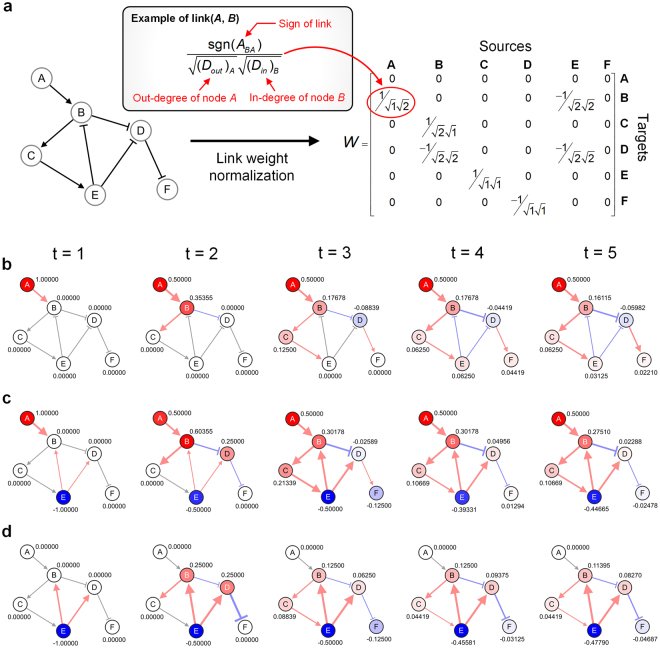
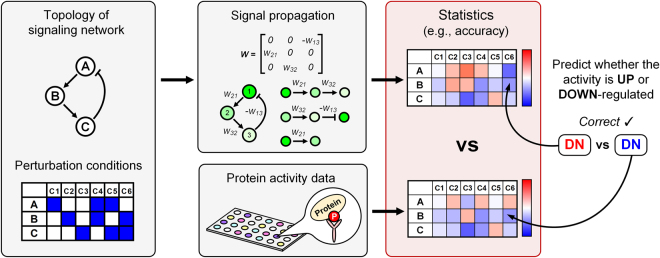
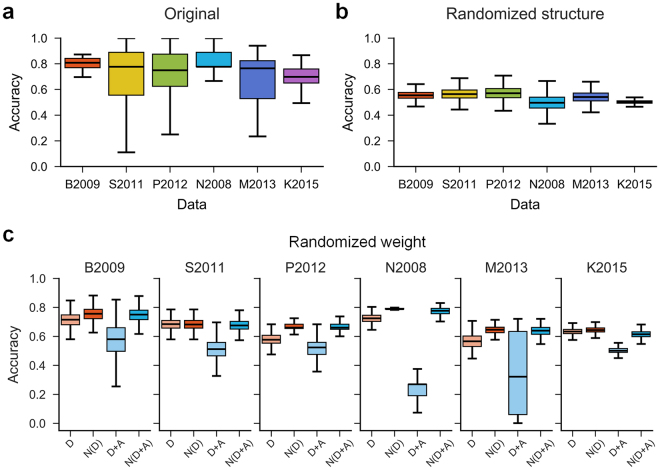
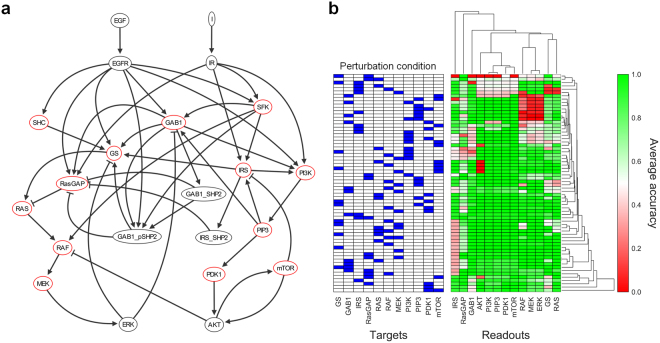
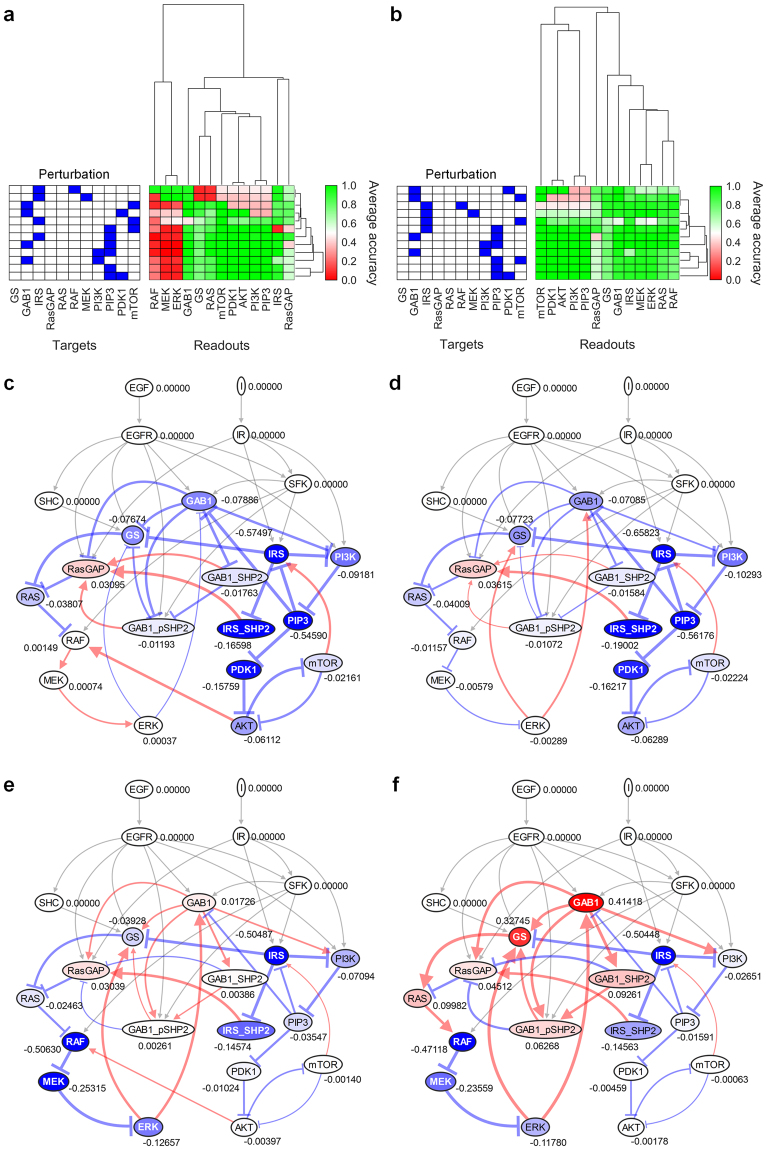
In a cell, any information about extra- or intra-cellular changes is transferred and processed through a signaling network and dysregulation of signal flow often leads to disease such as cancer. So, understanding of signal flow in the signaling network is critical to identify drug targets. Owing to the development of high-throughput measurement technologies, the structure of a signaling network is becoming more available, but detailed kinetic parameter information about molecular interactions is still very limited. A question then arises as to whether we can estimate the signal flow based only on the structure information of a signaling network. To answer this question, we develop a novel algorithm that can estimate the signal flow using only the topological information and apply it to predict the direction of activity change in various signaling networks. Interestingly, we find that the average accuracy of the estimation algorithm is about 60-80% even though we only use the topological information. We also find that this predictive power gets collapsed if we randomly alter the network topology, showing the importance of network topology. Our study provides a basis for utilizing the topological information of signaling networks in precision medicine or drug target discovery.
Conflict of interest statement
The authors declare no competing interests.
Figures
Similar articles
-
Signal flow control of complex signaling networks.Sci Rep. 2019 Oct 3;9(1):14289. doi: 10.1038/s41598-019-50790-0. Sci Rep. 2019. PMID: 31582789 Free PMC article.
-
k-Partite cliques of protein interactions: A novel subgraph topology for functional coherence analysis on PPI networks.J Theor Biol. 2014 Jan 7;340:146-54. doi: 10.1016/j.jtbi.2013.09.013. Epub 2013 Sep 19. J Theor Biol. 2014. PMID: 24056214
-
Complete Topological Mapping of a Cellular Protein Interactome Reveals Bow-Tie Motifs as Ubiquitous Connectors of Protein Complexes.Cell Rep. 2020 Jun 16;31(11):107763. doi: 10.1016/j.celrep.2020.107763. Cell Rep. 2020. PMID: 32553166
-
Network-based characterization of drug-regulated genes, drug targets, and toxicity.Methods. 2012 Aug;57(4):499-507. doi: 10.1016/j.ymeth.2012.06.003. Epub 2012 Jun 27. Methods. 2012. PMID: 22749929 Review.
-
Interaction networks: from protein functions to drug discovery. A review.Pathol Biol (Paris). 2009 Jun;57(4):324-33. doi: 10.1016/j.patbio.2008.10.004. Epub 2008 Dec 13. Pathol Biol (Paris). 2009. PMID: 19070972 Review.
Cited by
-
Cell-Type-Specific Gene Regulatory Networks of Pro-Inflammatory and Pro-Resolving Lipid Mediator Biosynthesis in the Immune System.Int J Mol Sci. 2023 Feb 22;24(5):4342. doi: 10.3390/ijms24054342. Int J Mol Sci. 2023. PMID: 36901771 Free PMC article.
-
From time-series transcriptomics to gene regulatory networks: A review on inference methods.PLoS Comput Biol. 2023 Aug 10;19(8):e1011254. doi: 10.1371/journal.pcbi.1011254. eCollection 2023 Aug. PLoS Comput Biol. 2023. PMID: 37561790 Free PMC article. Review.
-
NETISCE: a network-based tool for cell fate reprogramming.NPJ Syst Biol Appl. 2022 Jun 20;8(1):21. doi: 10.1038/s41540-022-00231-y. NPJ Syst Biol Appl. 2022. PMID: 35725577 Free PMC article.
-
Signal flow control of complex signaling networks.Sci Rep. 2019 Oct 3;9(1):14289. doi: 10.1038/s41598-019-50790-0. Sci Rep. 2019. PMID: 31582789 Free PMC article.
-
Control of Cellular Differentiation Trajectories for Cancer Reversion.Adv Sci (Weinh). 2025 Jan;12(3):e2402132. doi: 10.1002/advs.202402132. Epub 2024 Dec 11. Adv Sci (Weinh). 2025. PMID: 39661721 Free PMC article.
References
Publication types
MeSH terms
Substances
LinkOut - more resources
Full Text Sources
Other Literature Sources
